HAL Id: insu-01205741
https://hal-insu.archives-ouvertes.fr/insu-01205741
Submitted on 16 Nov 2016
HAL is a multi-disciplinary open access
archive for the deposit and dissemination of
sci-entific research documents, whether they are
pub-lished or not. The documents may come from
teaching and research institutions in France or
abroad, or from public or private research centers.
L’archive ouverte pluridisciplinaire HAL, est
destinée au dépôt et à la diffusion de documents
scientifiques de niveau recherche, publiés ou non,
émanant des établissements d’enseignement et de
recherche français ou étrangers, des laboratoires
publics ou privés.
Morphology and dynamics of the jets of comet
67P/Churyumov-Gerasimenko: Early-phase
development
Z.-Y. Lin, W.-H. Ip, I.-L. Lai, J.-C. Lee, Jean-Baptste Vincent, Luisa M. Lara,
Dennis Bodewits, Holger Sierks, Cesare Barbieri, Philippe L. Lamy, et al.
To cite this version:
Z.-Y. Lin, W.-H. Ip, I.-L. Lai, J.-C. Lee, Jean-Baptste Vincent, et al.. Morphology and dynamics of the
jets of comet 67P/Churyumov-Gerasimenko: Early-phase development. Astronomy and Astrophysics
- A&A, EDP Sciences, 2015, 583, pp.A11. �10.1051/0004-6361/201525961�. �insu-01205741�
A&A 583, A11 (2015) DOI:10.1051/0004-6361/201525961 c ESO 2015
Astronomy
&
Astrophysics
Rosetta mission results pre-perihelion
Special feature
Morphology and dynamics of the jets of comet
67P/Churyumov-Gerasimenko: Early-phase development
?
Z.-Y. Lin (林忠義)
1, W.-H. Ip
1,2,3, I.-L. Lai
2, J.-C. Lee
4, J.-B. Vincent
5, L. M. Lara
6, D. Bodewits
7, H. Sierks
5,
C. Barbieri
8,9, P. L. Lamy
10, R. Rodrigo
11,12, D. Koschny
13, H. Rickman
14, H. U. Keller
15, J. Agarwal
5,
M. F. A’Hearn
7, M. A. Barucci
16, J.-L. Bertaux
17, I. Bertini
9, G. Cremonese
18, V. Da Deppo
19, B. Davidsson
20,
S. Debei
21, M. De Cecco
22, S. Fornasier
16, M. Fulle
23, O. Groussin
10, P. J. Gutiérrez
6, C. Güttler
5, S. F. Hviid
24,
L. Jorda
10, J. Knollenberg
24, G. Kovacs
5, J.-R. Kramm
5, E. Kührt
24, M. Küppers
11, F. La Forgia
8, M. Lazzarin
8,
J. J. López-Moreno
6, S. Lowry
25, F. Marzari
8, H. Michalik
15, S. Mottola
24, G. Naletto
26, N. Oklay
5, M. Pajola
9,
A. Ro˙zek
9, N. Thomas
27, Y. Liao
27, and C. Tubiana
51 Institute of Astronomy, National Central University, Chung-Li 32054, Taiwan
e-mail: zylin@astro.ncu.edu.tw
2 Institute of Space Sciences, National Central University, Chung-Li 32054, Taiwan 3 Space Science Institute, Macau University of Science and Technology, Macau 4 Dept. of Earth Science, National Central University, Chung-Li 32054, Taiwan
5 Max-Planck Institut für Sonnensystemforschung, Justus-von-Liebig-Weg, 3, 37077 Göttingen, Germany 6 Instituto de Astrofísica de Andalucía (CSIC), c/Glorieta de la Astronomía, 18008 Granada, Spain 7 Department for Astronomy, University of Maryland, College Park, MD 20742-2421, USA
8 Department of Physics and Astronomy “G. Galilei”, University of Padova, Vic. Osservatorio 3, 35122 Padova, Italy
9 Centro di Ateneo di Studi ed Attivitá Spaziali “Giuseppe Colombo”, University of Padova, via Venezia 15, 35131 Padova, Italy 10 Aix Marseille Université, CNRS, LAM (Laboratoire d’Astro-physique de Marseille) UMR 7326, 13388, Marseille, France 11 Centro de Astrobiologia (INTA-CSIC), European Space Agency (ESA), European Space Astronomy Centre (ESAC), PO Box 78,
28691 Villanueva de la Cañada, Madrid, Spain
12 International Space Science Institute, Hallerstrasse 6, 3012 Bern, Switzerland
13 Research and Scientific Support Department, European Space Agency, 2201 Noordwijk, The Netherlands 14 PAS Space Reserch Center, Bartycka 18A, 00716 Warszawa, Poland
15 Institut für Geophysik und extraterrestrische Physik (IGEP), Technische Universität Braunschweig, 38106 Braunschweig, Germany 16 LESIA-Observatoire de Paris, CNRS, UPMC Univ Paris 06, Univ. Paris-Diderot, 5 place J. Janssen, 92195 Meudon Principal
Cedex, France
17 LATMOS, CNRS/UVSQ/IPSL, 11 Boulevard d’Alembert, 78280 Guyancourt, France 18 INAF Osservatorio Astronomico di Padova, vic. dell’Osservatorio 5, 35122 Padova, Italy 19 CNR-IFN UOS Padova LUXOR, via Trasea 7, 35131 Padova, Italy
20 Department of Physics and Astronomy, Uppsala University, Box 516, 75120 Uppsala, Sweden 21 Department of Industrial Engineering, University of Padova, via Venezia 1, 35131 Padova, Italy 22 University of Trento, via Sommarive 9, 38123 Trento, Italy
23 INAF–Osservatorio Astronomico di Trieste, via Tiepolo 11, 34143 Trieste, Italy
24 Deutsches Zentrum für Luft- und Raumfahrt (DLR), Institut für Planetenforschung, Rutherfordstrasse 2, 12489 Berlin, Germany 25 Centre for Astrophysics and Planetary Science, School of Physical Sciences, The University of Kent, Canterbury CT2 7NH, UK 26 Department of Information Engineering, University of Padova, via Gradenigo 6/B, 35131 Padova, Italy
27 Physikalisches Institut der Universität Bern, Sidlerstr. 5, 3012 Bern, Switzerland
Received 25 February 2015/ Accepted 8 June 2015
ABSTRACT
Aims.The OSIRIS camera onboard the Rosetta spacecraft obtained close-up views of the dust coma of comet 67P. The jet structures can be used to trace their source regions and to examine the possible effect of gas-surface interaction.
Methods. We analyzed the wide-angle images obtained in the special dust observation sequences between August and September 2014. The jet features detected in different images were compared to study their time variability. The locations of the potential source regions of some of the jets are identified by ray tracing. We used a ring-masking technique to calculate the brightness distribution of dust jets along the projected distance.
Results.The jets detected between August and September 2014 mostly originated in the Hapi region. Morphological changes ap-peared over a timescale of several days in September. The brightness slope of the dust jets is much steeper than the background coma. This might be related to the sublimation or fragmentation of the emitted dust grains. Interaction of the expanding gas flow with the cliff walls on both sides of Hapi could lead to erosion and material down-fall to the nucleus surface.
Key words.comets: individual: 67P/Churyumov-Gerasimenko
? Appendix A is available in electronic form athttp://www.aanda.org
A11, page 1 of10
Open Access article,published by EDP Sciences, under the terms of the Creative Commons Attribution License (http://creativecommons.org/licenses/by/4.0), which permits unrestricted use, distribution, and reproduction in any medium, provided the original work is properly cited.
1. Introduction
In the last perihelion approach of 67P/Churymov-Gerasimenko (hereafter 67P) in 2008–2009, its dust coma activity was moni-tored by ground-based observations (Lara et al. 2011;Tozzi et al. 2011). Several jet features were detected, indicating that the out-gassing process is highly anisotropic, with the locations of the source regions approximated to be at a latitude of 0◦for jet A,
−45◦for jet B, and+60◦for jet C (Lara et al. 2011;Vincent et al.
2013). Soon after the achievement of spatially resolved images of the dust coma of 67P in July 2014 (Sierks et al. 2015), the morphology and temporal variation of a set of dust jets have been under close scrutiny by the Optical, Spectroscopic, and Infrared Remote Imaging System (OSIRIS). This gives us an important opportunity to investigate the gradual development of the out-gassing effect as the comet approaches the Sun. In the follow-ing, we describe the OSIRIS observations in the initial phase of the rendezvous mission between August and September 2014. While we focus on the photometric study of the time-series images of the jet activity over one nucleus rotation of 12.4 h (Tubiana et al. 2015),Lara et al.(2015) examined the active ar-eas that produced these visible jets at the end of July and be-ginning of August 2014. Information on the image sequences is given in the Appendix.
2. Observations
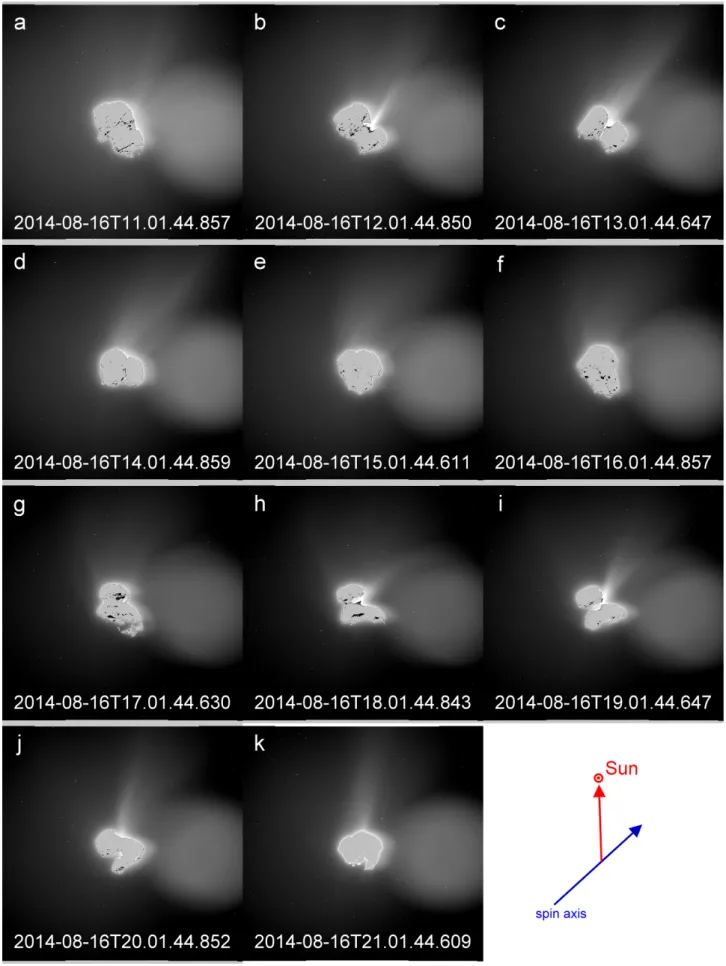
In Fig. 1 we first examine the image sequences obtained on August 16 (V IS filter, center wavelength=6100 Å, FWHM = 94.5 Å), when Rosetta’s cometocentric distance was between 98.7 and 106.1 km. The image contrast level was adjusted to show the dust jet features more clearly. As a consequence, a ghost image appears on the right side of the nucleus because of internal reflections on the camera filters. The time interval is one hour beginning at UT 11:01 August 16, over a ten-hour period until UT 21:01 August 16. Using the SPG shape model devel-oped by the OSIRIS team (Sierks et al. 2015; Preusker et al. 2015), we superimposed the projections of the nucleus at the observation times in the images. A jet in the northern hemi-sphere is clearly visible. We note that the coordinate system for the comet 67P with the north and south poles corresponds to where the spin axis crops out of the nucleus. The small lobe is the zero-longitude end, and the large lobe is the 180-degree-longitude end (Sierks et al. 2015). Its source can be traced back to the Hapi region that connects the two lobes (Thomas et al. 2015). This probably is jet C diagnosed byVincent et al.(2013) from ground-based observations in the previous apparition and the possible source of early jet detections obtained by OSIRIS (Lara et al. 2015). From this series of images, it appears that the jet structure (see images b, c, h, i and g in Fig.1) is usually most prominent and collimated when the Hapi region is in the field of view of the Rosetta spacecraft. The coma structure is more diffuse at other times, but is still non-isotropic with clear hemi-spheric differences. This time variability could be caused either by the diurnal change in the solar insolation condition and hence the surface temperature of the source regions (Capaccioni et al. 2015), or by the observational geometry (Sierks et al. 2015).
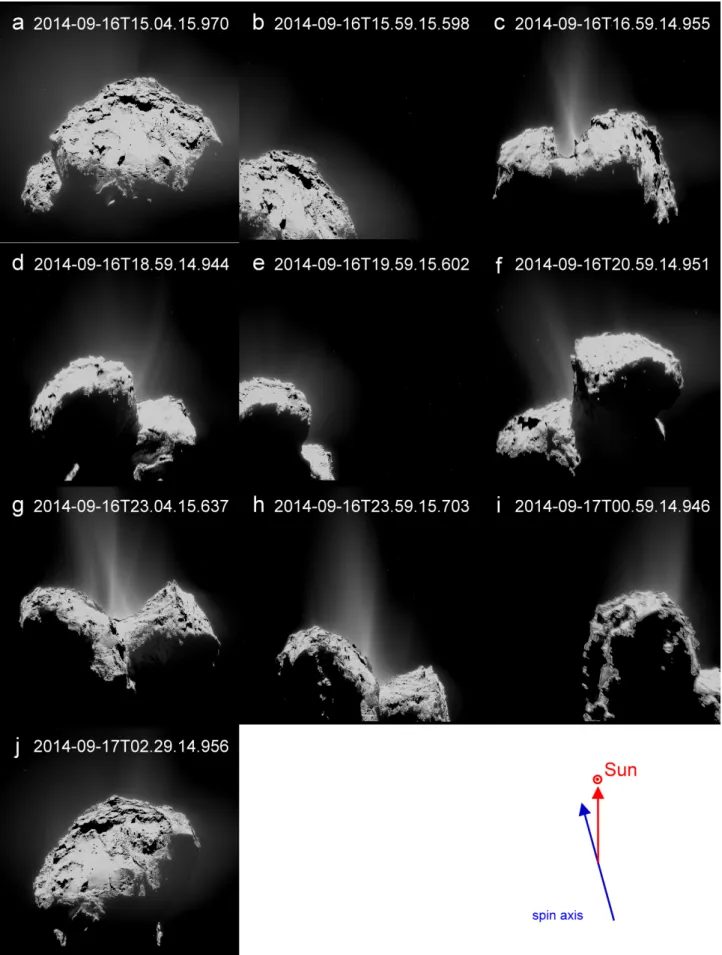
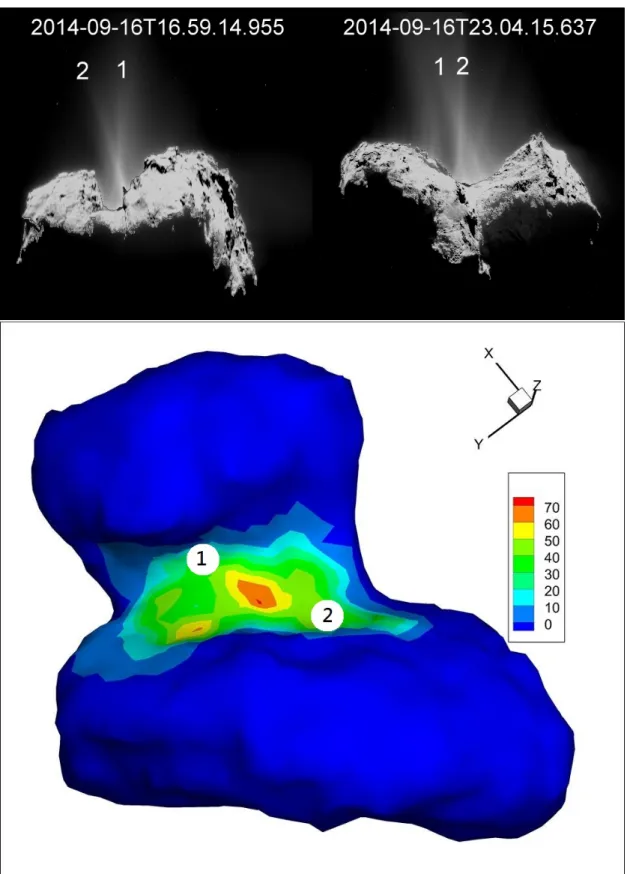
Figure 2 shows the wide-angle camera (WAC) images be-tween UT 15:04 on September 16 and UT 2:20 on September 17. When the Imhotep or the Hatmehit region were facing Rosetta (panels a, b, e, and j), no clear jet system was seen. However, the jet structures appeared when the Hapi region was in view (pan-els c, d, f, g, h). We can identify multiple jetlets in these images. Of particular interest are Figs.2c and g, which are separated by
six hours or about half a rotation. The two jets, which seem to cross in Fig.2c, can now be observed on the opposite side. This appearance might be the result of two collimated jets ejected from spots along the elongated Hapi region with different emis-sion angles. In addition to these two main components, there are several other jetlets in Fig.2g.
The ever-changing morphology of the dust jet system from the neck region can also be appreciated by comparing the images obtained on September 27 when the spacecraft was 24–23 km away from the comet center (see Fig. 3). The first three im-ages (a–c) have the Hapi region in view and the dust jets are clearly visible. When the Hapi region is effectively blocked from the Rosetta spacecraft field of view by the larger lobe (d–f), the brightness of the jets begins to diminish. The process reverses in subsequent images (g–k). This sequence of events indicates once again that the Hapi region probably is the source region of the dust emission. It is also interesting that the pair of narrow jets detected ten days earlier in Fig.2 can no longer be identified. This reinforces the impression that the outgassing process might be of transient nature and is controlled by a certain on-and-off mechanism (i.e., the gas source has become extinguished) as the surface or subsurface temperature distribution evolved; alterna-tively, the reason might be the changing viewing geometry from Rosetta.
The filling factors of the dust grains in the jets can be further computed by comparing their brightness distributions with that of the nucleus itself. As shown in Fig.4, the brightness ratios in the jet region can be obtained by assuming that the albedos of the dust grains and of the nucleus surface are the same. The OSIRIS measurements on September 16 (Fig.4) and the other images obtained from the beginning of August to the end of September 2014 indicate that the filling factor of the jet prob-ably ranges from a few % to 10% in different regions of the jet.
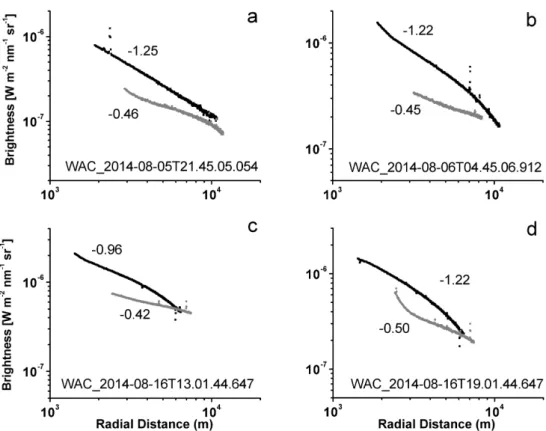
Another important OSIRIS measurement concerns the brightness distribution of the dust jets along the radial distance (e.g., B ∼ ρ−k, B is the jet brightness, ρ is the radial distance from
the comet center, perpendicular to the camera-comet center di-rection, and k is the slope of logB vs. logρ). This can be achieved by first computing the azimuthally averaged background bright-ness distribution of the faint coma surrounding 67P for all im-ages in one OSIRIS dust observation sequence. The brightness of the region with the jet feature earmarked is then subtracted from the coma background. Unfortunately, the ghost issue we mentioned before is always formed at the right side of WAC images when taking the bright comet nucleus. For example, it was just nearby the nucleus and located within the dust coma in August. It is therefore hard to remove this artifact from the dust coma. We therefore discarded this region when estimating the averaging background values. These azimuthally averaged background subtraction measurements were carried out for three dust sequences in August (see Fig.5). To compare the brightness slopes of the jets under a similar viewing geometry, we excluded images in which the Hapi region was blocked from the field of view of the Rosetta spacecraft by the region of the Imhotep or the Hatmehit. We found that the jet brightness slopes (kJ) vary
between 0.95 ± 0.03 and 1.48 ± 0.08, whereas those of the corre-sponding background comas (kc) vary between 0.41 ± 0.04 and
0.59 ± 0.17 (see Fig.6). We assume that the jets originate on the comet surface, and the radius distance to comet center at the Hapi region is about 1 km. We note that the radius distance could be smaller than the actual distance along the collimated jets because the projected effect on the two-dimensional images. The jet brightness distribution is computed by taking a swath of the jet after masking the central region as shown in Fig.5.
Z.-Y. Lin et al.: 67P Churyumov-Gerasimenko
Fig. 1.Dust sequence images obtained with the wide-angle camera from 11:01 UT to 21:01 UT on August 16, 2014. The spatial scales and field of view are 9.74 ∼ 10.49 m/px, and 19.95 ∼ 21.48 km, respectively. Because of the WAC optics, a ghost halo image is formed on the right side of the bright comet nucleus.
Fig. 2.Wide-angle camera image sequence acquired from 15:04 UT on September 16 to 02:29 UT on September 17, 2014. The spatial scales and field of view are 2.67 ∼ 2.69 m, and 5.47 ∼ 5.51 km, respectively. A pair of jets can be identified in Figs.2c and g. Their crossing or twisting appearance might be due to the projection effect of a fan-shaped dust curtain emitted from the Hapi region.
Z.-Y. Lin et al.: 67P Churyumov-Gerasimenko
Fig. 3.Wide-angle image sequence taken from 02:39 UT to 15:39 UT on September 27, 2014. The spatial scales and field of view are 2.20 ∼ 1.99 m, and 4.51 ∼ 4.05 km, respectively. A pair of jets can be identified in Fig.3c.
Fig. 4.Jet filling factor on September 16, 2014. The jet filling factor of the jet ranges from a few % to 10% in different regions of the jet.
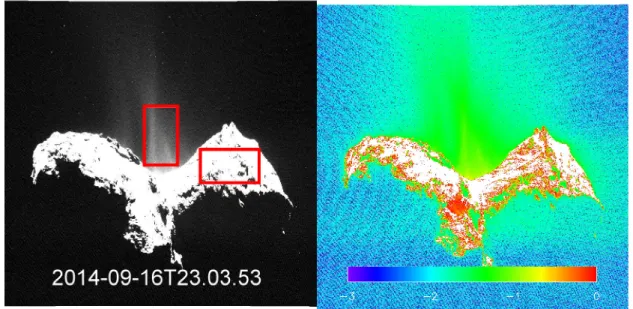
Fig. 5.Schematic view showing the method used to compute the brightness distribution of the dust jet. Left panel (Fig. 1c): the original image. Right panel(computational steps): the comet nucleus is masked from the center to the cut radius. The background brightness distribution that excluded the jet and artificial regions (the ghost formed because of the WAC optics) is calculated in a ring with a certain width. A specific narrow region covering the dust jet is carved out, and the jet value is obtained by background subtraction.
In this way, the excess brightness of the collimated jet can be estimated to be about 3–10% of the whole ring coma brightness, assuming that the background coma is distributed uniformly in the azimuthal direction.
Combining the measurements of the GIADA dust experi-ment and the OSIRIS imaging camera,Rotundi et al.(2015) re-ported the detection of dust grains up to a size of 17 mm with a radial speed of about 3 m s−1 in the coma of comet 67P
dur-ing the same time interval. It is also estimated that the mm-sized grains contributed to most of the coma brightness observed by OSIRIS. The flat brightness slope with kc∼ 0.5−0.6 might
there-fore be characteristic of the bulk of the inner dust coma, which consists of large-sized grains with an organic-rich composition (Capaccioni et al. 2015).
That the brightness slope of the dust jets is steeper than that of the background coma might mean that the dust grains emitted from the neck region are subject to fast sublimation, fragmentation or acceleration. However, dust grains up to a few
tens of micron in size will reach their corresponding terminal speeds within a distance of about 2 km to the nucleus surface, the steep power-law distribution of the jet brightness distribution cannot be the result of grain acceleration. While the brightness profiles of the jets in Figs.6b and c show the change in slope characteristic of dust acceleration close to the nucleus surface, the absence of this signature might be related to the blocking of the source region of the dust jet from the field of view of OSIRIS by the nucleus. Another possibility might be time vari-ability in the gas flow that is modulated by the insolation condi-tion.Protopapa et al. (2014) reported the measurements by the Deep Impact eXtended Investigation (DIXI) mission of the col-umn density profiles of the dust coma and water ice grains in jets within 2–3 km of the nucleus surface of comet 103P/Hartley 2. It was found that the corresponding kcvalue was close to unity,
while that of the jets, kj, was much higher (>4.2). These authors
interpreted this effect as evidence of sublimation of micron-sized water ice grains with a length scale (L) of a few hundred meters
Z.-Y. Lin et al.: 67P Churyumov-Gerasimenko
Fig. 6.Brightness distributions (B) of the collimated jet structures (black line) and the averaged background coma (gray line) along the radial distance (ρ) at four different times: a) 2014-08-05; b) 2014-08-06; c) 2014-08-16; and d) 2014-08-16.
at a heliocentric distance of 1 AU. If we follow a similar ap-proach, the sublimation length scale for the putative volatile grains (not necessarily of water ice composition) in the jets of comet 67P as depicted in Fig. 6a would be L ∼ 11 km for B ∼ ρ−1e−(ρ−ρo)/L, where ρ
o is the distance from the surface to
the comet center and L is the scale-length (Tozzi et al. 2004). If this were true, the jets would represent an important extended source of gas coma in addition to the direct emission from the nucleus surface. This is one important area to examine in more detail by comparing the OSIRIS observations and the ROSINA, MIRO, and VIRTIS measurements of the gas composition.
3. Discussion
One of the main goals in the study of jet morphology and dy-namics is to identify the source regions of the gas and dust emis-sion. Figure7shows the approximate locations of the jet sources obtained by comparing jet features in subset images to seek the location of the possible solutions (source regions) by mapping on the cometary surface. We also attempted to correlate other jet structures in different time-series images of various time in-tervals. Because of the difficulty in finding an exact correlation, only a probability distribution of the possible source locations can be found. We found that the jets most likely tend to emerge from the central part of Hapi. This statistical result could be affected by the observational bias and the numerical technique used to trace the footpoints of the jets. Future work will be re-quired to address this problem.
The anisotropic morphology of the dust jets is very likely as-sociated with the confinement effect of the two sides of the head and body of 67P (Sierks et al. 2015;Thomas et al. 2015). This alone might not completely explain the background coma. This
is because the jets and their substructures seem to be collimated instead of following a divergent pattern. The possibility thus ex-ists that the chemical composition of the dust grains and surface material of Hapi is different from the rest of the nucleus surface, even though no clear indication was given by the VIRTIS ob-servations (Capaccioni et al. 2015). It is interesting to note that the MIRO microwave spectrometer instrument detected signifi-cant water signal only in the vicinity of the neck region, but not over the head or the body (Gulkis et al. 2015). Furthermore, the VIRTIS experiment (Capaccioni et al. 2015) detected water, but little carbon dioxide vapor fluorescence above the active source region in the neck (where the dust jets originated); on the other hand, the carbon dioxide emission was seen preferentially over the Maát region (Filacchione et al. 2015).Vincent et al.(2015) found numerous active pits with short-lived mini-outbursts in the Seth region, which might be driven by CO/CO2sublimation.
These effects considered together might be indicative of differ-ences in the source mechanism, chemical composition, and even size distributions of the emitted dust grains.
The levitation and acceleration of the dust grains is expected to be accompanied by gas expansion from the source regions. The complicated topography of the Hapi region plus changing sunlit and shadowing conditions as the nucleus rotates would imply a strongly varying flow pattern. One global effect persist-ing over time could be the gas-surface interaction of the expand-ing flow at the two sides of Hapi. Friction could lead to detach-ment of small icy grains and dust particles from the eroding wall surface and be either assimilated into the gas flow or fall onto the ground, thus partially replenishing the Hapi surface matter (De Sanctis et al. 2015;Pajola et al. 2015). Of course, we cannot tell whether the concave shape of 67P in the Hapi region is a consequence of such sublimation-driven mass transport effect or if it was originally formed in just that way.
Fig. 7.Locations of the potential source regions of the jets emitted from the neck region. Spots 1 and 2 are the possible locations of the two jets referred to as jets 1 and 2 on September 16, 2014 (top panel). The color bar indicates the most likely distribution probability of the numerous jets identified in different images.
As comet 67P moves toward the Sun, it will become brighter because of the increasing level of outgassing activity. In addition to the Hapi region, there are already some activities detected in the northern hemisphere (i.e., Seth and Maát regions). Although we are not yet seeing the south pole, we expect that the equatorial jet (jet A) and the southern jet (jet B) detected by ground-based
observations (Lara et al. 2011;Tozzi et al. 2011;Vincent et al. 2013) will develop soon. The northern jet system emitted from the Hapi region is expected to turn off before the perihelion in August when the Hapi region falls into shadow.
The brightness slopes of the dust jets presented in Fig.5are within the range of values determined for the coma (∼1.35–1.92)
Z.-Y. Lin et al.: 67P Churyumov-Gerasimenko
within ρ < 100 000 km in February and March, 2009 near per-ihelion (Lara et al. 2011). Hadamcik et al.(2010) found that the inner coma of 67P for ρ between 2000 and 8500 km in December 2008 at a heliocentric distance of 1.35 AU had a brightness slope of 1.5, which might be explained in terms of the presence of large and fluffy particles. The similarity to the brightness slopes discussed here might be deceptive because both ground-based results (Lara et al. 2011; Hadamcik et al. 2010) are for a dust coma much larger than the near-nucleus region and under outgassing conditions very different from the distant coma activity at about 3.5 AU from the Sun (Snodgrass
et al. 2013). The comparative study of the coma activities of
67P observed by Rosetta at different heliocentric distances (from 3.5 AU to 1.2 AU) in the months to come will probably be the next step for the global investigations of the jet morphology and dynamics. Our analysis here shows once again that the close-up observations by Rosetta in coordination with ground-based mea-surements step by step will provide valuable basic answers to the long-standing questions on the generation mechanism and time evolution of cometary dust jets.
4. Summary
The jet features detected in August and September 2014 origi-nated mostly from the Hapi region of 67P.
The ever-changing morphology of the jet features can be seen by the consecutive observations over a timescale from one rotation period to several days. These variations in the jet ap-pearance might be controlled by a certain on-and-off mechanism (i.e., the gas source has become extinguished) as the surface or subsurface temperature distribution evolved; alternatively, the reason might be the changing viewing geometry from Rosetta.
The excess total brightness of the collimated jet is 3∼10% brighter than the background dust coma. The values of the jet brightness slopes are higher than the background coma. This means that the dust grains emitted from the neck region might be subject to fast sublimation, fragmentation, or acceleration.
Acknowledgements. OSIRIS was built by a consortium led by the Max-Planck-Institut für Sonnensystemforschung, Göttingen, Germany, in collabora-tion with CISAS, University of Padova, Italy, the Laboratoire d’Astrophysique de Marseille, France, the Instituto de Astrofísica de Andalucía, CSIC, Granada, Spain, the Scientific Support Office of the European Space Agency, Noordwijk, Netherlands, the Instituto Nacional de Técnica Aeroespacial, Madrid, Spain, the Universidad Politéchnica de Madrid, Spain, the Department of Physics and Astronomy of Uppsala University, Sweden, and the Institut für Datentechnik und Kommunikationsnetze der Technischen Universität Braunschweig, Germany. The support of the national funding agencies of Germany (Deutschen Zentrums für Luft- und Raumfahrt), France (Centre National d’Études Spatiales), Italy (Agenzia Spaziale Italiana), Spain (Ministerio de Educación, Cultura y Deporte), Sweden (Swedish National Space Board; grant No. 74/10:2), and the ESA Technical Directorate is gratefully acknowledged. This work was also sup-ported by grant number NSC 102-2112-M-008-013-MY3 and NSC 101-2111-M-008-016 from the Ministry of Science and Technology of Taiwan. We are indebted to the whole Rosetta mission team, Science Ground Segment, and Rosetta Mission Operation Control for their hard work making this mission possible.
References
Capaccioni, F., A. Coradini, A., Filacchione, G., et al. 2015,Science, 347, 0628
De Sanctis, M., Capaccioni, F., A. Coradini, A., et al. 2015, Science, submitted Filacchione, G., Capaccioni, F., A. Coradini, A., et al. 2015, Science, submitted Gulkis, S., Allen, M., Allmen, P., et al. 2015,Science, 347, 0709
Hadamcik, E., Sen, A. K., Levasseur-Regourd, A. C., Gupta, R., & Lasue, J. 2010,A&A, 517, A86
Lara, L. M., Lin, Z.-Y., Rodrigo, R., & Ip, W.-H. 2011,A&A, 525, A36 Lara, L. M., Lowry, S., Vincent, J.-B., et al. 2015,A&A, 583, A9 Pajola, M., Vincent, J.-B., Güttler, C., et al. 2015,A&A, 583, A37 Preusker, F., Scholten, F., Matz, K.-D., et al. 2015,A&A, 583, A33 Protopapa, S., Sunshine, J. M., Feaga, L. M., et al. 2014,Icarus, 238, 191 Rotundi, A., Sierks, H., Corte, V., et al. 2015,Science, 347, 3905 Sierks, H., Barbieri, C., Lamy, P., et al. 2015,Science, 347, 1044 Snodgrass, C., Tubiana, C., Bramich, D. M., et al. 2013,A&A, 557, A33 Thomas, N., Sierks, H., Barbieri, C., et al. 2015,Science, 347, 0440 Tozzi, G. P., Lara, L. M., Kolokolova, L., et al. 2004,A&A, 424, 325 Tozzi, G. P., Patriarchi, P., Boehnhardt, H., et al. 2011,A&A, 531, A54 Tubiana, C., Snodgrass, C., Bertini, I., et al. 2015,A&A, 573, A62
Vincent, J.-B., Lara, L. M., Tozzi, G. P., Lin, Z.-Y., & Sierks, H. 2013,A&A, 549, A121
Vincent, J.-B., Bodewits, D., Besse, S., et al. 2015,Nature, 523, 63
Page10is available in the electronic edition of the journal athttp://www.aanda.org
Appendix A
Table A.1. Observational log of OSIRIS.
Figure Start time Exptime SC distance∗
rh Pixel scale FOV PA∗∗
image name (UT) (s) (km) (AU) (m) (km) (degree) Figure 1 a 2014-08-16T11.01.54.954 11.175 98.72 3.5409 9.74 19.95 36.8 b 2014-08-16T12.01.54.947 11.175 99.37 3.5407 9.81 20.09 37.3 c 2014-08-16T13.01.54.744 11.175 100.05 3.5404 9.88 20.23 37.8 d 2014-08-16T14.01.54.956 11.175 100.75 3.5401 9.95 20.37 38.3 e 2014-08-16T15.01.54.708 11.175 101.46 3.5399 10.02 20.52 38.8 f 2014-08-16T16.01.54.954 11.175 102.19 3.5396 10.09 20.67 39.3 g 2014-08-16T17.01.54.727 11.175 102.94 3.5394 10.17 20.83 39.9 h 2014-08-16T18.01.54.940 11.175 103.71 3.5392 10.25 20.99 40.4 i 2014-08-16T19.01.54.744 11.175 104.50 3.5390 10.33 21.15 40.9 j 2014-08-16T20.01.54.949 11.175 105.30 3.5387 10.41 21.32 41.4 k 2014-08-16T21.01.54.705 11.175 106.13 3.5385 10.49 21.49 41,9 Figure 2 a 2014-08-16T15.04.26.067 10.200 28.72 3.3554 2.67 5.48 82.9 b 2014-08-16T15.59.25.695 10.200 28.73 3.3552 2.67 5.48 83.4 c 2014-08-16T16.59.25.051 10.200 28.73 3.3549 2.67 5.48 84.0 d 2014-08-16T18.59.25.699 10.200 28.75 3.3542 2.68 5.48 85.1 e 2014-08-16T19.59.25.048 10.200 28.76 3.3539 2.68 5.48 85.7 f 2014-08-16T20.04.25.733 10.200 28.79 3.3534 2.68 5.49 86.3 g 2014-08-16T23.59.25.800 10.200 28.80 3.3531 2.68 5.49 87.4 h 2014-08-17T00.59.25.043 10.200 28.82 3.3529 2.68 5.50 88.0 i 2014-08-17T02.59.25.053 10.200 28.86 3.3525 2.69 5.50 88.5 j 2014-08-17T03.32.25.701 10.200 28.88 3.3522 2.69 5.51 89.4 Figure 3 a 2014-09-27T02.39.34.820 18.45 24.06 3.2908 2.20 4.51 119.3 b 2014-09-27T02.39.34.949 18.45 23.94 3.2906 2.19 4.49 119.4 c 2014-09-27T02.39.34.827 18.45 23.82 3.2903 2.18 4.46 119.6 d 2014-09-27T02.39.34.909 18.45 23.58 3.2898 2.15 4.41 119.9 e 2014-09-27T02.39.34.835 18.45 23.46 3.2895 2.14 4.39 120.0 f 2014-09-27T02.39.34.823 18.45 23.34 3.2893 2.13 4.36 120.1 g 2014-09-27T02.39.34.816 18.45 23.06 3.2886 2.10 4.30 120.3 h 2014-09-27T02.39.34.847 18.45 22.91 3.2883 2.09 4.27 120.3 i 2014-09-27T02.39.34.843 18.45 22.80 3.2881 2.08 4.25 120.3 j 2014-09-27T02.39.34.842 18.45 22.63 3.2877 2.06 4.22 120.2 k 2014-09-27T02.39.34.841 18.45 22.51 3.2875 2.05 4.19 120.2 Notes.(∗)The distance between spacecraft and the center of comet 67P.(∗∗)Phase angle (PA) is Sun-comet-observer (OSIRIS) angle.