Design and Implementation of Cantilever Probe
Holder for Tapping Mode Atomic Force
MAWSSMOE INSTETE
Microscopy
OFTECHNOLOGYby
JUL 2
52017
Jennifer Yu
LIBRARIES
Submitted to the Department of Mechanical Engineering ARCHIVES
in partial fulfillment of the requirements for the degree of Bachelor of Science in Mechanical Engineering
at the
MASSACHUSETTS INSTITUTE OF TECHNOLOGY
June 2017
Massachusetts Institute of Technology 2017. All rights reserved.
Signature redacted
A u th o r ... ... . . . .
-DeA tment o Mecha/cal Engineering May 19, 2017
Certified
Signature redacted
...
Kamal Youcef-Toumi Professor of Mechanical Engineering
Thesis Supervisor
Design and Implementation of Cantilever Probe Holder for Tapping Mode Atomic Force Microscopy
by
Jennifer Yu
Submitted to the Department of Mechanical Engineering on May 19, 2017, in partial fulfillment of the
requirements for the degree of
Bachelor of Science in Mechanical Engineering
Abstract
In this thesis, I present the design and implementation of a novel cantilever probe holder that is capable of tapping mode operation. The probe holder is implemented in a previously designed high-speed, large-range atomic force microscope (AFM). This AFM used a cantilever probe holder that was only capable of contact mode operation, placing limitations on imaging speed and increasing the risk of probe tip damage. Therefore, the focus of this thesis presents the improved design of a cantilever probe holder that actuates and utilizes probe dynamics. This will allow for more flexible and sustainable use of the AFM system. Additionally, two versions of this improved design are developed for operation in air and in liquid. Classical plate theory, finite element analysis (FEA), and non-parametric system identification are used to validate the structure dynamics of the cantilever probe holder.
Thesis Supervisor: Kamal Youcef-Toumi Title: Professor of Mechanical Engineering
Acknowledgments
First and foremost, I would like to express my deep gratitude for my advisor, Professor Kamal Youcef-Toumi. His generosity in providing me the opportunity to pursue my research interests in his Mechatronics Research Laboratory (MRL), as well as his continual support throughout the duration of my thesis work, were instrumental in my deeper learning and experience at MIT.
I want to thank my lab mate, Stephen Truncale, for his help documenting and executing the experimental testing done in lab. Collaborating with Stephen made lab a pleasant and productive work environment.
I cannot thank my research mentor, Fangzhou Xia, enough. His guidance, patience, and overall upbeat personality made my experience in the MRL enlightening and thoroughly enjoyable. Not only was I able to improve upon previous skills, but I also had countless opportunities to expand into other areas and gain a deeper understanding of product design, machining, and atomic force microscopy. Fangzhou always made himself available to any help I needed, both in and out of lab. He was a key part in my academic and personal growth throughout the duration of my thesis work.
Finally, I want to thank my parents for their wisdom, endless support, and inspiration. They are the backbone to all of my personal and professional growth, and for that, I would like to dedicate this work to them.
Contents
1 Introduction
1.1 Background of Atomic Force Microscopy (AFM) . . . . 1.2 Components and Subsystems of an Atomic Force Microscope 1.2.1 Cantilever Probe Deflection Measurement . . . . 1.2.2 Cantilever Probe Assembly . . . .
1.2.3 Sample Scanner . . . . 1.2.4 Scanner Compensation for Counterbalancing . 1.3 Imaging Modes of Operation . . . . 1.3.1 Contact Mode . . . .
1.3.2 Tapping Mode . . . . 1.3.3 Non-contact Mode . . . . 1.3.4 Jumping Mode . . . . 1.4 Motivations and Limitations of Actuated
Cantilever Probe . . . . 1.5 Improved Cantilever Probe Holder Design . . . . 1.6 Thesis Overview . . . . 1.6.1 Design of Cantilever Holder for Tapping Mode
15 15 . . . . 15 17 . . . . 19 . . . . 20 . . . . 22 . . . . 24 . . . . 24 . . . . 24 . . . . 25 . . . . 25 . . . . 26 . . . . 28 . . . . 29 . . . . 29
2.2 Benchmarked AFM Probe Holders . . . . 34
2.3 Actuator Selection . . . . 36 2.3.1 Actuation of Cantilever Holder for Operation in Air . . . . 36
2.3.2 Actuation of Cantilever Holder for Operation in Liquid . . . . 38 2.4 Design of Cantilever Holder for Operation in Air . . . . 39 2.5 Design of Cantilever Holder for Operation in Liquid . . . . 44
3 Dynamic Analysis of Cantilever Holder 49
3.1 Purpose of Analysis . . . . 49
3.2 Natural Frequency Model from Plate Theory . . . . 50 3.3 Finite Element Analysis . . . . 54
4 Measurement of Structure Dynamics 57
4.1 Experimental Setup Hardware . . . . 57
4.2 Method of System Identification and LabVIEW Implementation . . . 59 4.3 Experimental Setup and Data Acquisition . . . . 61
5 Experimental Evaluation of Structure Dynamics 63
5.1 Structure Dynamics of the Cantilever Probe Holder . . . . 64
5.2 Comparison with Theoretical Analysis . . . . 65 5.3 Range of Operation for Assembled Cantilever Holders . . . . 66
6 Conclusions and Recommendations 67
Appendices
Appendix A Finite Element Analysis Parameters for Bottom Layer
List of Figures
1-1 Schematic of the cantilever probe deflection measurement subsystem,
which uses optical beam deflection to measure probe deflections. . . . 17
1-2 Schematic of the cantilever probe assembly subsystem. . . . . 19
1-3 Schematic of sample scanner subsystem. . . . . 20
1-4 Schematic of functional subsystems in the designed AFM . . . . 21
1-5 Implementation of the designed AFM used in this study. . . . . 21
1-6 Block diagram describing the conventional method of counterbalancing. P, is the z-piezo and Pc, is the counterbalancing piezo. . . . . 22
1-7 Block diagram representing the counterbalancing method used by the designed AFM referenced in this thesis. A linear filter, GCB, is applied to AFM controller output and then passed as a separate signal to the counter-z piezo. . . . . 23
2-1 Isometric view of the original cantilever holder, used in contact mode for both air and liquid samples. . . . . 32
2-4 Bruker MTFML-V2 AFM probe holder for liquid operation.The probe holder features (1) an inlet and an outlet for fluid flow and (2) encapsulates the piezo plate, which drives the probe acoustically. . . . . 35 2-5 Schematic of the copper-piezo assembly. In the (a) top view, the
positive electrode area of the piezo plate is glued to the positive copper connection. The negative copper connection is then glued to the open, negative electrode surface of the piezo plate. The (b) side view shows the copper-piezo sandwich is glued to the base of the slot holder, which holds the probe. . . . . 37
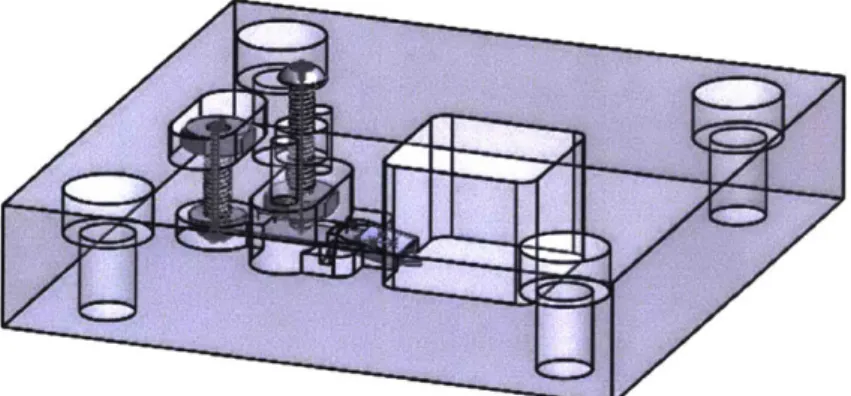
2-6 Implementation of the copper-piezo stackup within the assembled cantilever holder. One copper piece attaches the piezo's positive electrode face to the positive (red) lead wire. The other piece attaches the piezo's negative electrode face to the negative (black) lead wire. . . . . 37 2-7 Isometric schematic of cantilever holder design for operation in air. . 39 2-8 Clamping mechanism consisting of (1) stationary screw and nut (2)
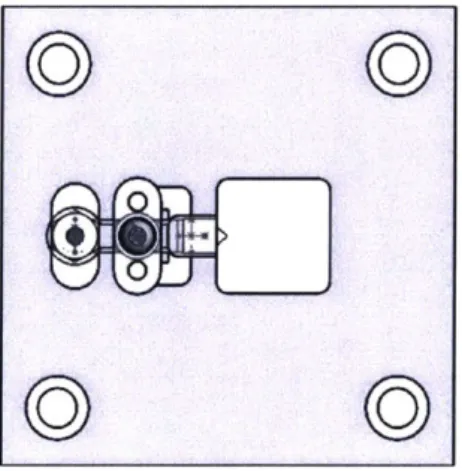
"pusher" screw and nut (3) a copper "clip-clamp" (4) slot holder (5) cantilever probe . . . . 40 2-9 Top view of the cantilever probe holder assembly for operation in air.
There is a completely unobstructed pathway through the center of the holder for the laser beam to reach the surface of the probe tip. . . . . 40 2-10 Schematic of the cantilever holder assembly in its proper orientation
for operation in air. . . . . 41 2-11 Side view of "clip-clamp" mechanism within the cantilever holder assembly.
In its default position depicted above, the probe is secured within the holder. To operate, the user screws in the protruding "pusher" screw to raise the "clip-clamp" (not pictured) and remove the probe. .... 42 2-12 Implementation of the cantilever probe holder assembly. The assembly
2-13 Implementation of the cantilever holder design for air samples. The holder is secured to an aluminum interface plate, which is then secured to the viewing stage of the AFM. The (a) top-view image shows the objective lens directed at the clear, open space at the center of the cantilever holder where the probe protrudes. The (b) side-view image shows the sample stage below the cantilever holder assembly, on which the air sample is placed. . . . . 43 2-14 Schematic of the top layer of the cantilever holder for operation in
liquid. This top layer contains a cavity in which to place the piezo, which will actuate the cantilever probe acoustically. . . . . 44 2-15 Schematic of the bottom layer of the cantilever holder design for liquid
samples. The top surface of the bottom layer depicted in the (a) isometric-view is glued to the top layer of the cantilever holder. The (b) magnified view shows the slanted surface on which the probe rests at a 110 angle. This surface is left exposed during AFM operation so that the probe is submerged in liquid during scanning. . . . . 45 2-16 Schematic of the music wire release mechanism. This piece is weaved
through the assembled top and bottom layers of the cantilever holder, and the bottom-right segment clamps the probe to the slanted surface of the probe holder's bottom layer. . . . . 46 2-17 The (a) side profile shows how the music wire is weaved through both
top and bottom layers of the cantilever holder assembly for operation in liquid. (b) The back profile view depicts the 11' angle at which the probe is exposed to a liquid sample, to be placed below the assembly. 47
2-20 Implementation of complete cantilever holder assembly for AFM operation on liquid sam ples. . . . . 48
3-1 Schematic of the harmonic dynamic linear FEA simulation conducted on the bottom layer of the cantilever holder for operation in liauid. . 54
4-1 (a) Schematic and (b) implementation of the AFM's multi-actuated scanner system . . . . 58 4-2 Example RBS signal generated by LabView with a crest factor of 1. . 60 4-3 Laser interferometer setup to measure structural dynamics.(a) The
device is placed approximately 5mm away from the object of study and (b) its laser beam is focused on the center of the object. The probe holder is placed at a 110 angle relative to the laser interferometer to compensate for the slanted surface on which the probe sits on the holder. 61 4-4 Schematic of the hardware and signaling pathways for control and data
logging. . . . . 62
5-1 Frequency response of cantilever probe with a 100kHz cut-off frequency applied. The Bode plot indicates a resonance frequency of 6260 Hz. . 64
A-1 Schematic of the harmonic dynamic linear FEA simulation conducted on the bottom layer of the cantilever holder for operation in liauid. . 70
List of Tables
3.1 Tomotika's derived frequency values for the first 6 modes of a square
plate clamped on all four sides. . . . . 52 3.2 Table of values used to calculate theoretical resonance frequency of the
bottom layer of the cantilever holder for operation in liquid, based on Tomotika's solution of the classical rectangular plate theory equation. 53 5.1 Resonance frequency values of the bottom layer of the cantilever holder
for operation in liquid, derived from Rectangular Plate Theory, Finite Element Analysis (FEA), and System Identification methods. The parameters of the FEA simulation are detailed in Appendix A. .... 65
Chapter 1
Introduction
1.1
Background of Atomic Force Microscopy (AFM)
Atomic force microscopy (AFM) is a scanning technique that utilizes a mechanical probe and manipulates the interactions between the probe tip and sample surface topography to achieve images of nano-scale resolution. It was developed as a branch of scanning tunneling microscopy (STM), which is capable of scanning samples on an atomic level. Atomic force microscopes have the ability to operate in air, liquid, and vacuum environments. Due to its predominantly mechanical nature, and its versatility of operating environments, AFM has been applied to a wide variety of fields, including solid-state physics and cellular biology [12].
1.2
Components and Subsystems of an Atomic Force
probe deflection measurement, (b) cantilever probe assembly, and (c) sample scanner. The cantilever probe deflection measurement subsystem detects tip-sample interactions and adjusts the sample's displacement relative to the probe tip accordingly. These tip-sample interactions can be the displacement between the tip and the sample, or dynamic parameters of the probe tip itself [12].
The cantilever probe assembly subsystem consists of the cantilever probe and the cantilever probe holder. It secures the probe and optimizes probe-tip interactions.
The sample scanner subsystem consists of an XYZ positioning system and the sample stage. This system presents the sample to be scanned by the probe, and moves the sample according to the specific control system implemented by the AFM.
1.2.1
Cantilever Probe Deflection Measurement
The current AFM implements optical beam deflection to measure probe tip deflections.
A laser beam is reflected off the surface of the probe and collected by two closely-spaced
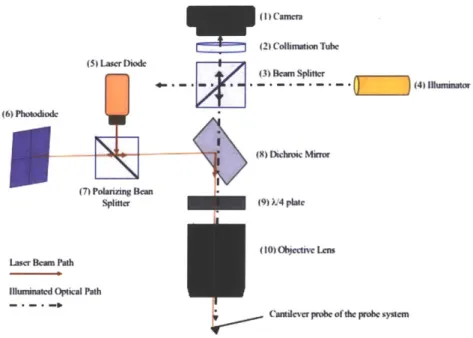
photodiodes. Angular displacement of the probe results in one photodiode collecting more light than the other. This respective distribution of reflected laser beam light produces an output signal that is proportional to probe deflection. The output signal is then amplified and input into a feedback loop to control the height of the sample with respect to the probe position [9].
(1) Camera
(2) Collimation Tube
(5) Lser iode(3) Beam Splitter---
II)Ilumnao
(6) Phoodod ( 8 ) D ic h m ic M i ro r (7) Polarizing Bean Splitter (9) ./4 plate (10) Objectiv Lens Laser Beam Path
liluminated Optical Path
Catileverprobe of therobeayu"m
Figure 1-1: Schematic of the cantilever probe deflection measurement subsystem, which uses optical beam deflection to measure probe deflections.
Its individual components are listed below:
5. BlueSky Research VPSL-0670-005-X-5-B Laser Diode (670nm, 5mW) 6. Photodiode circuitry
7. Edmund 48-999 Polarizing Beam Splitter (wavelength range of 420-680nm) to
guide laser beam toward the dichroic mirror (8)
8. Edmund 69-192 Dichroic Mirror (transmission wavelength range of 500-580nm)
to guide the polarized laser beam to the A/4 plate (9)
9. Edmund 63-935 the A/4 plate to change the polarization direction of the received
laser beam and guide it through the objective lens (10)
10. L Plan 20X SLWD Nikon Objective Lens to focus the received laser beam to a 3.5 m point that is compatible for operation with a small cantilever probe
1.2.2
Cantilever Probe Assembly
The cantilever probe assembly consists of the cantilever probe and a novel cantilever holder. The design of the cantilever holder is the focus of this thesis and is discussed in detail in later sections.
(2) Novel Cantilever Probe Holder
(1) Cantilever Probe
Figure 1-2: Schematic of the cantilever probe assembly subsystem.
Its individual components are listed below:
1. Cantilever probe for scanning the sample
1.2.3 Sample Scanner
The AFM sample scanner subsystem is multi-actuated to produce images that achieve both a large-range scan and a high imaging speed. Independent nano-positioners are pre-loaded with piezos to do so [10].
Sample Piezo stac -Piezo stack (1) Z, Positioner (2) XI Positioner (3) Z, Positioner (4) X2 Positioner (5) Y Positioner
Figure 1-3: Schematic of sample scanner subsystem. The scanner system consists of the following components:
1. Z1 positioner for fast and short-range, out-of-plane scan
2. X1 positioner for fast and short-range, lateral scan
3. Z2 positioner for slow and large-range, out-of-plane scan
4. X2 positioner for slow and large-range, lateral scan
The schematic below shows how these subsystems assemble in an atomic force microscope (AFM).
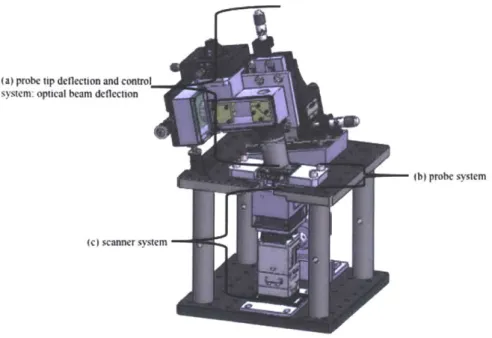
(a) probe tip deflection and control
system: optical beam deflection
(c) scanner system
rXF
b) probe system
Figure 1-4: Schematic of functional subsystems in the designed AFM.
1.2.4
Scanner Compensation for Counterbalancing
The designed AFM used in this thesis will operate in tapping mode, which requires the probe to be actuated at or near its resonance frequency. However, other dynamics within the overall AFM system are also excited during operation, so it is important to suppress these and prevent interference with the probe's dynamics.
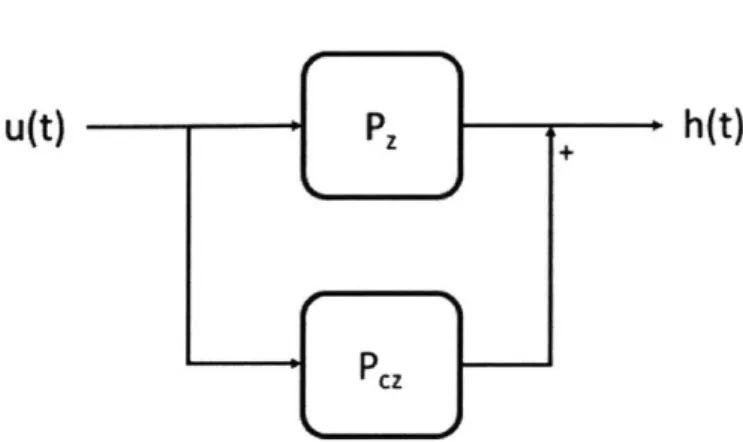
A conventional method of doing so is counterbalancing, or active vibration suppression.
In this approach, an additional piezo, Pc, is placed on the opposite side of the z-piezo,
Pz, sample platform and driven by the same control signal. The momentum of this
counter-balancing piezo cancels out that of the z-piezo, keeping the z-stage of the scanner stationary [16].
U-
PZ
+h(t)
PCZ
Figure 1-6: Block diagram describing the conventional method of counterbalancing.
P, is the z-piezo and Pc_ is the counterbalancing piezo.
This approach improves the dynamic performance of the AFM when it is operating in its fundamental mode (lower frequencies), but it fails to compensate for the higher modes (higher frequencies) that the z-piezo operates. Additionally, it is impractical for the user to continually switch out counter-balancing piezos of different masses whenever a new sample is studied.
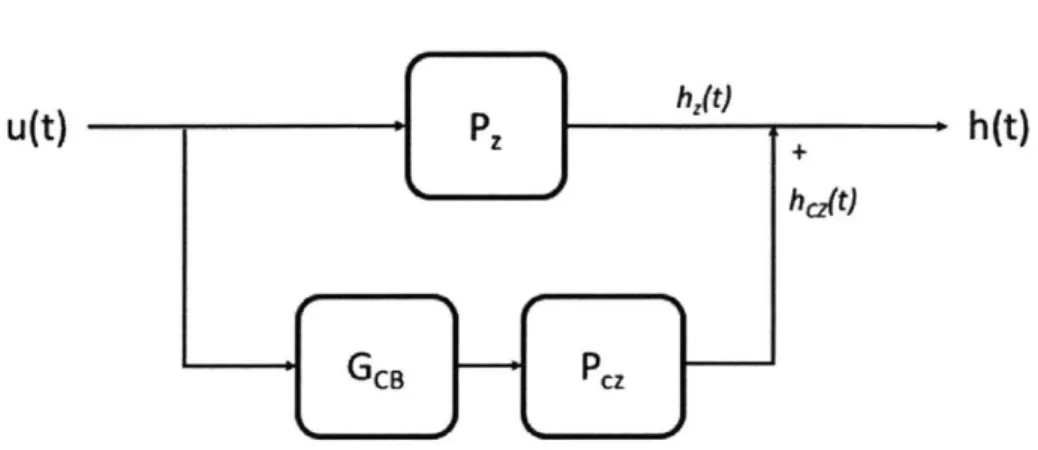
Instead, the AFM system in this study actuates the counter-z piezo with a separate signal that is obtained by applying a linear filter to the AFM controller output
[91.
u(t) P h(t) h(t)
hcz/t)
GCB Pcz
Figure 1-7: Block diagram representing the counterbalancing method used by the designed AFM referenced in this thesis. A linear filter, GCB, is applied to AFM controller output and then passed as a separate signal to the counter-z piezo.
This compensating filter was able to significantly reduce the vibrations of the
z-piezo that were previously observed when using the conventional method of counterbalancing. Corresponding images with this filter applied were completely clear of any shadows,
1.3
Imaging Modes of Operation
AFM imaging is characterized by the operating mode of the cantilever probe tip: contact mode, tapping mode, non-contact mode, and jumping mode.
1.3.1
Contact Mode
Contact mode is a static mode of operation. The probe tip is dragged across the sample surface, and the deflection of the cantilever tip is measured as an output signal [10]. The input signal to actuate the probe tip is then adjusted, such that a constant Z-direction displacement from the sample is maintained. Cantilever probes with relatively low stiffness are typically used in this mode, in order to detect a significant deflection signal without requiring stronger interaction forces and risking damage to the probe itself.
1.3.2 Tapping Mode
Unlike contact mode, tapping mode is a dynamic mode of operation. In tapping mode, the input signal drives a cantilever probe to oscillate at or near its resonance frequency. The frequency and amplitude of this input signal are kept constant, whereas the amplitude of the probe's oscillation changes due to interaction forces between the probe and the sample. These probe oscillation amplitudes are used as the output parameter that is fed into a feedback loop to control the displacement between the probe and sample. The negative feedback loop adjusts the displacement such that the probe's oscillation amplitude is kept constant. Tapping mode bypasses issues with friction force between the probe tip and sample (which occurs most often in ambient conditions) that contact mode often runs into [13]. Therefore, tapping mode is the
1.3.3
Non-contact Mode
Non-contact mode is another dynamic mode of operation. It consists of oscillating the cantilever probe at or slightly above its resonance frequency, and then scanning it above the surface (1-10 nm above) of the sample. This subjects the oscillating probe to Van der Waals forces, which decreases the resonance frequency of the probe [11]. The magnitude of this decrease is measured and input to a feedback control loop, which adjusts the tip-sample displacement in order to maintain a constant oscillation frequency. Contact forces, and their associated damage to the or sample topography, are not of concern in non-contact mode; therefore, non-contact mode is ideal for biological samples.
1.3.4 Jumping Mode
Jumping mode is a combination of static and dynamic operating modes. The tip is first brought into contact with the surface, and feedback control maintains a constant probe deflection. Then, feedback is disabled, and the tip is moved vertically to a height such that there are no significant tip-sample interaction forces [14]. The tip is moved laterally to another part of the sample and brought back into contact, and feedback is re-enabled. This sequence is repeated throughout the entire sample. Similar to contact mode, jumping mode requires a cantilever probe with low stiffness. However, jumping mode is not as susceptible to viscous or adhesive forces as in contact mode, making it ideal for bio-molecular samples.
1.4
Motivations and Limitations of Actuated
Cantilever Probe
Cantilever probe dynamics can be a limiting factor for imaging speed and image quality of atomic force microscopy. The original design of the AFM in this thesis operated in contact mode, which introduced significant lateral friction forces. These forces can damage relatively soft samples and alter their natural surface topography, as well as damage the probe tip itself. Therefore, it is important to operate the cantilever probe in a dynamic mode.
In dynamic modes of operation, the cantilever probe is actuated by a piezo element, which vibrates the probe itself. Scanning of the sample can then be controlled by regulating the amplitude, frequency, or phase of the probe's vibrations. Due to the decreased contact between the tip and sample, dynamic modes are safer for maintaining the integrity of sample surface topography. They allow for the long-term use of a single cantilever probe. Additionally, the same probe can be excited to different eigenmodes, which respond uniquely to different material properties of a sample. Therefore, actuating the cantilever probe and exciting its dynamics makes AFM more versatile in the kinds of samples it can scan. To this point, tapping mode is better than non-contact mode, because non-contact mode does not work well with liquid samples, in which meniscus-related forces interfere with Van der Waals forces. There are, however, imaging speed limitations of tapping mode operation. Tapping mode requires the cantilever probe to be actuated at or near its resonance frequency, making it sensitive to drops in surface topography of a sample. These changes in elevation temporarily increase the amplitude of probe oscillations, but if the AFM scans too quickly, the controller system will not be able to recover and regulate probe oscillations, creating a parachuting effect. This limits scanning speed [13].
Jumping mode of operation is an alternative that offers both benefits of decreased frictional forces and decreased sensitivity to a cantilever probe's stiffness and quality factor. It is also capable of scanning larger samples, since the tip can jump from point
Operating the probe in dynamic modes is crucial for optimizing AFM imaging, and these modes require the actuation of the probe. This thesis presents the design of a cantilever probe holder that incorporates an actuated probe, specifically for operation in tapping mode.
1.5
Improved Cantilever Probe Holder Design
As mentioned previously, the original cantilever probe holder operated in contact mode for both air and liquid samples. The probe was glued permanently to the holder during AFM operation. This assembly allowed for a direct optical view of the sample and the probe, and it enabled the AFM to achieve 6 pm out-of-plane and 120 Mm lateral scans.
While this design enabled the AFM of high-speed and large-range imaging, the quality and speed of the AFM can be further optimized by operating it in dynamic modes. This is important for expanding the AFM's capability to scan other kinds of samples, such as smaller biological samples, as well as observing dynamic processes. Therefore, this thesis presents the improved design of a cantilever probe holder capable of imaging in tapping mode. Two separate versions are developed for air samples and liquid samples.
In both versions of the improved design, clamping mechanisms are incorporated for the easy removal and replacement of probes. Piezo elements actuate the probe directly in the probe holder for operation in air, and acoustically in the probe holder for operation in liquid. Since the piezo element is fully encapsulated within the probe holder for liquid operation, this version is first fabricated in two layers, and then permanently glued together. As such, only the thin, bottom layer of the probe holder is excited by the piezo, instead of the entire holder as in the previous design solution. This decrease in the mass required to be excited by the piezo allows for higher bandwidth of probe dynamics and higher resolution of the final image.
1.6
Thesis Overview
The main focus of this thesis is the design and implementation of an improved AFM cantilever probe holder for operation in tapping mode. Analysis of the probe holder's theoretical structural dynamics is conducted using classical plate theory and finite element analysis (FEA), and the results are compared with experimental results obtained by system identification. These analyses were conducted to validate that the natural dynamics of the probe holder will not interefere with those of the probe during AFM operation. This section will give a brief overview of the rest of the work presented.
1.6.1 Design of Cantilever Holder for Tapping Mode
Features of the original cantilever probe holder design, as well as those of commercial probe holders, are presented as a foundation for the improved design. Important design requirements are identified, and 3-D schematics and images of the implementation of the improved probe holders are depicted. Complete assemblies of the probe holders, including the incorporation of piezo actuators and the clamping mechanisms for securing the probe, are discussed in detail.
1.6.2 Dynamic Analysis of Cantilever Holder
Classical plate theory and finite element analysis are used to analyze the structural dynamics of the cantilever holder, in order to validate that the probe holder's dynamics do not interfere with those of the probe itself. These results are compared with experimental analyses obtained by system identification in later sections.
1.6.3 Measurement of Structure Dynamics
The experimental setup and method of system identification for measuring the probe holder's structure dynamics are explained. Random binary signal (RBS) is used as input for system identification, and a laser interferometer is utilized to measure deflection.
1.6.4 Experimental Evaluation of Structure Dynamics
Theoretical and experimental results are compared, and design implications for the cantilever probe holder are discussed.
Chapter 2
Design of Cantilever Holder for
Tapping Mode
2.1
Design Considerations
The first iteration of the designed AFM was primarily developed to observe dynamic nano-scale processes in real time. This was exhibited by two case studies: calcite etching in sulfuric acid and copper deposition and striping on gold. Since these reactions occur in aqueous environments, the corresponding probe holder was designed with the following considerations: space to hold the liquid, an inlet and an outlet for liquid exchange, and a clear laser focal path through the probe holder.
Figure 2-1: Isometric view of the original cantilever holder, used in contact mode for both air and liquid samples.
P -11C 1 y, a
I - A. 21\
Figure 2-2: Bottom-view schematic of the original cantilever holder for operation in contact mode. The slanted surface in the center holds the probe at a 11' tilt to optimize tip-sample interaction.
Since this AFM operated in contact mode, the cantilever probe was permanently glued in place in the holder. This approach introduced damaging frictional forces, possible interference with the probe's natural vibrations from the glue, and the risk of breaking the small probe and wasting an entire part.
9
Therefore, the following considerations led the cantilever probe holder design presented in this study:
1. Ability to repeatedly remove and replace probes.
2. Minimal obstruction in the laser beam's path to the cantilever probe surface.
3. Slanted placement of the probe to facilitate tip-sample interactions.
2.2
Benchmarked AFM Probe Holders
In addition to the previous cantilever holder design, commercial AFM probe holders were benchmarked. The Bruker CATALYST-ACH represents a standard implementation of a probe holder for operation in air, capable of both contact and tapping modes. The probe is inserted into a slot holder, constraining it in the lateral X-Y directions, and a metal clamp secures the probe in the vertical Z direction [2].
Figure 2-3: Bruker CATALYST-ACH AFM probe holder for air operation.The (1) metal clamp secures the probe in the vertical Z direction, and the (2) slot holder secures the probe in the lateral X-Y directions.
Aside from its prohibitive cost, the CATALYST-ACH is only compatible with a specific, trademarked AFM that is sold by the company. This makes it difficult to incorporate the part into other AFM designs or improve its scanning capabilities.
A probe holder for operation in liquid is also benchmarked: the Bruker MTFML-V2.
The part itself is fabricated from glass. The piece features an inlet and an outlet to accommodate the flow of fluid for liquid samples, and the probe is secured in the center of the holder. The piezo plate is encapsulated within the glass, which drives
operation in their respective sample environments. However, their specific customization and high costs make it difficult to expand upon their scanning capabilities, which is reflective of most commercial probe holders. Therefore, the probe holders presented in this study were designed for both the optimization of high-speed and large-range AFM scanning, and to allow for continual design iterations and flexible compatibility with other components of an AFM.
2.3
Actuator Selection
The cantilever probe is actuated by a piezoelectric element, which is connected to a signal generator (National Instruments FPGA) and amplifier. In order to operate the probe in tapping mode, the piezo actuator needs to be capable of passing a signal with a bandwidth greater than 1 MHz. The smaller the mass that the piezo needs to actuate, the larger the bandwidth it will be able to pass through.
2.3.1
Actuation of Cantilever Holder for Operation in Air
Direct contact between the piezo and probe is ideal, in order to minimize potential interference to the piezo actuation from other materials in the assembly. The cantilever holder for operation in air is designed such that the piezo actuator is stacked directly against the slot holder in which the probe is held. Therefore, a thin piezo element is optimal for conserving geometric space.
For this purpose, a PI Ceramics piezo plate element was used (000015400: plate PIC 255; L:3 x W:3 x TH:0.26mm; Ag electrodes). However, this piezo element did not come with lead wires attached, making it unable to connect to the signal generator. Two copper connection pieces were made to create direct electrical connections between the electrode faces of the piezo and respective lead wires. The piezo plate is sandwiched in between the two copper pieces. This assembly was then glued to the base of the slot in which the probe is held.
W
IM WA*
- ()DWffetD
Side ve
ToPView
(a) Top-view (b) Side-view
Figure 2-5: Schematic of the copper-piezo assembly. In the (a) top view, the positive electrode area of the piezo plate is glued to the positive copper connection. The negative copper connection is then glued to the open, negative electrode surface of the piezo plate. The (b) side view shows the copper-piezo sandwich is glued to the base of the slot holder, which holds the probe.
MW C0M*dWr'
_P1*__
91
2.3.2 Actuation of Cantilever Holder for Operation in Liquid
To scan liquid samples, the cantilever probe is submerged in liquid during AFM operation. Therefore, the piezo element cannot be in direct contact with the probe. Instead, the cantilever holder for operation in liquid is designed such that the piezo is encapsulated within the holder and placed near the probe to drive it acoustically.
This indirect method of piezo actuation introduces additional dynamics to the cantilever holder assembly. For the purpose of obtaining the maximum bandwidth possible, PI Ceramic's PIC 255 piezo was selected (L:3 x W:3 x T: 0.26mm). Its high coupling factor and low mechanical quality factor make it ideal for actuation applications in dynamic conditions, in both air and liquid samples [7].
2.4
Design of Cantilever Holder for Operation in
Air
Since the cantilever holder for operation in air only needs to accommodate samples in ambient conditions, the liquid inlet and outlet paths are removed from this design. The central geometry is simplified to allow for a completely unobstructed path for the laser beam from the photodiode, as well as for the actuating piezo. This central open space is also shaped for placement of electrode lead wires. The piece is fabricated from acrylic.
Figure 2-7: Isometric schematic of cantilever holder design for operation in air.
This cantilever holder incorporates a novel clamping mechanism to allow for the easy placement and removal of probes. The clamping mechanism consists of the following components: (1) stationary screw and nut (2) "pusher" screw and nut (3) a copper "clip-clamp" (4) slot holder (5) cantilever probe. The stationary screw and nut holds one end of the "clip-clamp" in place and adds pressure to the other end, such that it pushes on top of the cantilever probe. The slot holder constrains the cantilever probe in the lateral X-Y directions. Its bottom surface is permanently glued to the slanted surface of the cantilever holder.
Figure 2-8: Clamping mechanism consisting of (1) stationary screw and nut (2) "pusher" screw and nut (3) a copper "clip-clamp" (4) slot holder (5) cantilever probe
Figure 2-9: Top view of the cantilever probe holder assembly for operation in air. There is a completely unobstructed pathway through the center of the holder for the laser beam to reach the surface of the probe tip.
Figure 2-10: Schematic of the cantilever holder assembly in its proper orientation for operation in air.
To operate, the user rotates the "pusher" screw clockwise, such that it rises in the positive Z-direction. Its corresponding nut is glued in place, so only the screw displaces up against the "clip-clamp", raising the "clip-clamp" above the probe and allowing for its removal.
Stationary Bobt
Figure 2-11: Side view of "clip-clamp" mechanism within the cantilever holder assembly. In its default position depicted above, the probe is secured within the holder. To operate, the user screws in the protruding "pusher" screw to raise the
"clip-clamp" (not pictured) and remove the probe.
The cantilever probe holder is assembled and placed on the viewing stage of the atomic force microscope. The objective lens of the probe deflection detection subsystem rests directly above the central, open space of the holder. The sample stage is directly below the probe holder assembly, bringing the sample into contact with the exposed probe on the bottom of the holder.
AM
Figure 2-12: Implementation of the cantilever probe holder assembly. The assembly is inverted in the photo for a clearer view of the how the probe is secured within the holder.
(a) Top-view (b) Side-view
Figure 2-13: Implementation of the cantilever holder design for air samples. The holder is secured to an aluminum interface plate, which is then secured to the viewing stage of the AFM. The (a) top-view image shows the objective lens directed at the
2.5
Design of Cantilever Holder for Operation in
Liquid
The cantilever holder for liquid samples introduces additional design challenges. The holder needs to have a contained environment for the liquid, and a transparent surface needs to be in contact with the liquid at all times to prevent laser scattering from air bubbles. Potential water damage to the probe-actuating piezo element and system circuity is also a concern, since the probe itself is immersed in liquid during the entire scan [9].
These challenges were addressed by fabricating the probe holder in two separate layers and incorporating a different probe release mechanism.
This version of the cantilever holder was designed and fabricated as two layers in order to keep the piezo element fully encapsulated within the holder. The top layer contains a cavity for the piezo:
iezo Cavity
Figure 2-14: Schematic of the top layer of the cantilever holder for operation in liquid. This top layer contains a cavity in which to place the piezo, which will actuate the cantilever probe acoustically.
This top layer is then glued to the bottom layer, shown below:
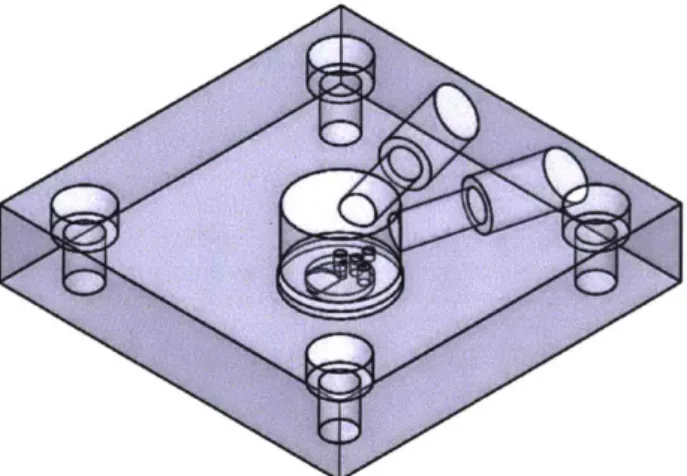
(a) Isometric-view (b) Magnified view
Figure 2-15: Schematic of the bottom layer of the cantilever holder design for liquid samples. The top surface of the bottom layer depicted in the (a) isometric-view is glued to the top layer of the cantilever holder. The (b) magnified view shows the slanted surface on which the probe rests at a 110 angle. This surface is left exposed during AFM operation so that the probe is submerged in liquid during scanning.
Therefore, only the bottom layer of the cantilever holder design is directly driven
by the piezo to excite the probe. In the old cantilever probe holder for operation in
contact mode, the top and bottom layers were designed as a single unit, increasing the mass required to be excited. Here, the decreased mass of the thinner, bottom layer increases the excitation bandwidth achievable by a given input signal to over 1MHz.
17Z1_.Za
E3
E31
E3
Since the piezo cannot be placed directly against the probe in this design for liquid samples, there is not enough space for the "clip-clamp" mechanism that was used in the probe holder design for air samples. Instead, a different release mechanism was fashioned out of music wire and weaved through the liquid cantilever holder. An internal spring presses the bottom segment of the music wire to the probe, securing it in the Z-direction against the slanted surface of the holder's bottom layer. The sides of the slanted surface on which the probe rests keep it constrained in the X-Y lateral directions.
clamps the probe in place
Figure 2-16: Schematic of the music wire release mechanism. This piece is weaved through the assembled top and bottom layers of the cantilever holder, and the bottom-right segment clamps the probe to the slanted surface of the probe holder's bottom layer.
(b) Back profile
Figure 2-17: The (a) side profile shows how the music wire is weaved through both top and bottom layers of the cantilever holder assembly for operation in liquid. (b) The back profile view depicts the 110 angle at which the probe is exposed to a liquid sample, to be placed below the assembly.
(a) Isometric-view (b) Bottom-view
Figure 2-18: (a) Isometric-view schematic of the full assembly of the cantilever holder design for liquid samples, in its proper orientation during AFM operation. The (b) bottom view shows how the music wire secures the probe against the exposed, bottom slanted surface.
.1
Figure 2-19: (a) Implementation of the cantilever holder design for liquid samples.
(b) This assembly is then secured to an aluminum interface plate.
This assembly is then screwed into place on the AFM viewing stage. The objective lens of the optical deflection subsystem is positioned above the cantilever holder assembly such that an unobstructed path between the laser beam and probe surface is established.
Figure 2-20: Implementation of complete cantilever holder assembly for AFM operation on liquid samples.
Chapter 3
Dynamic Analysis of Cantilever
Holder
3.1
Purpose of Analysis
Probe dynamics can be a major limiting factor of AFM image quality. Higher frequency disturbances to the probe can lead to abnormal behavior of the AFM, since probe dynamics are used to control the out-of-plane actuator. This abnormal behavior ultimately results in shadows and ripples in the scanned image and runs the risk of destabilizing the entire AFM system. Therefore, it is important to check that the natural dynamics of the probe holder do not excite the natural dynamics of of the probe. If this becomes an issue, then a thicker piezo element or a denser cantilever holder material will need to be selected. This will ensure that probe operation is driven purely by piezo actuation during AFM scanning [9].
The geometry of the cantilever probe holder design for operation in liquid samples is more complex, since it is fabricated from two layers. Therefore, the dynamic
3.2
Natural Frequency Model from Plate Theory
There are several existing models that relate the natural frequency of a given plate to its other geometric and material parameters. The classical differential equation that models traverse displacement, w, of a plate is described by the following:
DV4w +p =0 (3.1)
where D=flexural rigidity= V) [k'I2] V2
= Laplacian operator, and p=mass density [3] [15]. This model is based on the representation of the deflection function
W(x,y), as the product of two beam functions, X(x) and Y(y):
W(x, y) = X(x)Y(y) (3.2)
From this general model, X(x) and Y(y) are defined to represent combinations of different boundary conditions of the plate, and the differential equation is solved for.
The bottom layer of the probe holder is approximated as a square plate made from solid acrylic, clamped on all four sides. The first, widely accepted solution for a case with these boundary conditions was presented by Sezawa, who assumed zero deflection along all edges of the plate and zero slope only at the midpoints along the edges:
00
W(x, y) Z[Am sin /k2 - a2y + Bm cos vk2 - a2y m=1
+ Cm sinh Ok2 + a2y +
Dm cosh vk2 + a2y] sin ax (3.3)
where m=mode shape, a = " (where a=side length of the square plate), and
Am, Bmi, Cm, and Dm are arbitrary coefficients determining the mode shape, and [15].
Tomotika built upon Sezawa's work to derive the fundamental frequency of a square plate with extreme accuracy, when compared to experimental results. Using the Rayleigh and Weinstein methods of dimensional analysis, he obtained the following frequency bounds:
35.9855 < wa2 Hz - s] < 36.09 (3.4)
where w=frequency[Hz], a=plate length[m], h=plate thickness[h], p=mass density[ ], E=Young's Modulus[Pa], v=Poisson's ratio, and D=flexural rigidity= E_[kg- ]
[15].
Other notable contributions include Bolotin's work using the series method to derive a general formula for frequency for a square plate when modes m=n, where m=modes about the y-axis and n=modes about the x-axis [15]:
S= 2(m+ )2 p(3.5)
Galin took the different approach of applying Galerkin's formula to the classical differential equation and computed fundamental frequencies for plates with arbitrary side length ratios, a:
/7 1 4 1 1 D I D
w=12
I(-a
+7 -2+ 2) (3.6)All of these studies and derivation methods yield relatively similar frequency
estimations for a square plate clamped on all four sides. Tomotika's results were pursued for the structural dynamics analysis in this study, as his experimental results demonstrated extreme accuracy. He derived the frequency values, expressed in terms of wa2 -, for the first 6 modes:
Mode Wa2 -D Frequency, o (Hz) 1 35.9855 636.9 2 73.40 1299 3 108.22 1915 4 N/A N/Al 5 132.18 2340 6 164.99 2920
Table 3.1: Tomotika's derived clamped on all four sides.
Substituting the following values for the cantilever holder yields an expected natural frequency 636.9 Hz in the first mode.
Table 3.2: Table of values used to calculate theoretical resonance frequency of the bottom layer of the cantilever holder for operation in liquid, based on Tomotika's solution of the classical rectangular plate theory equation.
Variable Value Units Plate Length, a 0.04 m Plate Thickness, h 0.0015 M Mass Density, p 1180000 kg/M3 Young's Modulus, E 320000000 Pa Poisson's Ratio, V 0.37 Flexural Ridigity, D 1.04 kg M3 2
3.3
Finite Element Analysis
A Finite Element Analysis (FEA) study was conducted in SolidWorks to further study
the expected structural dynamics of the bottom layer of the cantilever probe holder for operation in liquid.
Given that piezo actuation maintains consistent magnitude throughout the duration of AFM operation, a dynamic simulation is selected. This study is linear, as this is the most appropriate for determining the natural modes of vibration and associated displacements and stresses [4]. Since sine waves are generated as input to the piezo, this study was modeled as harmonic. It is assumed for simplicity that structural dynamics will be the most dominant within the first or second mode, so a harmonic linear study was selected over a modal time history linear study [6].
Material properties are defined by the default values for Acrylic (medium-high impact) in the SolidWorks Material Library. The four screw holes are added as fixtures, and an external load of 1N is applied to a 3mm x 3mm surface to represent the contact area of the piezo against the bottom layer of the holder. This 1N load is sufficient to actuate a ig mass, which is what the bottom layer was approximated to be for simplicity.
Figure 3-1: Schematic of the harmonic dynamic linear FEA simulation conducted on the bottom layer of the cantilever holder for operation in liauid.
A triangular mesh geometry is set to best capture 1st and 2nd order dynamics, and the mesh is automatically calculated by the software. The study uses the Direct Sparse Solver to specifically consider the effect of loading on natural frequencies, yielding the result of a resonance frequency of 2160 Hz in the structure's first mode of operation.
Since the probe itself has a natural frequency in the range 100,000 Hz - 1 MHz, which is one to two orders of magnitude greater than the value derived here, this study validates that the cantilever holder will not interfere with probe dynamics. These simulation results are presented with experimental data in Chapter 5.
Chapter 4
Measurement of Structure
Dynamics
4.1
Experimental Setup Hardware
The scanner that is used to move the sample stage consists of five independently actuated positioners: 2 for out-of-plane Z motion, 2 for lateral (fast raster scan) X motion, and 1 for lateral (frame up/down) Y positioning. The geometry of these positioners define the range and mechanical bandwidth of the AFM in the lateral XY
and out-of-plane Z directions
19].
Both Zi and Z2 positioners implement piezo stacks to achieve motion. The Zi positioner is driven by a 5mm x 5mm x 9mm piezo stack (Physik Instrument,
P-885.11) for large-range (6 m) motion, whereas the Z2 positioner is driven by a 10mm
x 10mm 12mm shear piezo stack (Physik Instrument, P-141.10) for short-range (10 m) motion. The Z2 and Z1 out-of-plane direction positioners are paired with lateral X2 and X1 positioners, respectively, to minimize the effect of dynamic coupling
FPGA modules are hosted by an NI PXIe-8135 chasis with 2.3 GHz core Windows
controller. This controller can be used to capture lateral positioner data of the scanner system, cantilever deflection measurement, and sample topography information that is used to control the operation of the sample scanner and form real-time AFM images [9]. Premslak- ZP s..ii. X, PdMMi Piezo ack-X2 PfiiWaOna ~ Y ' ..nn (a)
Figure 4-1: (a) Schematic and (b) implementation of the scanner system.
(b)
AFM's multi-actuated
This setup is utilized to study the cantilever probe holder dynamics.
4.2
Method of System Identification and LabVIEW
Implementation
System identification (ID) is used to measure the structure dynamics of the two designed cantilever holders. This open-loop method measures the input and outputs of a dynamic system, builds a mathematical model to describe its behavior, and then evaluates the model's quality (by comparing model response with measured response, measuring uncertainty, or analyzing residuals). The following requirements must be met for system ID to develop a good model for a system [8]:
1. The input signal excites the system adequately.
2. The data acquisition system has a good signal to noise ratio.
3. Data is measured at an appropriate sampling rate.
4. An appropriate model structure is selected.
In this study, LabView software is used to generate a random binary stochastic (RBS) signal as the input to excite the piezo actuators. Data is collected at a sampling rate of 500,000 samples per second, and the system is assumed to be linear, as linear models are often sufficient to describe system dynamics.
A RBS signal is a random process that takes one of two values at any given time.
Binary signals are useful for identifying linear systems, and a RBS signal's random nature makes for excellent noise cancellation during data acquisition. The LabView System ID Toolkit creates one by filtering a Gaussian white noise signal for the desired spectra and then taking the sign of the filtered signal to obtain a binary signal. The
Crest factor is an indicator of signal to noise ratio. It is a measure of how much input power from the input signal is actually delivered to the system [1]. Crest factor is defined as follows:
02 = max u2(t) (4.1)
r Y: U2 (t)
where u(t)=input stimulus signal and N=number of oscillations within a given period. Therefore, C2 > 1. The smaller the crest factor, the more power that is
directed into the system, resulting in a better signal to noise ratio [3].
The LabView software utilized in this study generates an RBS signal with a crest factor of 1 according to the method described above [3]:
2-
1.5-
I0.5- 0- -0.5--1~s -1.5--2- , I 0 10 20 30 40 50 60 70 80 90 100Figure 4-2: Example RBS signal generated by LabView with a crest factor of 1.
4.3
Experimental Setup and Data Acquisition
System ID is used to study the structure dynamics of the cantilever probe holder. Since there are power limitations during operation, a first order low-pass filter is first applied to a Guassian white noise signal generated by LabView on the laptop. This cuts off the signal above a given frequency, concentrating the signal power on the expected natural frequency range of the structure. The LabView software, running on a National Instrument (NI) PXI driver, then applies the threshold to generate the random binary signal, which is amplified before exciting the piezo actuators.
A laser interferometer is placed at an approximate distance of 5mm from the
object of study and focused such that the beam hits the center of the object [17].
(a) Device placement (b) Laser beam focus
Figure 4-3: Laser interferometer setup to measure structural dynamics. (a) The device is placed approximately 5mm away from the object of study and (b) its laser beam is focused on the center of the object. The probe holder is placed at a 110 angle relative to the laser interferometer to compensate for the slanted surface on which the probe sits on the holder.
The laser interferometer measures the corresponding displacements of the probe holder, and MATLAB is implemented to analyze the data collected by the NI USB-6521
DAQ and create Bode plots of the corresponding frequency response.
(2) NI Die (1) Lap p (3)Ampvifierj (4) Cantilever Probe Hokkder (5) Lawe
Figure 4-4: Schematic of the hardware and signaling pathways for control and data logging.
Chapter 5
Experimental Evaluation of
Structure Dynamics
System identification with a random binary signal (RBS) input is used to analyze the structure dynamics of the bottom layer of the cantilever probe holder for operation in liquid. The same experimental setup for this analysis is used to conduct a frequency sweep test on assembled probe holders to determine the maximum amplitude achievable by the probe during AFM operation.
5.1
Structure Dynamics of the Cantilever Probe
Holder
System identification is performed with a sampling rate of 500,000 samples per second, and a cut-off frequency of 100 kHz was applied to input Gaussian white noise signals. Since power transmitted into the actual experimental system is a limiting factor, this cut-off frequency focuses the input signal power to the frquency range of interest. The frequency response plots are shown below.
C C: 50 0 -50 -1 An 100 0 S 0 -200 -400
Empirical Transfer Function Estimate 100 Hz Cut-off Frequency
102 10 4
100 102 104
Frequency (Hz)
Figure 5-1: Frequency response of cantilever probe with a 100kHz cut-off frequency applied. The Bode plot indicates a resonance frequency of 6260 Hz.
5.2
Comparison with Theoretical Analysis
The following table summarizes the resonance frequency values of the cantilever probe holder, derived from the various analyses in this study.
Analysis Method Resonance Frequency (Hz) Plate Bending Theory 636.9
Finite Element Analysis (FEA) 2160
System ID 6260
Table 5.1: Resonance frequency values of the bottom layer of the cantilever holder for operation in liquid, derived from Rectangular Plate Theory, Finite Element Analysis
(FEA), and System Identification methods. The parameters of the FEA simulation
are detailed in Appendix A.
The frequency values obtained with FEA and System ID were of the same order of magnitude, whereas the value obtained with Plate Bending Theory was one order of magnitude less. This can be attributed to the central geometry of the probe holder bottom layer. In the theoretical analysis, the bottom layer was modeled to be a solid plate of acrylic for simplicity, whereas in reality, the geometry is much more complex to accommodate for the placement of the probe and the liquid sample. The actual piece has less mass than was modeled, resulting in an underestimation of resonance frequency by the theoretical calculations.
5.3
Range of Operation for Assembled Cantilever
Holders
A frequency sweep test was conducted on assembled probe holders (i.e. the cantilever
probe holders with probes clamped to them) to observe the probe's specific dynamics under conditions similar to actual AFM operation. The frequency range at which probe oscillations occur, and the amplitude of those oscillations, are parameters by which image quality are defined.
The cantilever probe holder assembly for operation in air exhibits sub-optimal dynamic range of the probe. When the full range of the amplifier is applied, the probe vibrates with an amplitude of 10 nm. Dynamics appear at 12-15 kHz but taper off at 40 kHz. This is below the lOOkHz-1MHz range needed for high-speed imaging. The cantilever probe holder assembly for operation in liquid exhibited good dynamic range. When one-fifth of the amplifier power is applied, the probe vibrates with an amplitude of 20nm. Observed dynamics are sustained up to 100kHz. These results were obtained with a laser interferometer to estimate performance during AFM operation; it is expected that an even higher frequency range is exhibited during actual AFM operation.
Chapter 6
Conclusions and Recommendations
Two cantilever probe holder designs are presented for scanning samples in air and in liquid. These designs enable the particular AFM in this study to operate in tapping mode, increasing imaging speed and image resolution.
The probe holder for operation in air exhibited suboptimal probe dynamics. This is due to the fact that copper sheets were glued to the piezo as makeshift electrode lead wires, since the piezo did not come with lead wires pre-attached. The copper sheets introduces strange structure dynamics and decreases the displacement the piezo is capable of actuating.
For actual AFM operation, it is recommended to use PI's PL033.31 piezo, which offers 300kHz resonance frequency when constrained on a single end. With its 2.2 micron range displacement, we can input a signal to the. piezo with a sufficient command amplitude to achieve large enough probe oscillation amplitudes for high-speed imaging.
The probe holder for operation in liquid exhibited good probe dynamics. These results were obtained by a frequency sweep test, during which a constant 20 nm
Appendix A
Finite Element Analysis
Parameters for Bottom Layer
Cantilever Holder for Liquid
Operation
A Finite Element Analysis (FEA) was conducted in this thesis to simulate the expected
natural frequency of the bottom layer of the cantilever holder for liquid operation. The simulation focused on the bottom layer of the cantilever holder because the piezo only directly actuates this part of the assembly. The parameters of the study are presented in this appendix.