HAL Id: hal-01788909
https://hal-amu.archives-ouvertes.fr/hal-01788909
Submitted on 9 May 2018HAL is a multi-disciplinary open access archive for the deposit and dissemination of sci-entific research documents, whether they are pub-lished or not. The documents may come from teaching and research institutions in France or abroad, or from public or private research centers.
L’archive ouverte pluridisciplinaire HAL, est destinée au dépôt et à la diffusion de documents scientifiques de niveau recherche, publiés ou non, émanant des établissements d’enseignement et de recherche français ou étrangers, des laboratoires publics ou privés.
Transformation of a Double Focusing B-E Mass
Spectrometer for Multiple-Cell Knudsen Effusion Part I:
Scientific Concepts
Benigni P., Alexandre Berche, Georges Mikaelian, Jacques Rogez
To cite this version:
Benigni P., Alexandre Berche, Georges Mikaelian, Jacques Rogez. Transformation of a Double Fo-cusing B-E Mass Spectrometer for Multiple-Cell Knudsen Effusion Part I: Scientific Concepts. ECS Transactions, Electrochemical Society, Inc., 2013, 46 (1), pp.127 - 141. �10.1149/04601.0127ecst�. �hal-01788909�
Transformation of a Double Focusing B-E Mass Spectrometer for Multiple-Cell Knudsen Effusion – Part I: Scientific Concepts
P. Benignia, A. Berchea, G. Mikaelianb, J. Rogeza
a
CNRS, IM2NP (UMR 7334)
b
Aix-Marseille Université, IM2NP
Faculté des Sciences et Techniques, Campus de Saint-Jérôme, Avenue Escadrille Normandie Niémen - Case 251, F-13397 Marseille Cedex, France
Knudsen Effusion Mass Spectrometry (KEMS) is a powerful method in the field of experimental thermodynamics at high temperatures. Since 2005, the long term project of transforming and upgrading a double-focusing VG Micromass 54-38K mass spectrometer for multiple-cell effusion has started at the IM2NP in Marseille/France. The scientific concepts underlying the transformation are presented in this first paper. The molecular beam effusing from the Knudsen cells must be sampled under restricted collimation conditions. The resulting geometric constraints are taken into account in the design of the large main vacuum chamber necessary to house a multiple-cell effusion furnace. Decrease of the molecular transmission between the cell and the ionization source needs to be counterbalanced by an increase in the sensitivity of the ionization source. Other modifications of the instrument are reviewed. The first tests and results will be the subject of a second paper to be published.
Overview of the project
The mass spectrometer, given to us by J. Drowart after he retired from the Université Libre de Bruxelles, is a double focusing 54-38K model manufactured by VG micromass. The analyzer has a B-E geometry in which a magnetic sector, with a radius of 27 cm and
95°, precedes an electrostatic sector of 38.1 cm (15”) radius, 81.5°. The ionizer is an
electron impact source. The spectrometer is not equipped with any effusion device. The project is to adapt this spectrometer for activity measurements up to 2500 K by the multiple-cell technique according to the concepts developed by C. Chatillon and his coworkers (1, 2, 3) at the CNRS-SIMAP laboratory in Grenoble, France.
Concretely, it implies that the molecular beams effusing from the Knudsen cells must be sampled under restricted collimation conditions. The resulting geometric constraints are taken into account in the design of the large main vacuum chamber necessary to house a four-cell effusion furnace. Moreover, decrease in the molecular transmission between the cell and the ionization source needs to be counterbalanced by an increase in the sensitivity of the ionization source.
Interest of a high resolution instrument
Quadrupole and single focusing magnetic sector are the mass analyzers which are the most frequently used in Knudsen Effusion Mass Spectrometry (KEMS) (4, 5). Double focusing instruments, allowing high resolution, have been seldom used (6, 7).
For a given peak at mass M having a peak width M, the resolution R is defined according to equation 1 (8): M M R [1]
There are different ways of defining M (8) and it is interesting to look at these alternatives before comparing the ability of different instruments to separate masses.
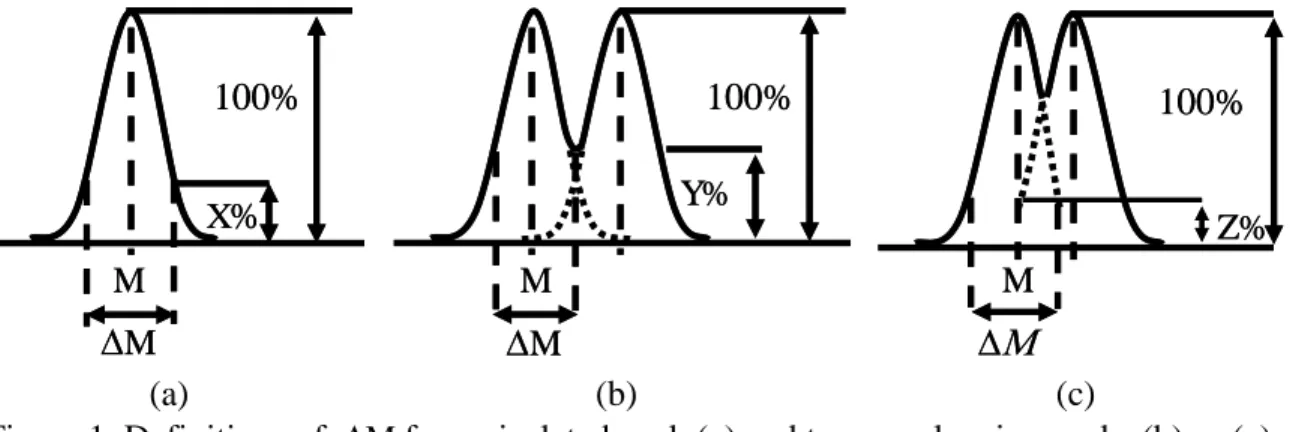
For an isolated peak, M is the peak width at a certain percentage X, frequently 5, 10 or 50%, of the height of the peak (figure 1a).
For two adjacent overlapping peaks, the peak width cannot be defined unambiguously below the level of the valley hence M is generally defined in relation to the valley level
Y%, frequently at 2 or 10% (figure 1b). In the cross talk definition (figure 1c), M is based on the intensity Z% with which one peak contributes to the intensity of the other at its highest value.
If we assume a linear intensity scale on the vertical axis, the qualitative figure 1c is quite misleading because the summation of the two dotted lines will not give a marked valley between the two peaks.
M X% 100% M M X% 100% M M M Y% 100% M M Y% 100% M Z% 100% M Z% 100% (a) (b) (c)
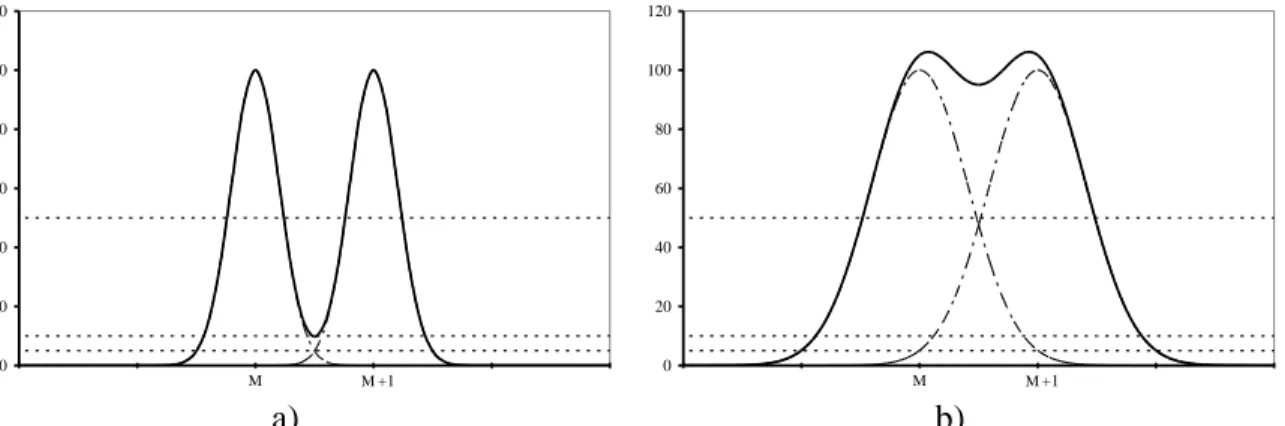
Figure 1. Definitions of M for an isolated peak (a) and two overlapping peaks (b) or (c) For Gaussian peaks of equal height unit resolutions are compared for a 10% valley definition and a 5% cross-talk definition in the quantitative figures 2a and 2b. In figure2a, the summation of the peaks intersecting at 5% forms a 10% valley. The peaks are clearly not separated in figure 2b so it is pointed out that when comparing numerical values for assessing the ability of a given spectrometer to perform quantitative analysis the %valley definition is recommended.
0 20 40 60 80 100 120 26 27 M28 M29+1 30 31 0 20 40 60 80 100 120 26 27 M28 M29+1 30 31 a) b)
Figure 2. Unit resolution for overlapping Gaussian peaks of equal height, arbitrary unit on the vertical axis a) 10% valley b) 5% cross-talk.
Another case of overlapping peaks, is the one in which a main peak contributes to the height of a side peak (figure 3). If the main peak is from a residual background species and the side peak is from an effusing species, the actual intensity of the peak of the effusing species can be obtained by the difference between measurements performed with and without shuttering the molecular beam. If both peaks are from effusing species a shutter has no effect and the shape of the peaks has to be known for quantitative analysis.
0 20 40 60 80 100 120 140 160 180 200 26 27 M28 M29+1 30 31 Actual Apparent
Figure 3. Overlapping peaks of unequal heights, arbitrary unit on the vertical axis - The apparent intensity (solid line) at mass M results from the summation of a main peak
(dashed line) and a side peak (dotted line).
Real performance of commercial instruments is difficult to assess on the sole basis of manufacturer figures. Moreover while quadrupole manufacturers use peak width definitions at various heights 5%, 10% or 50%, magnetic sectors manufacturers generally refer to the 10% valley definition. Typically, the order of magnitude of the 10% valley resolution is around several hundreds for quadrupoles, up to 3000 for single focusing magnetic sectors, and greater than several thousands for double focusing instruments up to 100000.
The mass of the gaseous species in high temperature inorganic chemistry is generally lower than 500 amu. The resolution of quadrupoles is suitable for quantitative analysis of masses lower than 50 amu. In the range 100-500 amu, qualitative identification of species remains possible but adjacent peaks will not be fully separated and the most intense peaks will significantly contribute to the intensity of neighboring peaks (9).
As mentioned by Roboz (8) “resolution requirements fall broadly into two classes”. To differentiate between adjacent peaks differing by 1 amu, a low or medium resolution is required. For example, mechanical pump oil, DC 705 diffusion pump oil and turbo-molecular pump oil all give an important hydro-carbon peak at mass 43. Acetone and ethanol frequently used in preparing vacuum parts have their main peak at masses 43 and 45 respectively. This is the reason why residual gas analyzers have a resolution in the range 50-80, sufficient to distinguish 12C16O2+ at mass 44 from the residual hydro-carbon
peaks at mass 43 and 45 (8). Xenon and mercury, commonly used as calibration gases in mass spectrometry, have numerous isotopes of comparable relative abundances (128Xe,
129
Xe, 130Xe, 131Xe, 132Xe, 134Xe, 136Xe and 198Hg, 199Hg, 200Hg, 201Hg, 202Hg, 204Hg) requiring resolutions of 130 and 200 respectively.
Considerably higher resolution is required for doublet resolution, for example within the framework of studies involving light elements like Si, C, O, gaseous species like Si+, SiO+, CO+ will have to be separated from each other and also from background species such as N2+. A resolution of 1550 is required to separate 12C16O+ from 28Si+ and of 2500
to separate 12C16O+ from 14N2+. In this complex case, a double focusing instrument will
always provide a sufficiently high resolution for full separation of all the masses, allowing accurate quantitative analysis.
Single vs. multiple-cell effusion
With a single effusion cell, the partial pressure pi of the gaseous species i in the cell is
linked to the ionic intensity I+i according to equation 2 (10), where Si is the sensitivity
factor of the spectrometer to the species i, and T the temperature of the cell.
T I S
pi i i [2]
As Si is not a priori known, successive runs are necessary for the experiment(s) then
for calibrating the sensitivity factor towards a reference sample. However, Si may vary
between successive runs because of default of reproducibility a) in the mechanical positioning of the cell, impacting the efficiency of molecular beam sampling, and b) in the stability of the ionization parameters of the ion source.
Several methods have been employed to overcome these drawbacks (11) like the estimation of Si using a known internal equilibrium when possible (e.g. monomer/dimer
method), manipulation of the Gibbs-Duhem relation to cancel the calibration constant, or addition of an isolation valve to keep the source running when a sample is changed.
An alternative method is the multiple-cell effusion technique following the example of Chatillon and its coworkers with a 4-cell device (1, 2, 3).
The advantages are that, as a permanent standard is always available in one cell, and because the effusion device is carefully designed to obtain the same Si and T for all cells,
then in a single run the activity ai is directly obtained from the ratio of ionic intensities I +
i
above an alloy and I°+i above the reference sample (equation 3) with no need to measure
Si. i i i i i I I p p a [3]
For absolute pressure determination, Si is obtained from the measurements of T and
I°+i and the prior knowledge of p°i.
In chemical systems where evaporation coefficients are low, various dimensions and shape of the effusion orifice can be simultaneous used to estimate the equilibrium pressure. Also several chemical compositions can be studied in a single run, reducing the overall duration of the experiments.
The price to pay for these increased abilities is that part of the spectrometer has to be rebuilt because, in general, vacuum chambers are not large enough to house a multiple-cell effusion furnace. It is worth noting that isothermicity of the multiple-multiple-cell holder is harder to achieve and can be an issue at temperatures lower than 1100°C. Practically, the diameter of the furnace chamber has to be increased to a minimum value of 160 mm with a corresponding increase in the pumping capacities because of the higher steady flow of molecules effusing from the 4-cell device. Moreover, a special furnace positioning mechanism is required for switching the cells. As no instrument of this type is available on a commercial basis, the system has to be homemade in the laboratory.
Conventional beam sampling vs. restricted collimation
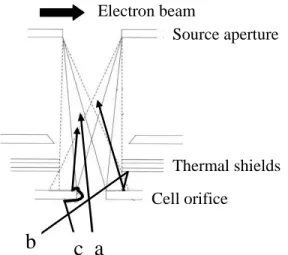
In conventional molecular beam sampling, there is a high transmission of molecules between the effusion cell and the ion source but the molecular flow entering the source is the sum of three contributions (figure 4). In addition to the direct flow from the cell (a), which is the only contribution of interest, two parasitic flows also enter the source: the flow of molecules re-vaporizing from the shields (b) and the flow of molecules vaporizing after creeping and surface diffusion along the wall of the effusion orifice (c).
Source aperture Thermal shields
a
b
c
Cell orifice Electron beam Source aperture Thermal shieldsa
b
c
Cell orifice Source aperture Thermal shieldsa
b
c
Cell orifice Electron beamIn this configuration, the ionic intensity of a given species entering the source continuously evolves as a function of a position coordinate and even a slight shift e.g. 50 µm of the cell modifies the ionic intensity (1). Due to the asymmetric nature of a single filament source, it is sometimes observed that the maximum intensity is off-centered and corresponds to the situation where the molecular beam gets closer to the electron entry slit in the source box (1).
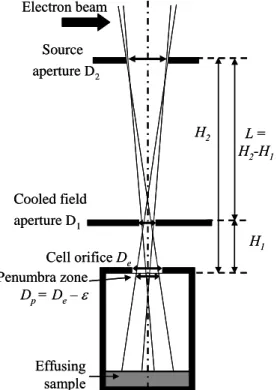
Under restricted collimation (2) (figure 5), a fixed field aperture of diameter D1 is
added between the source and the effusion cell which, together with the source aperture of diameter D2, fully defines the molecular beam. D1 and D2 values are chosen to restrict
the width of the molecular beam to molecules coming from the inner volume of the cell.
L = H2-H1 Effusing sample Electron beam H1 Cell orifice De H2 Cooled field aperture D1 Source aperture D2 Penumbra zone Dp= De– L = H2-H1 Effusing sample Electron beam H1 Cell orifice De H2 Cooled field aperture D1 Source aperture D2 Penumbra zone Dp= De–
Figure 5. Restricted collimation – definition of the geometric parameters. By this way parasitic flows are suppressed and, around the collimation axis, the width of the molecular beam becomes independent of the cell position and the ionic intensity is not modified by a slight shift or tilt of the cell when sighting inside the effusion orifice.
The study of CsOH vaporization by Roki et al. (12) gives a clear demonstration of the interest of restricted collimation. During the single cell effusion experiments between 570 and 770 K a flow out of the sample is observed around the effusion orifice. The total mass loss, which is used to calibrate the spectrometer, is the sum of the genuine effusion process from the inner volume of the cell and of a parasitic contribution from molecules vaporizing after radial diffusion around the effusion orifice. Using restricted collimation in conjunction with a high accuracy positioning system, these flows are separately measured. The authors have been able to show that the parasitic contribution, which represents 53% of the genuine effusion process at 563K, decreases to 25% at 676K because the vaporization process becomes predominant compared to surface diffusion as the temperature rises.
However, when restricted collimation is used, the proportion of effusing molecules reaching the source is diminished and an optimization of the geometric parameters, the diameters of the orifices and the distances between them, is required to maximize molecular transmission between the cell and the ion source.
Transmission maximization under restricted collimation
As shown by Morland et al. (2), the value of the field aperture for maximum transmission is a function of the other geometric parameters according to equation 4:
2 1 2 2 1 2 1 ) ( H H D H H H D D p [4]
Practically, the source aperture diameter D2 is allowed to vary between 2.5 and
4.5 mm. The cell orifice has a diameter De in the range 0.5 to 3 mm and the external
diameter of the penumbra zone Dp is defined from De taking into account a convenient
mechanical clearance of 0.1 mm larger than the positioning accuracy of the effusion cells. H1, the distance between the effusion and field apertures, has to be minimized for
maximum transmission. Concretely, H1 is greater than 14 mm because thermal shields
have to be inserted between the cell and the water jacket supporting the field aperture. The last distance L = H2 – H1, where H2 is the distance between the effusion orifice and
the source aperture, is fixed in an existing experimental device, must be optimized in the design of a new one.
Transmission calculations are required and the formula for molecular transmission between 2 coaxial disks is given in the appendix.
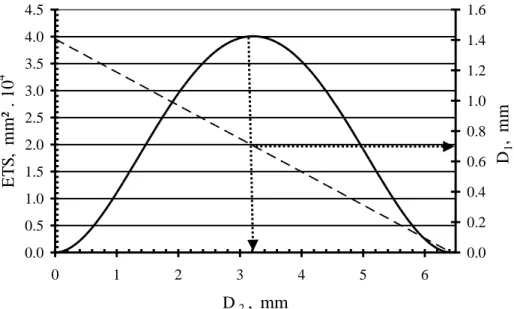
The procedure for source aperture optimization with fixed L is illustrated by figure 6. For each D2 value in the range 0 to 7 mm, a corresponding field diameter D1 value is
calculated according to the restricted collimation relation (equation 4 and dashed line, figure 6). The Equivalent Transmission Surface (ETS defined in the appendix) between the field and source apertures is calculated for each pair of diameters D1 and D2andalso
0.0 0.5 1.0 1.5 2.0 2.5 3.0 3.5 4.0 4.5 0 1 2 3 4 5 6 D2, mm E T S , mm ² . 10 4 0.0 0.2 0.4 0.6 0.8 1.0 1.2 1.4 1.6 D1 , mm
Figure 6. Optimization of the source aperture diameter D2 with De = 2 mm, Dp =
1.8 mm, H1 = 14 mm and L = 50 mm – ETS (solid line), D1 equation 4 (dashed line).
The ETS curve has a bell shape with a transmission maximum at D2 = 3.2 mm. The
corresponding D1 value is read in figure 6 as indicated by the horizontal dotted arrow and
is 0.7 mm. At the maximum, Morland et al. (2) have shown that the flow entering the source under restricted collimation is only a fourth of the flow which would enter the source under conventional sampling (i.e. the flow transmitted between two coaxial orifices of diameters Dp and D2 separated by the distance H2).
Figure 7 illustrates the procedure for L optimization. It is important to keep in mind that L is defined during the design of the Knudsen cell and source vacuum chamber and cannot be modified afterwards. The set of values of the geometric parameters is identical to figure 6, except that the ETS curve is calculated for L = 50, 70 and 82 mm.
D2range with our ion source
0.0 0.5 1.0 1.5 2.0 2.5 3.0 3.5 4.0 4.5 5.0 0 1 2 3 4 5 6 7 D2, mm E T S , mm ² . 10 4
D2range with our ion source
0.0 0.5 1.0 1.5 2.0 2.5 3.0 3.5 4.0 4.5 5.0 0 1 2 3 4 5 6 7 D2, mm E T S , mm ² . 10 4
Figure 7. Optimization of L = H2-H1 with De = 2 mm, Dp = 1.8 mm, H1 = 14 mm and
L = 50 mm (thick solid line), 70 mm (thin solid line), 82 mm (dotted line).
Figure 7 shows that first, the maximum ETS increases with L and second that the maximum shifts towards higher D2 values. The practical implication is that the distance
between the field and the source apertures can be increased without decreasing the transmission. However as the volume of the ion source is finite, D2 has an upper bound
(4.5 mm in our case) and there is also an upper bound for L. We have chosen a quite large value of L = 82 mm, because of the large diameter of our vacuum chamber, 200 mm, and of the fact that we wanted to have an access below the ion source from the front flange to simplify the source mounting and dismounting operations.
Ion source optimization
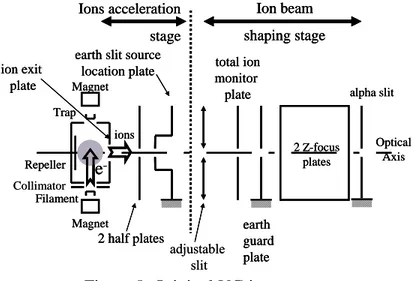
The original VG electron impact source has an orthogonal cross beam geometry (figure 8). The electrons emitted by the filament, and confined by two permanent magnets, travel in the direction of the vertical arrow. They intersect the effusing beam, represented by the grey circle, at right angle before being collected by the trap. The ions formed are extracted in the direction of the horizontal arrow. Then, the ions are accelerated between the exit of the source box and what is called the earth slit source location plate. Two half plates allows for beam deflection. The acceleration stage is followed by an ion beam shaping stage with 2 Z-focus plates between the adjustable and the alpha slits which define the angular divergence of the beam.
Collimator adjustable slit Optical Axis Magnet Repeller Trap Filament Magnet Ion beam shaping stage Ions acceleration stage 2 Z-focus plates alpha slit earth guard plate total ion monitor plate earth slit source
location plate 2 half plates ion exit plate ions e -Collimator adjustable slit Optical Axis Magnet Repeller Trap Filament Magnet Ion beam shaping stage Ions acceleration stage 2 Z-focus plates alpha slit earth guard plate total ion monitor plate earth slit source
location plate 2 half plates ion exit plate ions e -Optical Axis Magnet Repeller Trap Filament Magnet Ion beam shaping stage Ions acceleration stage 2 Z-focus plates alpha slit earth guard plate total ion monitor plate earth slit source
location plate 2 half plates ion exit plate ions e
-Figure 8. Original VG ion source. This type of source has several drawbacks.
- First, the source box is heated up to 600 K by the filament radiation and very volatile species in the molecular beam condensing as deposits on the source walls can re-vaporize either as incident species or as new more volatile species as explained by Morland et al. (2).
- Second, permanent magnets used to confine the electron beam can cause mass bias as pointed out by Drowart et al. (13).
- Third, the source aperture is a hole of fixed diameter drilled in the stainless steel source box whereas a replaceable source aperture is required for transmission optimization under restricted collimation.
- Fourth, there is no extraction plate and a single acceleration plate. Considering the above-mentioned drawbacks and the need to counterbalance the decrease of the beam transmission between the Knudsen cell and the ionization source under restricted collimation, the source box and the acceleration stage have been modified in order to increase the source sensitivity.
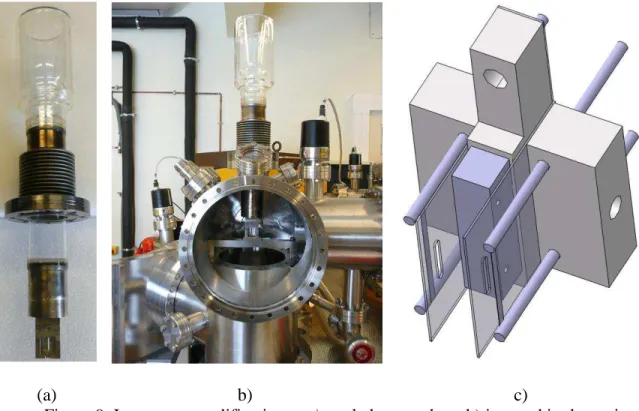
A picture of the new source box is seen in figure 9a. The new box, equipped with a replaceable source aperture, is made of -metal to provide magnetic shielding around the ionization volume. The box is also cooled by a liquid nitrogen Dewar vacuum vessel. Morland et al. (2) have shown that this cryogenic pumping suppress parasitic re-vaporizations and reduces the peak at M = 28 by a factor of 100. Figure 9b shows how the cooled source box is inserted in the new vacuum chamber.
The new emission block is seen in figure 9c. The permanent magnets are suppressed. The trap is replaced by a second independent filament to increase ionization efficiency, to homogenize the electron density in the source and finally to obtain a more symmetric ionization profile during a position scan of the effusion device.
(a) b) c)
Figure 9. Ion source modifications - a) cooled source box, b) inserted in the main vacuum chamber, c) two filaments ionization block.
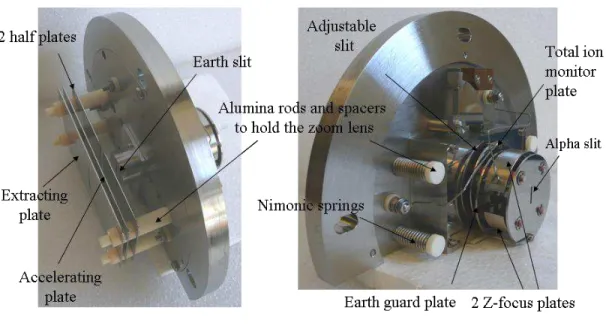
The new accelerating stage (figure 10a) is a three elements electrostatic zoom lens with one extracting plate, one accelerating plate and two half plates for beam deflection. This design is copied from the source of the 12-90HT Nuclide Corp. mass spectrometer used by Chatillon et al. (14) and by Copland and Jacobson (15). The original VG beam shaping stage is left unmodified (figure 10b).
a) b)
Figure 10. Ion gun – a) new accelerating stage, b) unmodified beam shaping stage. The requirements for the materials to use in the construction of ion optics lenses are reviewed in (16).
Inconel 600 has been chosen for the lens metallic plates. Compared to standard austenitic stainless steel grades (AISI 304L or 316L) which exhibit weak magnetism because of their residual ferrite content, Inconel is non-magnetic. Its resistance to oxidation and corrosion, even at high temperatures, is also very good. This is important as the electrodes must withstand ion bombardment and periodic cleaning and polishing.
An electrical insulator material is needed for assembling the different plates. Choice of a ceramic material is mandatory due to the high temperature reached during the baking of the vacuum chambers. The Degussit AL23 dense alumina from the Umicore Company has been chosen because it combines a high dielectric strength (> 40 kV/mm) and a null open porosity (17) which minimizes degassing.
Other modifications and main subassemblies remaining to build
The new source and furnace chamber is seen in figure 10b with the front flange removed, its large diameter of 200 mm allows to house a 4 cell Knudsen effusion device. Complete revamping of the vacuum system has been performed to increase the pumping capacities and the conductance of the pipes in the primary and secondary circuits. A new pump control and safety system has been added.
The ion detection has been totally upgraded. The linear motion of the in-line retractable Faraday cup has been automated. The new secondary electron multiplier (22 dynodes Model 14150H from ETP) is protected against electromagnetic fields by a three layer (pure iron/copper/-metal) shielding. Ion counting electronics comprises an Ortec Model 9327 1-GHz amplifier/timing discriminator and a Signal Recovery Model 3820 125-MHz Universal Counter.
The two main subassemblies remaining to build are the furnace and its positioning system.
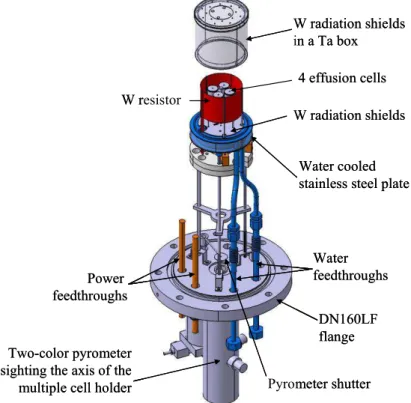
The tentative design of the high temperature multiple-cell furnace is shown in figure 11. It is adapted from the design of the furnace used by Chatillon and coworkers (18). The multiple-cell holder is supported by a water cooled stainless steel plate and heated by a tungsten foil resistor. The resistor is surrounded by a series of tungsten radiation shields and a tantalum box. All the necessary feedthroughs for electrical power, water cooling and thermocouples are mounted on the base flange. A two-color pyrometer, also attached to this flange, sights the axis of the multiple-cell holder.
W resistor Power feedthroughs Water feedthroughs W radiation shields W radiation shields in a Ta box DN160LF flange Two-color pyrometer
sighting the axis of the multiple cell holder
Water cooled stainless steel plate 4 effusion cells Pyrometer shutter W resistor Power feedthroughs Water feedthroughs W radiation shields W radiation shields in a Ta box DN160LF flange Two-color pyrometer
sighting the axis of the multiple cell holder
Water cooled stainless steel plate 4 effusion cells
Pyrometer shutter
Figure 11. Multiple-cell effusion furnace.
The furnace assembly presented in figure 11 is rigid and its positioning mechanism to be built is not shown in the figure. This mechanism, described in details by Heyrman et al. (3), will move the base flange and the furnace as a whole, according to a double tilt principle in which the effusion orifices move on a spherical cap.
The main advantages are:
- first that the mechanism is fully independent of the furnace and a single system can be used for several different furnaces (e.g. mono-cell, multiple-mono-cell, gas injection cell),
- second that no complex mechanism and minimum degassing surfaces are under vacuum,
- and third that the movement is software controlled, soft and fast with a high positioning accuracy (±0.025 mm).
Conclusions and future work
To our knowledge no multiple-cell KEMS based on these concepts is available on a commercial basis. It is required to start from an existing apparatus or to buy a new one before transforming it.
Major instrumentation and engineering work is necessary for the transformation. Molecular transmission calculations are needed to optimize the design and the future working of the spectrometer. Computer Aided Design is absolutely necessary for the mechanical engineering.
This kind of project can only be carried out within a laboratory already having a strong experience in KEMS or with the technical and scientific support of an experienced team/researcher in the field.
Appendix: molecular transmission between 2 coaxial disks
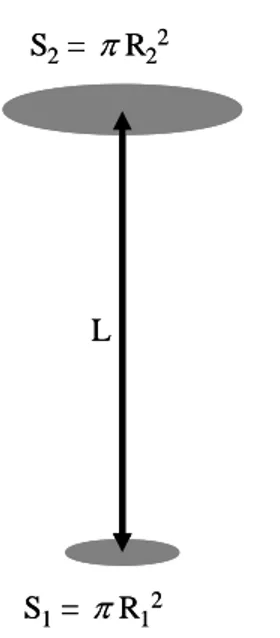
The number of molecules N transmitted between 2 coaxial disks of surfaces S1 and S2
(figure 12) per unit time (in mol.s-1) is given by Carlson (19) as:
2 2 2 1 2 2 2 2 1 2 2 2 2 1 2 2 1 4 2 4 , ,R R nv L R R L R R R R L N [5] Where: 4 v nrepresents the total flux density of molecules emitted in the half space above S1 in
mol.m-2.s-1,
RT P
n is the number of molecules in the vapor per unit volume in mol.m-3, P being the pressure, R the gas constant and T the temperature,
M RT v
8
is the average velocity of molecules in m.s-1, M being the mass of the molecules.
The term between square brackets in equation 5 has the dimension of a surface (m2) and will hence be called the Equivalent Transmission Surface (ETS). The ratio between the ETS and S1 represents the fraction of molecules emitted from S1 in the half space
above which hit S2.
Analytical derivation of equation 5 is not straightforward and the multiple integration methodology is explained in the appendix to the paper of Vassent et al. (20). Detailed calculation is left to the reader.
S2= R22 S1= R12 L S2= R22 S1= R12 L
Figure 12. Geometric parameters for molecular transmission calculation between two coaxial disks.
Acknowledgments
The authors are very grateful to Jean Drowart for giving them the initial instrument, and to Christian Chatillon, Laurent Artaud, Hervé Collas and Ioana Nuta from the CNRS SIMAP laboratory in Grenoble for countless KEMS discussions and their invaluable help in the project. A financial support has been obtained from the PACA French region.
References
1. C. Chatillon, C. Senillou, M. Allibert, and A. Pattoret, Rev. Sci. Instrum., 47(3), 334 (1976).
2. P. Morland, C. Chatillon and P. Rocabois, High Temp. Mater. Sci., 37(3), 167 (1997).
3. M. Heyrman, C. Chatillon, H. Collas and J.-L. Chemin, Rapid Commun. Mass Spectrom., 18(2), 163 (2004).
4. K. Hilpert, Structure & Bonding, Noble Gas and High Temperature Chemistry, vol. 73, Springer Berlin Heidelberg, p. 97 (1990).
5. K. L. Komarek, Pure Appl. Chem., 64(1), 93 (1992).
6. R. H. Moore, D. Robinson and B. B. Argent, J. Phys. E: Sci. Instrum., 8, 641 (1975).
7. G. Riekert, P. Lamparter and S. Steeb, Z. Naturforsch., 36A, 447 (1981).
8. J. Roboz, Introduction to mass spectrometry: Instrumentation and Techniques,
New York: Interscience Publishers, p. 539 (1968).
9. C. Ronchi, F. Capone, J. Y. Colle and J. P. Hiernaut, J. Nucl. Mater., 280(1), 111 (2000).
10. C. Chatillon, A. Pattoret and J. Drowart, High Temp. - High Pressures, 7, 119 (1975).
11. E. H. Copland and N. S. Jacobson, Electrochem. Soc. Interface, 28 (2001).
12. F. Z. Roki, C. Chatillon, M. N. Ohnet and D. Jacquemain, J. Chem. Thermodyn.,
40(3), 401 (2008).
13. J. Drowart, C. Chatillon, J. Hastie and D. Bonnell, Pure Appl. Chem., 77(4), 683 (2005).
14. C. Chatillon, M. Allibert and A. Pattoret, High Temp. Sci., 8, 233 (1976).
15. E. H. Copland and N. S. Jacobson, NASA/TP-2010-216795 Glen Research Center, Cleveland Ohio, (2010).
16. J. H. Moore, C. C. Davis, and M. A. Coplan, Charged-Particles Optics, in
Building Scientific Apparatus: a Practical Guide to Design and Construction,
p. 287, Addison-Wesley, Reading, MA (1983)
17. Technical datasheet Degussit® Alumina Al2O3, http://www.degussit.fr/
18. M. Heyrman, PhD. Thesis, Institut National Polytechnique de Grenoble, Grenoble (2004).
19. K. D. Carlson, The Knudsen Effusion Method in The Characterization of High-Temperature Vapors, J. L. Margrave, Editor, p. 115, John Wiley & Sons, New York (1967).