Impact of industrial phosphate waste
discharge on the marine environment in the
Gulf of Gabes (Tunisia)
Akram El Kateb1*, Claudio Stalder2, Andres Ru¨ ggeberg1, Christoph Neururer1, Jorge E. Spangenberg3, Silvia Spezzaferri1
1 Department of Geosciences, University of Fribourg, Chemin du Muse´e 6, Fribourg, Switzerland, 2 Federal
Office of Public Health FOPH, Radiation Protection Division, Schwarzenburgstrasse 157, Bern, Switzerland,
3 Institute of Earth Surface Dynamics (IDYST), University of Lausanne, Lausanne, Switzerland
Abstract
The marine environment in the Gulf of Gabes (southern Tunisia) is severely impacted by phosphate industries. Nowadays, three localities, Sfax, Skhira and Gabes produce phos-phoric acid along the coasts of this Gulf and generate a large amount of phosphogypsum as a waste product. The Gabes phosphate industry is the major cause of pollution in the Gulf because most of the waste is directly discharged into the sea without preliminary treatment. This study investigates the marine environment in the proximity of the phosphate industries of Gabes and the coastal marine environment on the eastern coast of Djerba, without phos-phate industry. This site can be considered as "pristine" and enables a direct comparison between polluted and “clean” adjacent areas.
Phosphorous, by sequential extractions (SEDEX), Rock-Eval, C, H, N elemental analy-sis, and stable carbon isotope composition of sedimentary organic matter, X-ray diffraction (qualitative and quantitative analysis) were measured on sediments. Temperature, pH and dissolved oxygen were measured on the water close to the sea floor of each station to esti-mate environmental conditions. These analyses are coupled with video surveys of the sea floor. This study reveals clear differentiations in pollution and eutrophication in the investi-gated areas.
Introduction
Phosphorus plays a major role in several biological processes like energy transfer and is present e.g., in genetic material and in bones [1–3]. It is also an important element of fertilizers in agri-culture production. Two forms of crystallized phosphorus can be mainly found: “white phos-phorus” with a tetrahedral structure, “red phosphos-phorus” which is present under polymeric forms and mineral forms such as phosphate [4].
Phosphate deposits in North Africa and in the Middle East have sedimentary origin [5]. Phosphate rocks (phosphorite) in Tunisia formed during Palaeocene-Eocene time in the Gafsa basin in western part of Tunisia, around the Kasserine and Djeffara Islands and the Algerian a1111111111 a1111111111 a1111111111 a1111111111 a1111111111 OPEN ACCESS
Citation: El Kateb A, Stalder C, Ru¨ggeberg A, Neururer C, Spangenberg JE, Spezzaferri S (2018) Impact of industrial phosphate waste discharge on the marine environment in the Gulf of Gabes (Tunisia). PLoS ONE 13(5): e0197731.https://doi. org/10.1371/journal.pone.0197731
Editor: João Miguel Dias, Universidade de Aveiro, PORTUGAL
Received: December 7, 2017 Accepted: May 8, 2018 Published: May 17, 2018
Copyright:© 2018 El Kateb et al. This is an open access article distributed under the terms of the
Creative Commons Attribution License, which permits unrestricted use, distribution, and reproduction in any medium, provided the original author and source are credited.
Data Availability Statement: All relevant data are within the paper and its Supporting Information files.
Funding: This work was founded by the Swiss National Science Fondation (Schweizerischer Nationalfonds zur Fo¨rderung der
Wissenschaftlichen Forschung) (http://www.snf. ch/en/Pages/default.aspx) with grant 200021– 149589 for Akram El Kateb. The funder had no role in study design, data collection and analysis,
promontory [6–11]. Phosphorites in the Gafsa basin contain authigenic apatite from pellets and coprolites, phosphatized fossils, coated grains and oolites and biogenic apatite fossils such as fish teeth and skeletal fragments [9].
Phosphorites are chemically treated to produce phosphoric acid. This process generates a large volume of phosphogypsum (PG), around 5 tons per ton of phosphoric acid [12]. Phos-phogypsum contains several pollutants like heavy metals, fluorine, phosphorus and even radio-nuclides generating radioactivity [12–18]. In 2010, Tunisia was a leading country of phosphate production (8 million tons) being the fifth phosphate producer worldwide with around 13 mil-lion tons of phosphate ore extracted. Today the country treats 80% of his phosphorite produc-tion in four main industries. Three of them are located along the coast of the Gulf of Gabes. At Sfax and Skhira, PG is stored in large stacks around the industry complex.
The large industrial site at Gabes has several units of phosphorite treatment and the totality of the waste (PG, industrial sludge, waste water) is directly discharged into the sea through a canal [19] with relevant environmental impact [13,14,20,21,22,23].
Consequence of the large production of PG is a severe heavy metal contamination of seawa-ter and sediments (e.g., [24–28]), which has a strong impact on the marine fauna by bioaccu-mulation effect since elementary phosphorus can be assimilated in sediments in various phases [29–31].
The phosphorus sequential extraction (SEDEX) from sediments allows quantifying five sed-imentary phosphorus reservoirs [29,31] and provides important information about the phos-phorus cycle also in context of polluted sites [2,32,33,34,35]. This study investigates the effect of large quantity of PG wastes discharged into the Gulf of Gabes, the role of the 5 phos-phorus phases of Ruttenberg et al. [31] in modifying environmental conditions and compares the Gulf with an analogue coastal marine environment (eastern coast of Djerba), which has no phosphate production industry and can consider as “pristine”.
As a nutrient, phosphorus has the potential to trigger phytoplankton blooms [36], thus to increase organic matter (OM) input to the seafloor and consequently to trigger eutrophication [37]. Therefore, this study also investigates the origin of OM to identify its origin and the pos-sible link with pollutants.
Materials and methods
Ethic statement
No specific permissions were required to collect samples on the entire working area for this study. All the locations where the samples were collected are public access. In addition, the field studies did not involve endangered or protected species.
Study site and sampling strategy
The Gulf of Gabes is approximately 90 km wide, 100 km long and bounded by the Kerkhenna Islands to the north and the Djerba Island to the south. It presents some unique characteristics in the Mediterranean Sea such as a gently sloping bathymetry to a water depth of 50 m at around 130 km from the coastline and tidal amplitude, which is the highest in the Mediterra-nean Sea, exceeding 1.7 m [38].
The Gulf of Gabes plays an important role in Tunisian economy as a well-known fishing reserve. In the past 25 years, 65% of Tunisian fishery was from this region [39]. At the begin-ning of the 20th century, the majority of its seafloor was colonized by seagrass.Posidonia ocea-nica was the dominant marine plant in the region providing an ideal nursery environment for
many species [39,40].
decision to publish, or preparation of the manuscript.
Competing interests: The authors have declared that no competing interests exist.
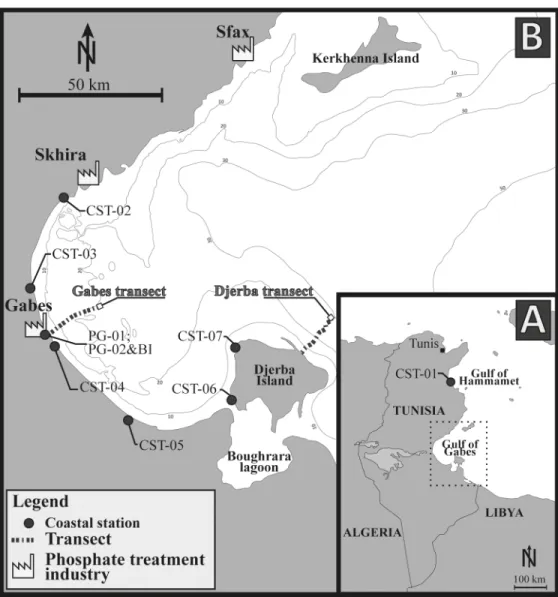
Seven coastal stations were sampled at >1 m water depth. They encompass over 200 km along the eastern Tunisian coast from the Gulf of Hammamet to the northern edge of Djerba Island but most of the stations are located along the Gulf of Gabes (Fig 1).
Two transects were sampled perpendicularly to the coast. The Gabes transect was sampled between the industrial and the fishing harbours, it includes 16 stations from the phosphate industries to offshore. Samples were collected approximately every 1 km from the coast to 17.3 km offshore. (Fig 1). The first station GBS-01 is located 400 m from the shoreline and 800 m from the waste industry discharge area. Water depth ranges from 4.5 m (GBS-01) to 19.5 m (GBS-10, GBS-11 and GBS-15). The Djerba transect includes 15 stations and is located on the eastern coast of Djerba Island (Fig 1). Samples were collected along a 13.8 km long transect with the first station DJB-01 at 600 m distance from the coast. Water depth ranges from 5.1 m (DJB-01) to 26.8 m (DJB-15) (Fig 1).
Three additional samples were collected from the waste discharge canal of the phosphate industries of Gabes. Two of them contain PG (PG-01 and PG-02) and were collected in
Fig 1. Maps of the study area showing the sampling sites. (A) Maps of Tunisia showing the location of the coastal station CST-01. (B) Localities of the Gabes and, Djerba transects and other coastal stations inside the Gulf of Gabes. This figure is similar but not identical to the original image, and is therefore for illustrative purpose only.
different periods (PG-01 in January 2014 and PG-02 in July 2014). The BI sample, composed of dark industrial sludge, was collected in July 2014. Geographical coordinates of transects and coastal stations are inTable 1.
Sampling methods and in-situ data collection
Surface sediment samples (first centimetre) were collected for geochemical, sedimentological and mineralogical analyses. An Ekman-Birge box core (15x15x30 cm) was deployed at each station of both transects (Fig 1) to collect surface sediments. Sediments were photographed and described to document sedimentary facies. Around 15 cm3of the first centimetre of sur-face sediment were collected in a falcon tube using a polyethylene spatula and all samples were kept at 4˚C. Approximately 50 cm3of surface sediment were subsampled at each station for grain size analysis.
The following data were collected in-situ along the two transects: A video survey of the sea-floor was performed on each station to have an overview of the environment (e.g., marine flora and fauna, sedimentary facies). Videos were obtained by a GoPro1 camera and a water-proof torch fixed on an aluminium frame. Water depth was measured with a Compass1 echo sounder system. Water temperature, pH and dissolved oxygen were measured at the seafloor at each station. Water temperatures were measured using a Campbell Scientific1 107 temper-ature sensor with an accuracy of±0.2˚C at a range of -0˚C to 50˚C. pH was measured with a Campbell Scientific1 ISFET CS525 probe, which can operates down to 70 m water depth. Temperature values are compensated with an accuracy of±0.1 pH units at a temperature range to 0–40˚C. Dissolved oxygen (DO) was measured with a Campbell Scientific1 CS512 probe ranging from 0 to 50 mg/L and operating between 0 and 40˚C at a pressure up to 2 bars with an accuracy of±0.2 mg/L. Sensors were attached to an aluminium frame equipped with a tripod allowing the stability of system at the seafloor. A three-point calibration was performed for the pH (pH at 4.01, 7.00 and 10.00), the DO was calibrated based on the atmospheric pres-sure at sea level before sampling at each transect. Meapres-surements were recorded on a datalogger CR1000 (Campbell Scientific1).
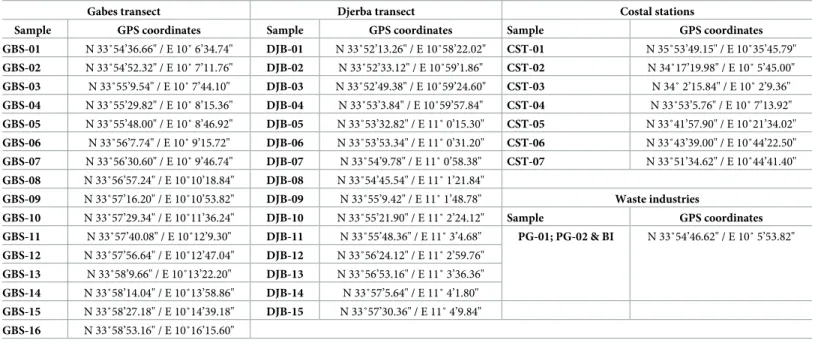
Table 1. Geographical coordinates of stations of Gabes and Djerba transects and coastal stations.
Gabes transect Djerba transect Costal stations
Sample GPS coordinates Sample GPS coordinates Sample GPS coordinates
GBS-01 N 33˚54’36.66" / E 10˚ 6’34.74" DJB-01 N 33˚52’13.26" / E 10˚58’22.02" CST-01 N 35˚53’49.15" / E 10˚35’45.79" GBS-02 N 33˚54’52.32" / E 10˚ 7’11.76" DJB-02 N 33˚52’33.12" / E 10˚59’1.86" CST-02 N 34˚17’19.98" / E 10˚ 5’45.00" GBS-03 N 33˚55’9.54" / E 10˚ 7’44.10" DJB-03 N 33˚52’49.38" / E 10˚59’24.60" CST-03 N 34˚ 2’15.84" / E 10˚ 2’9.36" GBS-04 N 33˚55’29.82" / E 10˚ 8’15.36" DJB-04 N 33˚53’3.84" / E 10˚59’57.84" CST-04 N 33˚53’5.76" / E 10˚ 7’13.92" GBS-05 N 33˚55’48.00" / E 10˚ 8’46.92" DJB-05 N 33˚53’32.82" / E 11˚ 0’15.30" CST-05 N 33˚41’57.90" / E 10˚21’34.02" GBS-06 N 33˚56’7.74" / E 10˚ 9’15.72" DJB-06 N 33˚53’53.34" / E 11˚ 0’31.20" CST-06 N 33˚43’39.00" / E 10˚44’22.50" GBS-07 N 33˚56’30.60" / E 10˚ 9’46.74" DJB-07 N 33˚54’9.78" / E 11˚ 0’58.38" CST-07 N 33˚51’34.62" / E 10˚44’41.40" GBS-08 N 33˚56’57.24" / E 10˚10’18.84" DJB-08 N 33˚54’45.54" / E 11˚ 1’21.84" GBS-09 N 33˚57’16.20" / E 10˚10’53.82" DJB-09 N 33˚55’9.42" / E 11˚ 1’48.78" Waste industries GBS-10 N 33˚57’29.34" / E 10˚11’36.24" DJB-10 N 33˚55’21.90" / E 11˚ 2’24.12" Sample GPS coordinates GBS-11 N 33˚57’40.08" / E 10˚12’9.30" DJB-11 N 33˚55’48.36" / E 11˚ 3’4.68" PG-01; PG-02 & BI N 33˚54’46.62" / E 10˚ 5’53.82" GBS-12 N 33˚57’56.64" / E 10˚12’47.04" DJB-12 N 33˚56’24.12" / E 11˚ 2’59.76" GBS-13 N 33˚58’9.66" / E 10˚13’22.20" DJB-13 N 33˚56’53.16" / E 11˚ 3’36.36" GBS-14 N 33˚58’14.04" / E 10˚13’58.86" DJB-14 N 33˚57’5.64" / E 11˚ 4’1.80" GBS-15 N 33˚58’27.18" / E 10˚14’39.18" DJB-15 N 33˚57’30.36" / E 11˚ 4’9.84" GBS-16 N 33˚58’53.16" / E 10˚16’15.60" https://doi.org/10.1371/journal.pone.0197731.t001
Geochemical analyses
The SEDEX phosphorus extraction was performed on all sediment samples. They were dried at room temperature and manually grounded in an agate mortar to homogenize the sediment and to obtain a fine powder. They were successively dry sieved trough a 125μm mesh to remove coarse particles, only the fine sediment fraction (<125μm) was analysed. The phos-phorus sequential extraction of Ruttenberg et al. [31], was performed on 80 mg of dry sedi-ment to extract five phosphorus phases: 1) Exchangeable or loosely sorbed phosphorus (Pex);
2) Fe-bound phosphorus (PFe); 3) Authigenic apatite: carbonate fluorapatite (CFA) + biogenic
apatite + CaCO3-bound phosphorus (Pauthi); 4) Detrital apatite + other inorganic phosphorus
(Pdetr); 5) Organic phosphorus (Porg). The extraction was performed at the University of
Fri-bourg and extracted phases were measured with a Bio-Tek Uvikon XS spectrophotometer using the molybdate blue method. The Fe-bound phosphorus (PFe) phase and the Iron content
were measured with an ICP-OES spectrometer Optima 7000 DV.
Rock-Eval analyses were performed on surface sediment samples following Rock-Eval6 technology [41] to obtain Total Organic Carbon (TOC inwt.%), Hydrogen Index (HI),
Oxy-gen Index (OI), S1, S2 and S3 peaks, maximal temperature (Tmax) and mineral carbon (MINC)
values. This technique uses temperature programmed heating of rocky sample under inert condition (anoxic). HI corresponds to the free hydrocarbons present in the sample (mg HC/g TOC) and is measured on S1 peak. OI represents the amount of hydrocarbons and compounds containing oxygen that are produced during the thermal cracking of kerogen (mg CO2/g
TOC) and is determined from the S2 and S3 peaks. Maximal temperature is measured at the maximum of S2 peak. In addition, carbon oxidation is performed at high temperature (up to 850˚C), which allows MINC determination [42,43].
Total carbon, hydrogen and nitrogen (C,H,N) content (inwt.%) were measured in all
sur-face sediment samples using a Thermo Finnigan Flash EA 1112 gas chromatography analyser. Rock-Eval and C, H, N analysis were performed on approximately 100 mg bulk sediment at the University of Lausanne.
Matrix effects, corresponding to carbon adsorption capacity of the sediment, can be quanti-fied for a group of samples based on Rock-Eval data set. The positive intercepts of the regres-sion line for a group of samples on S2 vs. TOC diagram indicate a matrix effect and the position of the intercept is the measure of the amount of absorption (g of OM absorbed by 1g of sediment) [44]. Matrix effect was quantified for samples from the Gabes and Djerba tran-sects and coastal stations.
Different graphs can be used to qualify the type of the kerogen present in OM and deter-mine its origin. For the present study, the S2 (mg/g) vs. TOC graph was used to deterdeter-mine if a matrix effect influences the measurements [44,45]; the HI vs. Tmaxplot was used to determine
the origin of the sedimentary organic matter [46].
Molar C/N ratio is calculated for sediment samples, C was determined from the TOC con-tent in the sediment and N from the total nitrogen concon-tent (TN). Total organic carbon and TN values are converted intoμmol/g to obtain the molar C/N ratio. However, for several samples (CST-01; CST-04; CST-05 and PG-01; PG-02) TN values were below the detection limit. Molar C/P is calculated for sediment samples, C was determined from the TOC content and P from Porgphase of SEDEX extraction.
Total phosphorus (Ptotal) represents the sum of all phosphorus reservoirs (Ptotal= Pex+ PFe+
Pauthi+ Pdetr+ Porg). Proportion of phosphorus reservoirs (Pex; PFe; Pauthi; Pdetr; Porg) is
calcu-lated in percentage depending of the total phosphorus (Ptotal) in sediment.
Stable carbon isotope composition of the sedimentary OM (δ13COMvalues) was measured
were dissolved using a 10% HCl solution at 50˚C and rinsed with milli-Q water, the process was repeated twice. Stable carbon isotopes composition was measured at the Stable Isotopes Laboratory (University of Lausanne) by flash combustion on a Carlo Erba 1108 elemental ana-lyser (EA) connected to a Thermo Fisher Scientific Delta V IRMS that was operated in a con-tinuous helium flow mode via a Conflo III split interface. Results were expressed asδ13C as the per mil (‰) deviations of the ratio of the heavy to light isotopes (13C/12C) relative to Vienna Pee Dee Belemnite (VPDB) standard. Reproducibility and accuracy were better than± 0.1‰.
Sedimentary, mineralogical and petrographic analyses
Grain size analysis was performed on all samples except the industrial waste samples (PG-01, PG-02 and BI) and GBS-03 because of their small volume. Sediments were wet sieved through four mesh sieves: 500μm, 250 μm, 125 μm and 63 μm. The grain size distribution was obtained by weighing the size fractions and is expressed in percentage over the total dry sediment weight.
Sediments from both transects were analysed by X-ray powder diffraction (XRD) using a Powder X-ray diffractometer Rigaku Ultima IV with a cupper anode. Samples were powdered with an agate mortar to obtain a fine powder with a grain size between 5 and 15μm. The mea-surements were operated at 40 kV and 40 mA using a 1-D DTEX detector with Bragg Brentano Optics at step size of 0.02˚. The data were collected in the 5˚-120˚ 2θ angular range. X-ray pat-tern treatment was carried out with Panalytical X’pert HighScore Plus to identify the mineral-ogical phases. A Rietveld refinement was performed, with the same software, to quantify mineralogical phases.
Five polished thin sections were obtained from the carbonate nodules and were analysed under a polarized microscope. Three thin sections were made on nodules collected at station GBS-03 (GBS-03A to C) and two at station GBS-04 (GBS-04A and GBS-04B).
Results
Water parameters
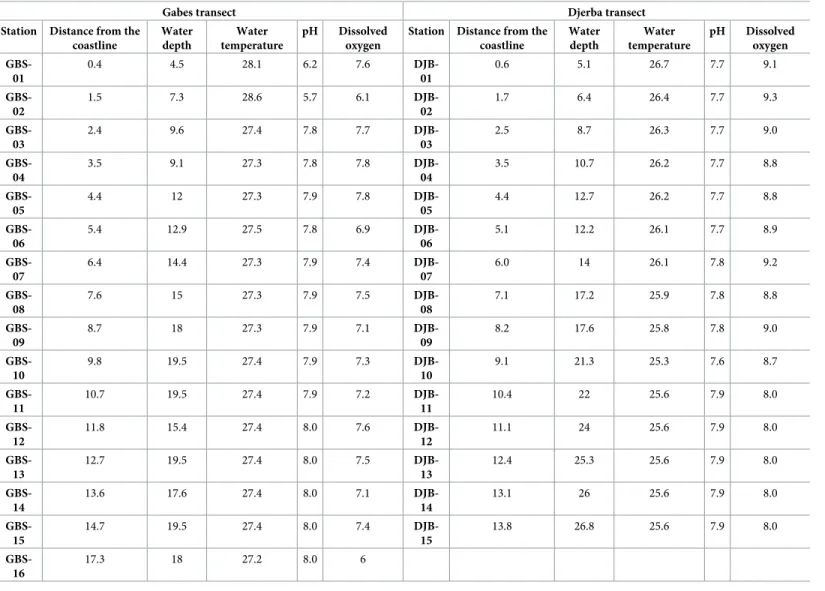
Water parameters measured along the two transects are presented inTable 2.
Gabes transect. Dissolved Oxygen (DO) values at the seafloor along the Gabes transect
fluctuate from 7.1 to 7.8 mg/L in most of the stations. Only exceptions are values of 6.9 mg/L (Station GBS-05) and 6.1 and 6 mg/L (GBS-02 and GBS-16, respectively) (Fig 2). Bottom water temperatures along the Gabes transect fluctuate around 27.3˚C, except for stations GBS-01 and GBS-02 where water temperatures exceed 28˚C (Fig 2). The pH varies from 7.8 and 8.0. Remarkably lower pH values were measured at stations GBS-01 (6.2) and GBS-02 (5.7).
Djerba transect. Bottom water parameters along the Djerba transect are significantly
dif-ferent from those of the Gabes (Table 2; Figs2and3). In particular, they decrease with decreasing water depth from 26.7˚C to 25.6˚C. pH values increase from 7.7 at station DJB-01 to 7.9 at the more distal parts. Dissolved oxygen reaches a maximum of 9.1 mg/L at station DJB-01 and values remain high exceeding 9 mg/L along the first 2.5 kilometres (until DJB-03) (Fig 2). From station DJB-04 to station DJB-10, DO fluctuates from 8.7 to 9.2 mg/L. In the remaining stations DO decreases to a minimum of 8.0 mg/L (Fig 2).
Sediment facies, mineralogy and nodule petrography
Along the Gabes transect, five sedimentary facies are identified (Figs4and5):
Facies G1 is present at stations GBS-01 and GBS-02 and is characterized by high content of
Facies G2 occurs only at station GBS-03. Nodules of few centimetres diameters cover the
seafloor forming a relatively hard substratum. The nodules are concretions of biogenic frag-ments (e.g. bivalve, bryozoan, foraminifera and coral) partially dissolved.
Facies G3 is present at stations GBS-04 to GBS-06 and is characterized by carbonate sand
and biogenic fragments (bryozoans, bivalves, gastropods and coral).
Facies G4 is present at station GBS-07 and GBS-08, GBS-10 to GBS-16 and is characterized
by a mix of large biogenic fragments (up to few centimetres) and fine sediment (clay).
Facies G5 is only present at station GBS-09 and is characterized by very fine sediments
(clay and silt) and low content of biogenic fragments.
Along the Djerba transect three main sedimentary facies are identified (Figs4and5):
Facies D1 is present from station DJB-01 to DJB-05 and at stations DJB-09 and DJB-10.
Fine siliciclastic grains (quartz) mainly characterize this facies.
Facies D2 occurs at stations DJB-06 to DJB-08. It consists of a mix of sand and small (few
millimetres) rounded biogenic fragments. Preservation state and shape of the biogenic frag-ments is poor due to mechanic erosion.
Table 2. Bottom water parameters from stations of Gabes and Djerba transects.
Gabes transect Djerba transect
Station Distance from the coastline Water depth Water temperature pH Dissolved oxygen
Station Distance from the coastline Water depth Water temperature pH Dissolved oxygen GBS-01 0.4 4.5 28.1 6.2 7.6 DJB-01 0.6 5.1 26.7 7.7 9.1 GBS-02 1.5 7.3 28.6 5.7 6.1 DJB-02 1.7 6.4 26.4 7.7 9.3 GBS-03 2.4 9.6 27.4 7.8 7.7 DJB-03 2.5 8.7 26.3 7.7 9.0 GBS-04 3.5 9.1 27.3 7.8 7.8 DJB-04 3.5 10.7 26.2 7.7 8.8 GBS-05 4.4 12 27.3 7.9 7.8 DJB-05 4.4 12.7 26.2 7.7 8.8 GBS-06 5.4 12.9 27.5 7.8 6.9 DJB-06 5.1 12.2 26.1 7.7 8.9 GBS-07 6.4 14.4 27.3 7.9 7.4 DJB-07 6.0 14 26.1 7.8 9.2 GBS-08 7.6 15 27.3 7.9 7.5 DJB-08 7.1 17.2 25.9 7.8 8.8 GBS-09 8.7 18 27.3 7.9 7.1 DJB-09 8.2 17.6 25.8 7.8 9.0 GBS-10 9.8 19.5 27.4 7.9 7.3 DJB-10 9.1 21.3 25.3 7.6 8.7 GBS-11 10.7 19.5 27.4 7.9 7.2 DJB-11 10.4 22 25.6 7.9 8.0 GBS-12 11.8 15.4 27.4 8.0 7.6 DJB-12 11.1 24 25.6 7.9 8.0 GBS-13 12.7 19.5 27.4 8.0 7.5 DJB-13 12.4 25.3 25.6 7.9 8.0 GBS-14 13.6 17.6 27.4 8.0 7.1 DJB-14 13.1 26 25.6 7.9 8.0 GBS-15 14.7 19.5 27.4 8.0 7.4 DJB-15 13.8 26.8 25.6 7.9 8.0 GBS-16 17.3 18 27.2 8.0 6
Distance from the coastline (km), water depth (m), water temperature (˚C), pH and dissolved oxygen (mg/L) at the seafloor.
Facies D3 is present from station DJB-11 to DJB-15 and is composed by relatively
well-pre-served biogenic fragments of bivalves, calcareous algae, gastropods and bryozoans.
The seafloor at stations DBJ-01 and DJB-02 is densely covered byP. oceanica forming a
sea-grass barrier (Figs4and5). Rhizomes of the sea-grass trap sediment forming small mounds or barrier reef meadow ofP. oceanica (e.g. [48]). Ripple marks are observed at several stations (Fig 5) and are generally well developed (30 cm high).
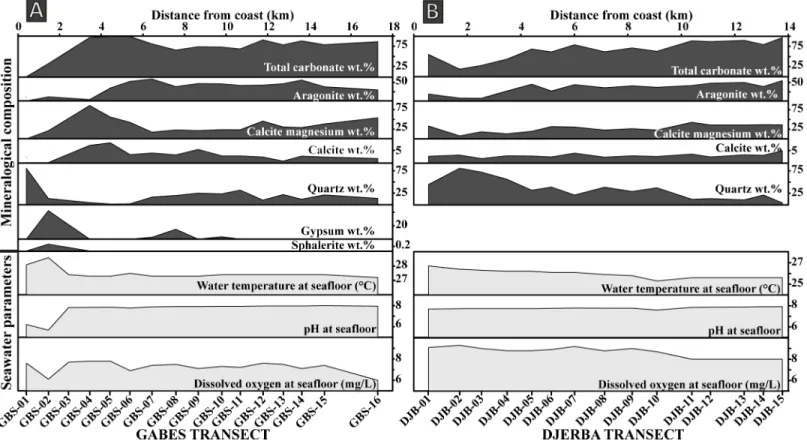
All XRD analysis and Rietveld refinement results are presented in theTable 3. The main minerals present is surface sediment along the Gabes transect are aragonite, calcite, Mg-calcite and quartz (Fig 2). Additional minerals like orthoclase, halite, gypsum, sphalerite and kaolinite are also present, whereas calcite is relatively scarce. This mineral is absent at stations GBS-01 and GBS-02, while stations GBS-04 and GBS-05 have highest calcite contents of 7.1 and 8.2wt.
%, respectively. From station GBS-06 to GBS-16, the calcite content is relatively constant with an average of 2.8wt.%. Mg-calcite reaches maximum value of 88.6 wt.% at GBS-04 station and
it is absent at station GBS-01. It is abundant between GBS-02 to GBS-05 station but decreases between GBS-06 to GBS-16 (average is 39wt.%). Aragonite is also absent in sample GBS-01
and relatively scarce in samples GBS-02 and GBS-03 with 11.1wt.% and 3.9 wt.%, respectively.
Quartz is very abundant at station GBS-01 with 80.5wt.% but the quartz content fall to 3.7 wt.
% at station GBS-04. From station GBS-07 to GBS-16, quartz content varies between 9.5 and 31.7wt.%. Orthoclase was identified only at station GBS-01 with 18.3 wt.%. Gypsum was
iden-tified at several stations: GBS-02, GBS-07, GBS-08 to -10 and GBS-13 and is especially abun-dant at station GBS-02 with 42.6wt.%. Sphalerite was detected only at the station GBS-02 with
0.3wt.% and kaolinite with only 1.1 wt.% at station GBS-09.
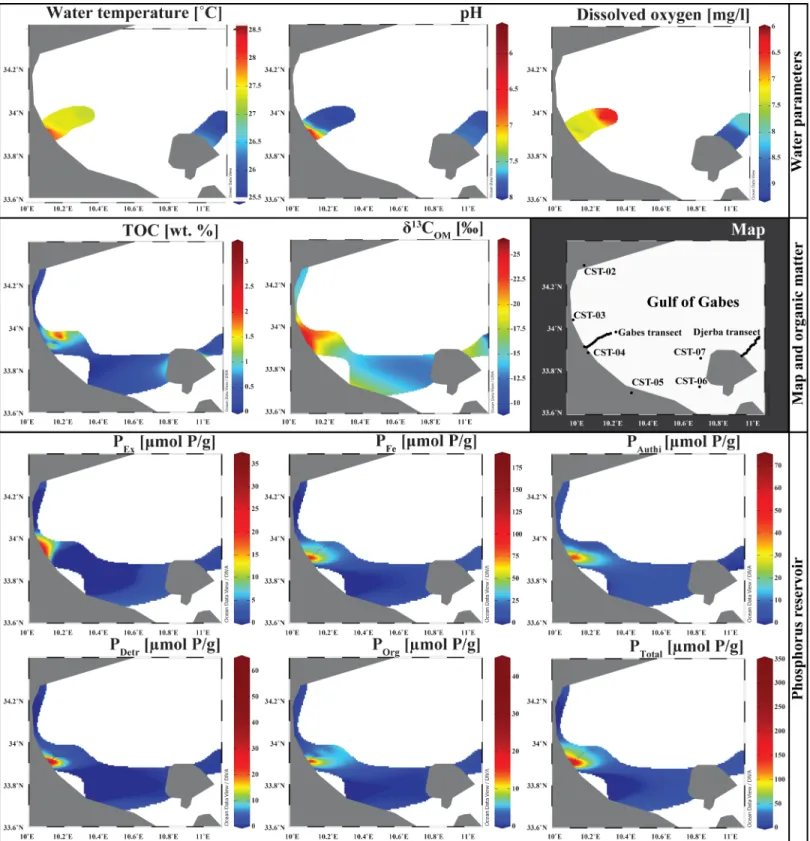
Fig 2. Variation in mineralogical composition and seawater parameters. (A) Gabes Transect. (B) Djerba transect.
Fig 3. Isosurface in the Gulf of Gabes. Water parameters, TOC, carbon isotope composition of sedimentary organic matter, phosphorus reservoir concentrations are plot on a 2D Maps of the Gulf of Gabes. The maps are drawn by using the Ocean Data View software [47].
Along the Djerba transect, only four minerals were identified: calcite, Mg-calcite, aragonite and quartz (Fig 2). Calcite is minor component in all samples and its content (1.7–4.9wt.%)
does not show any important fluctuation. Mg-calcite is abundant in all samples with an aver-age of 27.8wt.%. Only sample in DJB-02 it reaches values of 8 wt.%. The maximum Mg-calcite
content is reached in sample DJB-11 with 42.9wt.%. Aragonite is the most abundant mineral
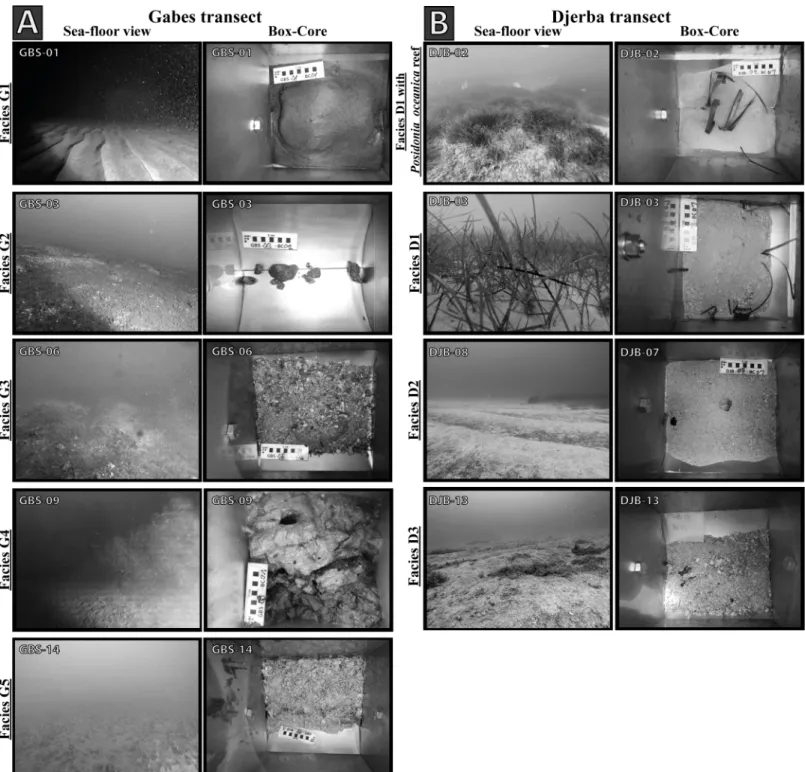
Fig 4. Illustration of the sedimentary facies. Images of seafloor and relative Box-Cores representing the sedimentary facies of (A) the Gabes and (B) the Djerba transects.
with an average of 35.3wt.%. Maximum aragonite content of 55.4 wt.% is reached at station
DJB-15. Stations DJB-02 and DJB-03 show the lowest aragonite content, hoverer, its content increases from the coast to offshore. Quartz has an inverse trend and its content increases towards the shoreline (Fig 2). The maximum quartz content occurs at station DJB-02 with 81
wt.% and decreases to 3.5 wt.% at station DJB-15.
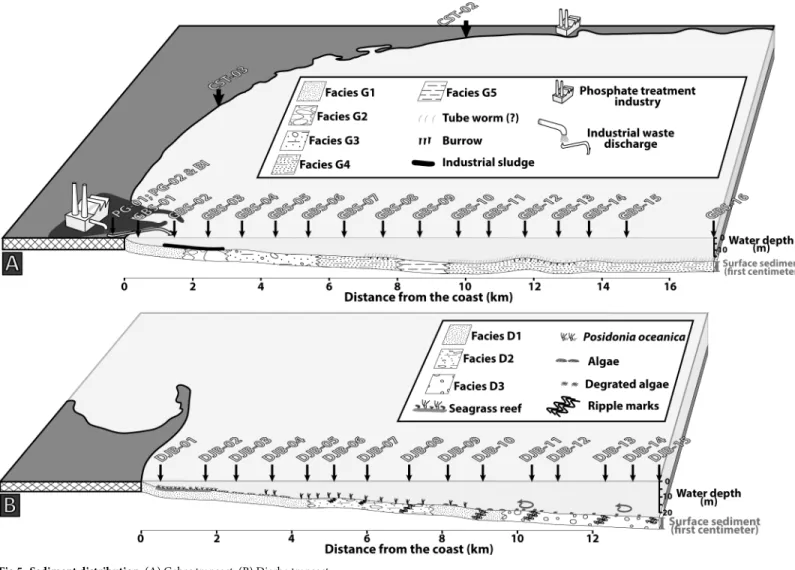
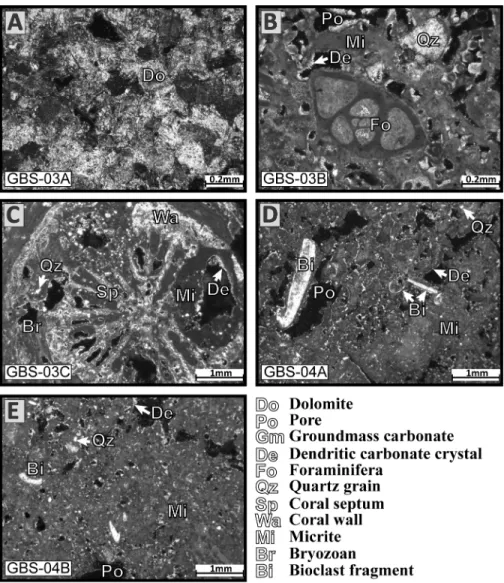
Nodule GBS-03A (Fig 6) is the only one composed of dolomite crystals. The shape of the crystals is relatively regular with rhombohedral shapes, however, some grains are rounded and a zonation may be visible. In a few cases, the centre is dissolved and only the rim of the crystal is remaining. This nodule does not contain quartz grains, bioclasts or pores. The carbonate nodule GBS-03B (Fig 6) has a high porosity and many rounded quartz grains and bioclasts (bivalves, foraminifera and bryozoan). Micrite is abundant and represents a large part of the nodule. Some pores have the shape of a bivalve fragment and indicate a total dissolution of bio-clasts inside the nodule, in some cases the bioclast is partially dissolved. The internal edging of the pores is filled with very fine carbonate needles perpendicular to the porosity border. The nodule GBS-03C (Fig 6) is a coral fragment filled with micrite. The polished thin section is a cross section of the coral fragment showing wall, columella, septum and the external part cov-ered by an encrusting bryozoan colony. The coral skeleton is micritic and pores are filled with Fig 5. Sediment distribution. (A) Gabes transect. (B) Djerba transect.
micrite, rounded quartz grains, perpendicular carbonate needles also cover internal margins. Nodules from station GBS-04 are similar (Fig 6). Rounded quartz grains and bioclast are abun-dant and a large part of the nodules is micrite. The nodules contain large pores where perpen-dicular carbonate needles cover the internal margins and small pores are generally entirely filled by carbonate needles.
Organic matter and phosphorus in surface sediment
Rock-Eval and C, H, N data are presented inTable 4. Along the Gabes transect, high TOC con-tent is measured in samples GBS-02 and GBS-09 with values of 3.34wt.% and 3.38 wt.%,
respectively. Except for station GBS-02, TOC does not exceed 0.80wt.% along the first seven
kilometres of the Gabes transect. Along the rest of transect, TOC increases with values exceed-ing 1wt.% (Fig 3). The HI and OI values vary from 143 to 378 mg HC/g TOC and 128 to 1083 mg CO2/g TOC, respectively. The average of TN content for the Gabes transect is 0.12wt.%
with a maximum of 0.33wt.% at station 09 and a minimum of 0.02 wt.% at station
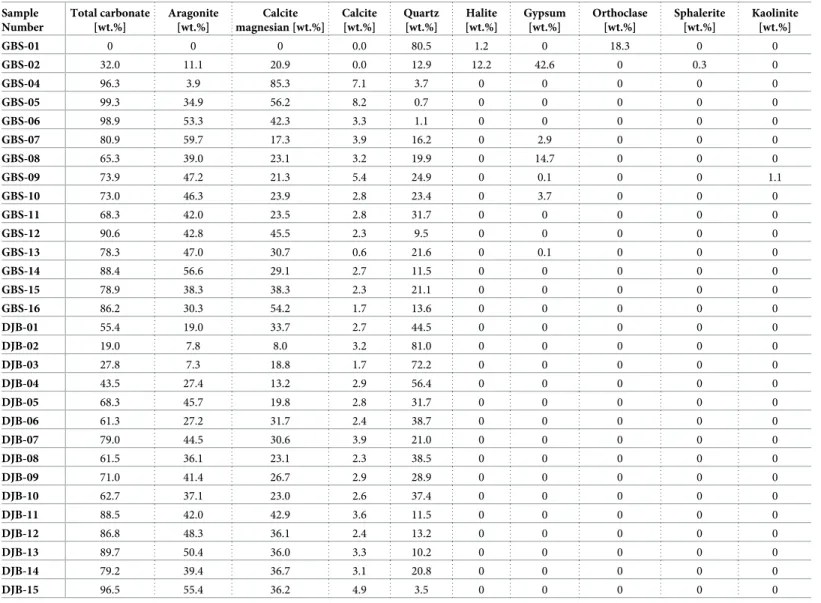
GBS-02. The total hydrogen content in samples from the Gabes transect is clearly higher than in the Table 3. Mineralogical composition of surface sediment from Gabes and Djerba transects.
Sample Number Total carbonate [wt.%] Aragonite [wt.%] Calcite magnesian [wt.%] Calcite [wt.%] Quartz [wt.%] Halite [wt.%] Gypsum [wt.%] Orthoclase [wt.%] Sphalerite [wt.%] Kaolinite [wt.%] GBS-01 0 0 0 0.0 80.5 1.2 0 18.3 0 0 GBS-02 32.0 11.1 20.9 0.0 12.9 12.2 42.6 0 0.3 0 GBS-04 96.3 3.9 85.3 7.1 3.7 0 0 0 0 0 GBS-05 99.3 34.9 56.2 8.2 0.7 0 0 0 0 0 GBS-06 98.9 53.3 42.3 3.3 1.1 0 0 0 0 0 GBS-07 80.9 59.7 17.3 3.9 16.2 0 2.9 0 0 0 GBS-08 65.3 39.0 23.1 3.2 19.9 0 14.7 0 0 0 GBS-09 73.9 47.2 21.3 5.4 24.9 0 0.1 0 0 1.1 GBS-10 73.0 46.3 23.9 2.8 23.4 0 3.7 0 0 0 GBS-11 68.3 42.0 23.5 2.8 31.7 0 0 0 0 0 GBS-12 90.6 42.8 45.5 2.3 9.5 0 0 0 0 0 GBS-13 78.3 47.0 30.7 0.6 21.6 0 0.1 0 0 0 GBS-14 88.4 56.6 29.1 2.7 11.5 0 0 0 0 0 GBS-15 78.9 38.3 38.3 2.3 21.1 0 0 0 0 0 GBS-16 86.2 30.3 54.2 1.7 13.6 0 0 0 0 0 DJB-01 55.4 19.0 33.7 2.7 44.5 0 0 0 0 0 DJB-02 19.0 7.8 8.0 3.2 81.0 0 0 0 0 0 DJB-03 27.8 7.3 18.8 1.7 72.2 0 0 0 0 0 DJB-04 43.5 27.4 13.2 2.9 56.4 0 0 0 0 0 DJB-05 68.3 45.7 19.8 2.8 31.7 0 0 0 0 0 DJB-06 61.3 27.2 31.7 2.4 38.7 0 0 0 0 0 DJB-07 79.0 44.5 30.6 3.9 21.0 0 0 0 0 0 DJB-08 61.5 36.1 23.1 2.3 38.5 0 0 0 0 0 DJB-09 71.0 41.4 26.7 2.9 28.9 0 0 0 0 0 DJB-10 62.7 37.1 23.0 2.6 37.4 0 0 0 0 0 DJB-11 88.5 42.0 42.9 3.6 11.5 0 0 0 0 0 DJB-12 86.8 48.3 36.1 2.4 13.2 0 0 0 0 0 DJB-13 89.7 50.4 36.0 3.3 10.2 0 0 0 0 0 DJB-14 79.2 39.4 36.7 3.1 20.8 0 0 0 0 0 DJB-15 96.5 55.4 36.2 4.9 3.5 0 0 0 0 0 https://doi.org/10.1371/journal.pone.0197731.t003
samples from the Djerba transect with an average of 0.47wt.% and with a maximum of 0.99 wt.% at station GBS-09 and a minimum of 0.15 wt.% at station GBS-04. Highest matrix effect
is reached in the Gabes transect samples with 0.3863 g of OM where absorbed per gram of sed-iment (Fig 7). Station GBS-05 has the lowest atomic C/N ratio of the whole Gabes transect. Atomic C/N ratio is especially high on the first two stations (GBS-01 and GBS-02) with molar ratio up to 24.7. The rest of samples from the Gabes transect (from GBS-05 to GBS-16) have molar C/N ratio slightly fluctuating from 16.3 (GBS-08) to 7.0 (GBS-15). Along the Djerba transect, only sample DJB-01 has a very high TOC content with 2.73% (Fig 3). In the remain-ing samples TOC does not exceed 0.63% (DJB-10) whereas, the average content is about 0.39
wt.%. Very low TOC contents are measured at stations DJB-02, DJB-03 and DJB-04 with
val-ues of 0.08wt.%, 0.13 wt.% and 0.11 wt.%, respectively. The HI and OI values vary from 148 to
354 mg HC/g TOC and 273 to 2369 mg CO2/g TOC. Total nitrogen content is very low for all
samples except for DJB-01 where the maximum is reached with 0.21wt.%. Indeed the TN is
Fig 6. Thin section images of carbonate nodules. (A) Dolomite nodule from station GBS-03. (B) Nodule from station GBS-03 with bioclasts (foraminifera), quartz grains embedded in micrite. (C) Nodule from station GBS-03 with coral fragments and micrite. (D) Nodule from station GBS-04 with bioclasts, quartz grains into micrite. (E) Nodule from station GBS-04 with bioclasts, quartz grains embedded in micrite.
around 0.02wt.% for the majority of sample with an average of 0.04 wt.%. The same trend is
observed for the total hydrogen content, where the maximum value is reached at sample DJB-01 with 0.53% while the average of the samples from the Djerba transect is around 0.21wt.%.
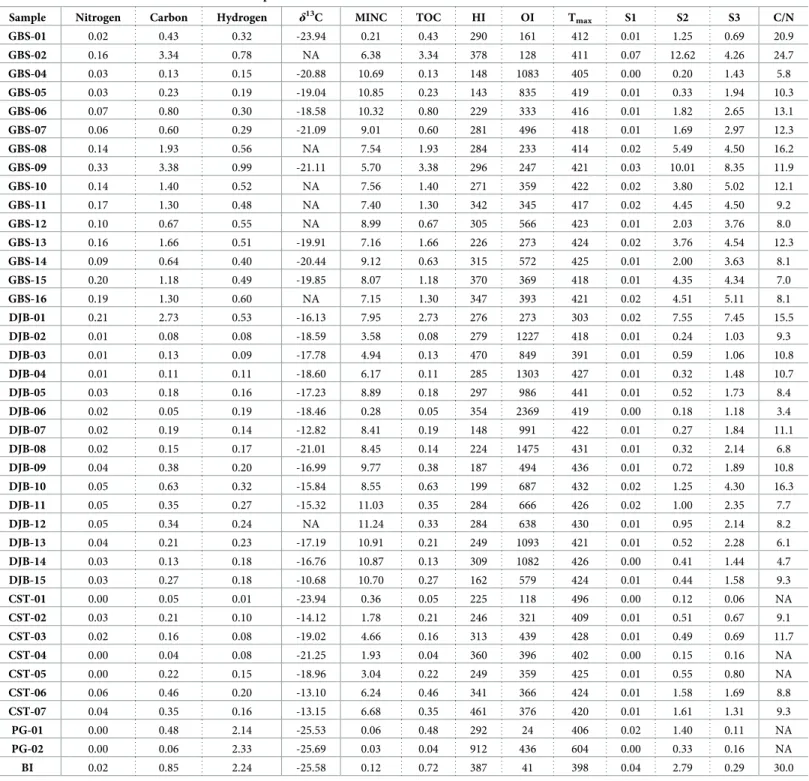
Table 4. Geochemical data of OM and elemental composition of sediment.
Sample Nitrogen Carbon Hydrogen δ13C MINC TOC HI OI Tmax S1 S2 S3 C/N
GBS-01 0.02 0.43 0.32 -23.94 0.21 0.43 290 161 412 0.01 1.25 0.69 20.9 GBS-02 0.16 3.34 0.78 NA 6.38 3.34 378 128 411 0.07 12.62 4.26 24.7 GBS-04 0.03 0.13 0.15 -20.88 10.69 0.13 148 1083 405 0.00 0.20 1.43 5.8 GBS-05 0.03 0.23 0.19 -19.04 10.85 0.23 143 835 419 0.01 0.33 1.94 10.3 GBS-06 0.07 0.80 0.30 -18.58 10.32 0.80 229 333 416 0.01 1.82 2.65 13.1 GBS-07 0.06 0.60 0.29 -21.09 9.01 0.60 281 496 418 0.01 1.69 2.97 12.3 GBS-08 0.14 1.93 0.56 NA 7.54 1.93 284 233 414 0.02 5.49 4.50 16.2 GBS-09 0.33 3.38 0.99 -21.11 5.70 3.38 296 247 421 0.03 10.01 8.35 11.9 GBS-10 0.14 1.40 0.52 NA 7.56 1.40 271 359 422 0.02 3.80 5.02 12.1 GBS-11 0.17 1.30 0.48 NA 7.40 1.30 342 345 417 0.02 4.45 4.50 9.2 GBS-12 0.10 0.67 0.55 NA 8.99 0.67 305 566 423 0.01 2.03 3.76 8.0 GBS-13 0.16 1.66 0.51 -19.91 7.16 1.66 226 273 424 0.02 3.76 4.54 12.3 GBS-14 0.09 0.64 0.40 -20.44 9.12 0.63 315 572 425 0.01 2.00 3.63 8.1 GBS-15 0.20 1.18 0.49 -19.85 8.07 1.18 370 369 418 0.01 4.35 4.34 7.0 GBS-16 0.19 1.30 0.60 NA 7.15 1.30 347 393 421 0.02 4.51 5.11 8.1 DJB-01 0.21 2.73 0.53 -16.13 7.95 2.73 276 273 303 0.02 7.55 7.45 15.5 DJB-02 0.01 0.08 0.08 -18.59 3.58 0.08 279 1227 418 0.01 0.24 1.03 9.3 DJB-03 0.01 0.13 0.09 -17.78 4.94 0.13 470 849 391 0.01 0.59 1.06 10.8 DJB-04 0.01 0.11 0.11 -18.60 6.17 0.11 285 1303 427 0.01 0.32 1.48 10.7 DJB-05 0.03 0.18 0.16 -17.23 8.89 0.18 297 986 441 0.01 0.52 1.73 8.4 DJB-06 0.02 0.05 0.19 -18.46 0.28 0.05 354 2369 419 0.00 0.18 1.18 3.4 DJB-07 0.02 0.19 0.14 -12.82 8.41 0.19 148 991 422 0.01 0.27 1.84 11.1 DJB-08 0.02 0.15 0.17 -21.01 8.45 0.14 224 1475 431 0.01 0.32 2.14 6.8 DJB-09 0.04 0.38 0.20 -16.99 9.77 0.38 187 494 436 0.01 0.72 1.89 10.8 DJB-10 0.05 0.63 0.32 -15.84 8.55 0.63 199 687 432 0.02 1.25 4.30 16.3 DJB-11 0.05 0.35 0.27 -15.32 11.03 0.35 284 666 426 0.02 1.00 2.35 7.7 DJB-12 0.05 0.34 0.24 NA 11.24 0.33 284 638 430 0.01 0.95 2.14 8.2 DJB-13 0.04 0.21 0.23 -17.19 10.91 0.21 249 1093 421 0.01 0.52 2.28 6.1 DJB-14 0.03 0.13 0.18 -16.76 10.87 0.13 309 1082 426 0.00 0.41 1.44 4.7 DJB-15 0.03 0.27 0.18 -10.68 10.70 0.27 162 579 424 0.01 0.44 1.58 9.3 CST-01 0.00 0.05 0.01 -23.94 0.36 0.05 225 118 496 0.00 0.12 0.06 NA CST-02 0.03 0.21 0.10 -14.12 1.78 0.21 246 321 409 0.01 0.51 0.67 9.1 CST-03 0.02 0.16 0.08 -19.02 4.66 0.16 313 439 428 0.01 0.49 0.69 11.7 CST-04 0.00 0.04 0.08 -21.25 1.93 0.04 360 396 402 0.00 0.15 0.16 NA CST-05 0.00 0.22 0.15 -18.96 3.04 0.22 249 359 425 0.01 0.55 0.80 NA CST-06 0.06 0.46 0.20 -13.10 6.24 0.46 341 366 424 0.01 1.58 1.69 8.8 CST-07 0.04 0.35 0.16 -13.15 6.68 0.35 461 376 420 0.01 1.61 1.31 9.3 PG-01 0.00 0.48 2.14 -25.53 0.06 0.48 292 24 406 0.02 1.40 0.11 NA PG-02 0.00 0.06 2.33 -25.69 0.03 0.04 912 436 604 0.00 0.33 0.16 NA BI 0.02 0.85 2.24 -25.58 0.12 0.72 387 41 398 0.04 2.79 0.29 30.0
Nitrogen, total carbon content and hydrogen contents (wt.%) δ13C of OM (‰), mineral carbon (MINC in %), Total Organic Carbon (TOC in %), Hydrogen Index (HI in mg HC/g TOC), Oxygen Index (OI in mg CO2/g TOC), Temperature maximum (Tmaxin˚C), S1, S2 and S2b S3 peaks (mg HC/g) and molar C/N ratio.
Matrix effect is relatively low for the sample from Djerba transect, with 0.0645 g of OM adsorbed per gram of sediment (Fig 7). Molar C/N ratios fluctuate significantly from 3.4 (DJB-06) to 16.3 (DJB-10), however most of the samples have molar ration close to 10 (DJB-02 to DJB-05; DJB-07; DJB-09; DJB-12; DJB-15). Total organic carbon in coastal samples is signifi-cantly lower than the samples from the Gabes transect but similar to the Djerba transect. It fluctuates from 0.05 to 0.35wt.% and the maximum is reached at station CST-06 with 0.46 wt.
%. The HI and OI vary from 224 to 359 mg HC/g TOC and 117 to 438 mg CO2/g TOC. Very
low TN content not exceeding 0.06wt.% characterizes coastal samples. In some stations, TN is
below the detection limit (CST-01, CST-03, and CST-05). The total hydrogen content for coastal station samples varies from 0.01 to 0.20wt.%. Matrix effect is the lower for the coastal
stations with 0.114 g of OM adsorbed per gram of sediment (Fig 7). Industrial waste TOC val-ues fluctuate from 0.04% (PG-02) to 0.72% (BI). The HI and OI valval-ues fluctuate significantly between the samples, from 292 mg HC/g TOC (PG-01) to 912 mg HC/g TOC (BI) and from Fig 7. Origin of organic matter from surface sediments in the Gulf of Gabes. (A) S2 versus TOC diagram. (B) HI versus T max diagram. (C) The three clusters based on OMδ13
C value.
23 mg CO2/g TOC (PG-01) to 436 CO2/g TOC (PG-02). Total nitrogen content is low or equal
to zero; however, waste industries are characterized by high total hydrogen content (up to 2.33%). Molar C/N ratio cannot be calculated for PG-01 and PG-02 because TN is below detec-tion limit but the sample BI has the highest ratio (30.0) of the whole sample set.
Stable carbon isotopes data of OM (δ13COM) are presented inTable 4, they vary from –25.6
to –10.7 ‰ (Fig 7). The averageδ13COMvalues of the Gabes transect samples is –20.2 ‰ with
minimum values of –23.9 ‰ and maximum values of –18.6‰. Values from samples of the Djerba transect have higherδ13COMvalues ranging between –21.0 and –10.7 ‰. Lowest values
are documented from the waste discharge site samples with values close to –25.6‰. In coastal stations, significant variations in values ofδ13C are observed. Station CST-01, located in the Gulf of Hammamet has aδ13COMof -–23.9 ‰. Within the Gulf of Gabes,δ13C values decrease
significantly close to the discharge area When at Skhira (CST-02) or at Djerba Island the
δ13
COMvalues are relatively high.
Phosphorus concentrations, proportions of the different phosphorus reservoir and molar ratios are in theTable 5. The Ptotalconcentrations fluctuate considerably from 6.51μmol P/g at
the coastal station CST-01 to 347.64μmol P/g at the station GBS-02. Concentrations are signif-icantly higher along the Gabes transect (Figs3and8), where the minimum value is reached at GBS-14 with 28.67μmol P/g. Coastal stations and Djerba transect samples have similar con-centrations with values fluctuating from 6.51μmol P/g to 20.11 μmol P/g. Only PG-01 has con-centrations reaching 58.85μmol P/g. The Pexconcentrations are exceptionally high for waste
industries with values up to 36.36μmol P/g (Fig 8). All other samples have relatively low values from 0.41μmol P/g for DJB-01 to 6.83 μmol P/g for GBS-02. Very high PFeconcentrations are
reached at station GBS-01 and GBS-02 (Fig 8) with respectively 130.7μmol P/g and 183.23 μmol P/g. Except for these two stations, PFeconcentration along the Gabes transect fluctuates
from 20.5μmol P/g (GBS-12) to 53.15 μmol P/g (GBS-09). Lower PFeconcentrations were
measured along the Djerba transect and at coastal stations with values between 2.86μmol P/g (DJB-07) and 9.31μmol P/g (CST-01). High Pauthiconcentrations were measured at station
GBS-01 (Fig 8) with 70.61μmol P/g. For the remaining samples of the Gabes transect, Pauthi
concentrations are high but range between 4.6 and 58.59μmol P/g. Pauthiconcentrations on
coastal stations are higher along the Djerba transect. The maximum Pauthiconcentration
for the Djerba transect is reached at station DJB-13 with 2.15μmol P/g whereas it reaches 5.22μmol P/g at the coastal station CST-04. The Pdetrconcentrations are extremely high at
sta-tions GBS-01 and GBS-02 with respectively 63.56μmol P/g and 57.95 μmol P/g. The remaining samples have relatively low concentrations with 0.35μmol P/g (DJB-06) to 7.65 μmol P/g (GBS-09) (Fig 3). The Porgconcentrations are very high at stations GBS-01 and GBS-02 with
11.47μmol P/g and 41.05 μmol P/g, respectively. At all other stations, the Porgconcentration
does not exceed 7.69μmol P/g. Highest Pexproportion is in sample PG-01 at the waste
dis-charge site (Fig 8) with 61.8wt.%. However, Pexproportions of coastal stations are significantly
higher (between 21.8 and 37.2wt.%) compared to the Djerba and Gabes transect samples,
where they do not exceed 5.8wt.%. Samples from the Djerba transect have the highest PFe
pro-portion (Fig 8), between 74.8 and 86.3wt.%. Gabes transect samples have relatively high
pro-portion of PFe(between 46 and 68.7wt.%) but the coastal station and samples from industrial
waste sites have the lowest PFeproportion, especially CST-01 with only 9.2wt.%. The Pauthi
proportions are especially high for coastal stations (between 31.3 and 46.2wt.%) (Fig 8). Sam-ples GBS-01 to -02, and GBS-04 to GBS-06 have significant high proportion of Pauti(>16.9wt.
%). Lowest Pauthiproportions are reached for the Djerba transect and waste industries values
do not exceed 10wt.% (Fig 8). Pdetrproportion is relatively low for the whole samples (between
1.3 and 8.8wt.%) except for GBS-01 and GBS-02 with respectively 22.5 and 16.7 wt.% (Fig 8). Highest Porgproportion is reached for sample GBS-16 with 16.2wt.%. Except for some samples
Table 5. Phosphorus reservoirs distribution in surface sediments.
Phosphorus reservoir concentration [μmol P/g] Phosphorus reservoir proportion [%]
Molar ratios Sample number Distance from the coast
(km)
Pex PFe Fe Pauthi Pdetr Porg Ptotal Pex PFe Pauthi Pdetr Porg C/P PFe/Fe Fe/PFe GBS-01 0.4 5.60 130.70 12.15 70.61 63.56 11.47 281.94 2.0 46.4 25.0 22.5 4.1 31.2 10.8 0.1 GBS-02 1.5 6.83 183.23 14.86 58.59 57.95 41.05 347.64 2.0 52.7 16.9 16.7 11.8 67.8 12.3 0.1 GBS-04 3.5 3.24 34.02 10.39 46.45 2.24 1.12 87.07 3.7 39.1 53.3 2.6 1.3 97.0 3.3 0.3 GBS-05 4.4 2.43 27.54 13.28 26.05 1.25 1.64 58.91 4.1 46.7 44.2 2.1 2.8 116.6 2.1 0.5 GBS-06 5.4 2.15 28.28 9.05 11.17 0.79 2.29 44.68 4.8 63.3 25.0 1.8 5.1 291.6 3.1 0.3 GBS-07 6.4 1.90 24.11 7.69 4.45 0.98 2.17 33.61 5.7 71.7 13.2 2.9 6.5 230.3 3.1 0.3 GBS-08 7.6 3.02 51.58 12.11 15.07 7.42 7.69 84.78 3.6 60.8 17.8 8.7 9.1 209.1 4.3 0.2 GBS-09 8.7 3.48 53.15 19.82 15.04 7.65 7.10 86.40 4.0 61.5 17.4 8.8 8.2 396.9 2.7 0.4 GBS-10 9.8 1.85 28.23 11.73 4.99 3.05 5.65 43.77 4.2 64.5 11.4 7.0 12.9 206.4 2.4 0.4 GBS-11 10.7 1.72 26.38 11.63 5.80 2.63 4.30 40.83 4.2 64.6 14.2 6.4 10.5 251.8 2.3 0.4 GBS-12 11.8 1.21 20.50 6.53 4.52 0.84 2.77 29.84 4.1 68.7 15.1 2.8 9.3 201.8 3.1 0.3 GBS-13 12.7 1.34 21.75 8.42 4.87 2.20 5.13 35.29 3.8 61.6 13.8 6.2 14.5 269.9 2.6 0.4 GBS-14 13.6 1.06 21.59 7.81 2.89 0.65 2.49 28.67 3.7 75.3 10.1 2.3 8.7 211.2 2.8 0.4 GBS-15 14.7 1.16 24.15 11.92 4.60 1.59 5.68 37.17 3.1 65.0 12.4 4.3 15.3 173.2 2.0 0.5 GBS-16 17.3 1.32 24.45 10.90 5.19 1.89 6.37 39.20 3.4 62.4 13.2 4.8 16.2 170.2 2.2 0.4 Average (Gabes transect) - 2.55 46.64 11.22 18.69 10.31 7.13 85.32 3.8 60.3 20.2 6.7 9.1 195.0 3.9 0.3 DJB-01 0.6 0.66 18.38 6.07 1.17 0.58 2.72 23.50 2.8 78.2 5.0 2.5 11.6 837.9 3.0 0.3 DJB-02 1.7 0.41 12.18 3.22 0.30 0.46 0.77 14.12 2.9 86.3 2.1 3.3 5.4 87.1 3.8 0.3 DJB-03 2.5 0.44 11.94 3.21 0.42 0.49 0.67 13.96 3.1 85.5 3.0 3.5 4.8 161.0 3.7 0.3 DJB-04 3.5 0.48 12.29 2.99 0.46 0.37 0.77 14.36 3.3 85.6 3.2 2.6 5.3 119.8 4.1 0.2 DJB-05 4.4 0.46 13.89 3.39 0.39 0.42 0.95 16.11 2.9 86.2 2.4 2.6 5.9 158.2 4.1 0.2 DJB-06 5.1 0.75 11.95 3.22 1.17 0.35 0.90 15.12 5.0 79.0 7.7 2.3 6.0 46.2 3.7 0.3 DJB-07 6.0 0.65 13.02 2.86 0.91 0.40 0.72 15.69 4.2 83.0 5.8 2.5 4.6 220.2 4.6 0.2 DJB-08 7.1 0.51 13.66 3.19 0.58 0.42 0.86 16.03 3.2 85.3 3.6 2.6 5.3 136.3 4.3 0.2 DJB-09 8.2 0.71 16.15 4.02 1.15 0.67 1.18 19.86 3.6 81.3 5.8 3.4 5.9 268.8 4.0 0.2 DJB-10 9.1 0.69 14.81 4.89 1.38 0.44 1.26 18.58 3.7 79.7 7.4 2.4 6.8 417.0 3.0 0.3 DJB-11 10.4 1.17 14.96 4.88 2.21 0.39 1.26 19.99 5.8 74.8 11.1 2.0 6.3 231.7 3.1 0.3 DJB-12 11.1 0.95 15.91 6.25 1.56 0.39 1.24 20.05 4.7 79.4 7.8 2.0 6.2 222.5 2.5 0.4 DJB-13 12.4 0.89 15.22 5.52 2.15 0.35 0.94 19.54 4.5 77.9 11.0 1.8 4.8 185.4 2.8 0.4 DJB-14 13.1 0.82 14.57 5.94 1.76 0.42 0.70 18.26 4.5 79.8 9.6 2.3 3.8 155.7 2.5 0.4 DJB-15 13.8 0.86 15.86 9.31 2.04 0.44 0.92 20.11 4.3 78.8 10.1 2.2 4.6 244.3 1.7 0.6 Average (Djerba transect) - 0.70 14.32 4.60 1.18 0.44 1.06 17.69 3.9 81.4 6.4 2.5 5.8 232.8 3.4 0.3 CST-01 Gulf of Hammamet 0.0 2.42 0.60 2.80 3.01 0.45 0.03 6.51 37.2 9.2 46.2 6.9 0.5 1310.3 0.2 4.7 CST-02 Gulf of Gabes 0.0 2.91 4.08 6.58 4.14 0.79 0.58 12.50 23.3 32.6 33.1 6.3 4.7 300.2 0.6 1.6 CST-03 0.0 3.31 4.73 2.23 4.52 0.78 0.21 13.55 24.4 34.9 33.4 5.8 1.6 628.9 2.1 0.5 CST-04 0.0 2.90 3.89 1.87 5.22 0.73 0.58 13.32 21.8 29.2 39.2 5.5 4.4 57.2 2.1 0.5 CST-05 0.0 3.28 5.34 4.40 4.23 0.58 0.11 13.54 24.2 39.5 31.3 4.3 0.8 1729.6 1.2 0.8 CST-06 0.0 3.26 5.18 9.00 4.64 0.74 0.28 14.10 23.1 36.7 32.9 5.2 2.0 1390.9 0.6 1.7 CST-07 0.0 3.27 4.57 2.77 4.29 0.51 0.07 12.71 25.7 35.9 33.7 4.0 0.6 3930.8 1.7 0.6 (Continued)
(GBS-02; GBS-10; GBS-11; GBS-14 and GBS-16; DJB-01) with values higher than 10wt.%, Porg
proportion is relatively low (Fig 8). Molar C/P ratio is relatively high (up to 3930.9) for coastal sta-tion samples except for CST-04 with a ratio of 57.2. Molar C/P ratio for Gabes transect, Djerba transect and waste industries samples, significantly fluctuate. Lowest C/P ratio with respectively 31.2 and 67.8 occur in samples GBS-01 and GBS-02, while highest ratio of 837.9 and 786.2 were measured for samples DJB-01 and PG-01. However, Fe/PFeratio is very low for the whole samples
set, except for the coastal stations CST-01, CST-02 and CST-06, it does not exceed 0.8. Table 5. (Continued)
Phosphorus reservoir concentration [μmol P/g] Phosphorus reservoir proportion [%]
Molar ratios Sample number Distance from the coast
(km)
Pex PFe Fe Pauthi Pdetr Porg Ptotal Pex PFe Pauthi Pdetr Porg C/P PFe/Fe Fe/PFe Average (Gulf of
Gabes)
- 3.16 4.63 4.48 4.51 0.69 0.31 13.29 23.8 34.8 33.9 5.2 2.4 1339.6 1.4 1.0
PG-01 0.0 36.36 15.33 3.21 5.90 0.75 0.51 58.85 61.8 26.0 10.0 1.3 0.9 786.2 4.8 0.2
Absolute (inμmol P/g) and relative content (in %) of: Exchangeable or loosely absorbed P (Pex); Fe-Bound P (PFe); Authigenic P (Pauthi); Detrital P (Pdetr) and Organic P
(Porg). Are also shown Fe concentration (μmol P/g) and molar C/P, PFe/Fe and Fe/PFeratios.
https://doi.org/10.1371/journal.pone.0197731.t005
Fig 8. Phosphorus content and proportion in surface sediments from the Gulf of Gabes. (A) Phosphorus concentrations along the Gabes transect with the average phosphorus reservoirs. (B) Phosphorus concentrations along the Djerba transect with the average phosphorus reservoirs. (C) Phosphorus concentrations at coastal stations and phosphogypsum and phosphorus reservoirs of coastal stations from the Gulf of Hammamet, Gulf of Gabes and from phosphogypsum.
Discussion
Signs of eutrophication in the Gulf of Gabes
Eutrophication is defined by Nixon [49] as “an increase in the rate of supply of OM to an eco-system”. Eutrophication results from a nutrient enrichment and induces an intensification of all biological activities causing changes in the ecosystems [50]. Nitrogen and phosphorus pro-foundly influence the marine environment and increase the algae productivity [51].
Smith [52] lists eutrophication effects and many of them have been observed along the Gabes transect:
▪ A decrease in water column transparency is one of the most visible eutrophication effects observed along the Gabes transect.
▪ Depletion of oxygen in the water was recorded along the Gabes transect (Table 2,Fig 2). ▪ Changes in composition of marine vascular plants. At the beginning of the 20thcentury,
the sea floor in Gulf of Gabes was almost entirely colonized byP. oceanica [40]. It was estimated that 90% of this cover disappeared around 1960 [39]. NoP. oceanica was
docu-mented along the Gabes transect contrary to the Djerba transect especially in its proximal part (Fig 5). The decline ofP. oceanica in the Gulf of Gabes is probably related to the
phosphate industries pollution [39,40,53].
▪ The decline of the coral Cladocora caspidosa in the inner part of the Gulf of Gabes during the last 30 years [28]. Presently livingC. caespitosa is found only SE of Kerkennah Islands
and NE of Djerba [54].
Another eutrophication effect observed and not mentioned by Smith [52] is the siltation of the seafloor. It has been described for the first time in 1976, only a few years after the starting of the production of phosphoric acid at Gabes [55]. Since the seventies, the seafloor has consid-erably changed: at the beginning of the eighties, the water within the first three kilometres of the waste discharge area was acidic without any algae and/or marine plants.Caulerpa prolifera
replacedP. oceanica at 3 km from the coast to offshore [19]. In 1990, Zaouali [40] noticed severe degradation. Living algae and/or aquatic plants were totally absent at the seafloor but remains ofP. oceanica rhizome were found in surface sediments. In 2014, environmental
con-ditions deteriorated and the siltation progressed. A large part of the sediments along Gabes transect became finer (Fig 9) and the fragments of dead rhizomes ofP. oceanica disappeared
(Figs4and5). In addition, the abundance of the bivalveCorbula gibba in the distal part of the
Gabes transectis indicative of siltation and points toward a polluted environment. In fact, increased abundances ofC. gibba have been reported from environments with high OM
accu-mulation, low oxygen and high turbidity [56].
Evidences of heavy contamination adjacent to the industrial waste discharge
Heavy metals contamination by phosphate industries in the Gulf of Gabes is demonstrated since several decades (e.g. [57,58]). Recent studies document a strong zinc contamination [26,27,53] here confirmed by the presence of sphalerite mineral in surface sediments (Table 3,Fig 2). Our XRD data set confirm and give supplementary evidence of heavy metal contamination. A large amount of gypsum, having the same mineralogical composition of PG [15,16]
(Table 3,Fig 2) is observed in the proximal part of the Gabes transect. Several studies have shown the heavy metals content [12,13,17,22] and the radioactive properties of PG [12,16,
soluble in seawater [60] and can liberate different pollutant compounds into the environment, which are transported by marine currents.
Low seawater pH near the waste discharge (Table 2, Figs2and3) is an additional sign of heavy pollution. Normal marine surface seawater pH is around 8.2 [61], below this value it can have a major impact on the environment, especially on calcifying organisms [62]. Our study shows a direct impact of the acid discharge on the sedimentary facies with formation of car-bonate nodules (Figs5and6). At high pH the dominant carbon species is CO32-inducing the
formation of carbonate minerals [63,64]. The increase in pH at the proximal section of the Gabes transect may be responsible for carbonate needles precipitation and formation of car-bonate nodules, starting from a nucleation point consisting of bioclasts. Nodules are highly micritic (Fig 6). The micritization process is the alteration of carbonate grains by boring algae filling the borings/holes with micritic material [65,66]. However, the micritization processes can be also the result of bacteria [67]. This hypothesis seems to be confirmed by the low atomic C/P ratio typical of microbial activity (Table 5) at the proximal part of the Gabes transect (e.g. [30,68]). The dolomitic nodule (Fig 6) could be an additional evidence of microbial activity at the proximal section of Gabes transect. Dolomite formation can occur under different condi-tions including within microbial mats [69] as bacteria can participate to primary dolomite for-mation. Modern examples are in shallow and/or intertidals such as Lagoa Vermelha (Brazil) [70] or in coastal sabkhas, e.g., of Abu Dhabi [71]. However, the interpretation of the genesis of the nodules is not straightforward: the atomic C/P ratio may not necessarily reflect micro-bial activity because of the strong influence of industrial waste discharge along the proximal section of Gabes transect. In addition, the sugar-like crystalline structure of the dolomite nod-ule (Fig 6) may also imply a primary chemical precipitation or a secondary replacement [70]. Laminated structures resulting from microbial mats are generally present in modern dolomite [70,71]. The dolomitic nodule (Fig 6) may be a fragment discharged by the phosphate indus-tries via the canal discharging the industrial waste. Dolomites from Lower Cretaceous outcrops are found in Tunisia [72] around the Gafsa basin close to the mining site [73,74].
Organic matter: Origin and pollution indicator
As food for benthic organism, the contribution and the source of the marine OM may be a key factor for biodiversity (e.g. [75]). Organic matter can also indicate an eutrophication process in marine environment due to anthropogenic activities [49]. Variations of OM input into the environment may change many chemical, physical and biological processes and have a direct impact on the fauna [76].
High OM along the Gabes transect may be a sign of eutrophication. However, since sedi-mentary OM is strongly influenced by particle size [77] the preservation of OM at Gabes may be linked to fine sediments (Fig 9). The mineralogical composition of sediments plays also a role in OM preservation. High specific surface of clay minerals allow a better adsorption of OM [78]. We detected kaolinite along the Gabes transect (Table 3) and Ben Amor et al. [79] documented high clay mineral contents in the inner part of the Gulf. Higher matrix effect would confirm a higher proportion of clay mineral in Gabes than in the other stations. Clay minerals in the sediments are generally responsible for matrix effect [42,44], however, other minerals like gypsum can induce a matrix effect even in small quantity (e.g., 10wt.%) [80]. The presence of PG along the Gabes transect (Table 3,Fig 2) has probably induced matrix effects due to the similar mineralogy properties as gypsum [15,16].
A large part of OM documented in the proximal part of the Gabes transect belongs to the industrial waste discharge. Indeed, dark industrial sludge rich in OM (Table 4) was observed around the waste discharge area (waste discharge canal, seafloor of GBS-02 and GBS-03
stations). This OM is directly related to phosphorite ore used for the phosphate treatment. Belayouni and Trichet [6] showed that the phosphorites from the Gafsa basin are relatively rich in OM [7]. During the pre-treatment, the phosphorite ore is enriched in phosphorus by several crushing and sieving steps [81]. During phosphoric acid production, all impurities (e.g., OM, heavy metals, non-dissolved minerals) are concentrated into industrial sludge and discharged into the waste canal and carried by the current to reach the seafloor at station GBS-02.
Hydrogen Index vs. Oxygen Index is generally used to determine the kerogen type and the origin of sedimentary OM, however, high OI represent a serious limitation in identifying OM origin. High OI values (Table 4) can be related to a very low TOC, which induce an adsorption of CO2[82]. In addition, high carbonate contents in sediments (Table 3) increase significantly
the OI due to the carbonate dissociation during the heating process of the Rock-Eval analysis [45]. Therefore, S2vs. TOC and HI vs. T˚maxdiagrams are used to interpret and to determine
the OM origin in the Gulf of Gabes. Both graphs (Fig 7) indicate type II kerogen (mixed marine and terrestrial origin) and reflect the complexity of the different OM source along coastal environment.
Fig 9. Grain size distribution. (A) Gabes transect. (B) Djerba transect. (C) Coastal stations.
Terrestrial sedimentary OM contribution can be possibly due to the proximity of the Gabes oasis and/or be related to the numerous wadis present along the Gulf of Gabes. However,P. oceanica which is abundant in Djerba (Figs4and5) share common characteristics with land plants, e.g., it possesses cuticles and contains a high amount of cellulose [82,83] and therefore, it may give the same kerogen signature as terrestrial OM (Fig 7). Marine OM origin is mainly due to zoo- and phytoplankton, which may also contribute to the turbidity of seawater. The large amount of OM contained in the industry waste near the industrial complex of Gabes can bias the interpretation of OM origin. Several studies [6,7,84] indicate a marine origin of the OM from the Gafsa phosphorites.
The estimation of the different marine vs. terrestrial contributions in OM is not possible with Rock-Eval. Additional information is derived from stable carbon isotope composition of OM. These analyses indicate three clusters with different OM origin: Cist1, Cist2 and Cist3
(Fig 7).
Cluster Cist1 is characterized by depletedδ13C values close to -25‰ and it groups samples
from the area of industrial discharge (sediments and industrial waste) (Fig 7). The coupling δ13
COMand molar C/N ratio clearly shows the influence and the contribution of the waste
dis-charge in the Gulf of Gabes, especially around the industrial waste disdis-charge area (Table 4,Fig 7). In particular, the isotopic signature of OM from the industrial waste (around -25‰) corre-sponds to the isotopic composition of OM from the phosphorite from the Gafsa basin (-26.5‰ to -24‰) [11]. Depletedδ13COMin the past is common, for example, marine OM
from Cretaceous rocks has typical values of -28‰ to -27‰, while modern marine sediments have values around -22‰ [85]. Other studies also indicate a worldwide depletion ofδ13C from the Palaeocene to the Eocene [86,87].
Depleted OMδ13C can be also caused by diagenesis. Freudenthal et al. [88] refer to two pro-cesses at the origin of changes in its isotopic composition. These include the preferential degra-dation of organic compound, which may cause a negative shift ofδ13C and the fractionation of stable carbon isotopes by organisms (e.g., bacteria), which degrades OM in the sediment. The very high molar C/N ratio for the industrial waste (Table 4) suggests loss in nitrogen during diagenesis (e.g., [89,90]). Total nitrogen is not obviously related to the OM but can be cap-tured by the crystal lattice of minerals present in the sedimentary rock [91]. The mineralized nitrogen is dissolved during the phosphorite treatment and not retained in the industrial waste, inducing a high C/N ratio. However, mineralized nitrogen seems low in phosporite from Gafsa because Belayouni et al. [7] noticed a high molar C/N ratio (from 25.1 to 90.5) in the humic compound.
Cluster Cist2 is characterized by intermediateδ13COMvalues between -23‰ and -18.5‰
(Fig 7). Thisδ13C signature corresponds to marine phytoplankton OM [92,93]. Generally, molar C/N ratio for plankton is between 7 and 9 [94,95], thus it is lower than the C/N ratio measured in this cluster. Therefore, a probable OM contribution from the waste discharge in the distal area of Gabes transect and coastal stations cannot be excluded. The marine phyto-planktonδ13C signature may reflect a phosphorus contamination in the Gulf of Gabes. Phos-phorus contained in PG is release directly into seawater. As a nutrient, phosPhos-phorus is a limiting factor to the primary producers [96–98] and increases phytoplankton production. Indeed, 176 phytoplankton blooms were recorded between 1995 and 2005 and represent high frequency events [99].
Cluster Cist3: Enrichedδ13COMvalues (>-18.5‰) are typical for C4 land plant [95,100]
and Rock-Eval data suggest an OM terrestrial source (Fig 7). However, the low C/N ratio in sediments does not correspond to terrestrial OM and higher plant (>12 for [94] and between 20 and 500 for [95]). The abundance ofP. oceanica meadows along the Djerba transect (Figs4
P. oceanica ranges from -19.7‰ to -10.8‰ [101–104], which corresponds to the values mea-sured for this cluster (Table 4,Fig 7). However, molar C/N ratio ofP. oceanica (27.4 in [102]) is considerably higher than the ratios of this cluster. Garcias-Bonet et al. [105] detected the presence of nitrogen-fixing symbiotic bacteria inP. oceanica roots, which could decrease the
molar C/N ratio.
Stable carbon isotope composition of sedimentary OM matter reflects three impacted areas by phosphate industries with different pollution levels delimited by the three clusters Cist1,
Cist2 and Cist3.
Phosphorus in the Gulf of Gabes: A pollutant and its implication in the
phosphorus cycle
The distribution of total phosphorus concentrations shows a similar area of pollution level delimited byδ13
C clusters (Fig 3). However, increases in Ptotalconcentrations from the coast to
the open sea along the Djerba transect (Table 5,Fig 8) indicate a much larger-scale phosphorus contamination. Previous studies indicated heavy metals contamination from Gabes to the southwestern coast of its Gulf [26] and in the Boughrara lagoon [106]. Marine currents are responsible for the heavy metal dispersion [26,106,107] as well as for the phosphorus disper-sion from Gabes to the offshore of Eastern Djerba coast.
The large amount of PG discharged into the seawater has negative impact on the phospho-rus cycle. Indeed part of the phosphophospho-rus released by PG precipitates into autigenic phosphophospho-rus (Pauthi) along the Gabes transect. High concentration and proportion of Pexin PG represent
the residual phosphorus from the phosphorite treatment by sulphuric acid. Phosphorite is mostly composed by authigenic apatite (pellets and coprolites) and biogenic apatite (sharks and rays fossil teeth) [9,11], represented by Pauth, and it is dissolved during the industrial
treat-ment. Even PFefrom phosphorite is dissolved because PFeis easily reducible [29] and ferric
oxides are soluble in sulphuric acid (e.g. [108]). Detrital apatite (Pdetr) seems relatively resistant
to the industrial treatment because high concentration of Pdetris noticed around the industrial
waste discharge (Table 5,Fig 8). An accumulation of detrital apatite released by PG occurs by gravitational segregation due to the higher specific gravity of apatite compared with other min-erals (e.g. quartz, calcite, aragonite, gypsum) [109]. Residual phosphorus in solution from the industrial treatment is adsorbed by PG and released in seawater because of high PG solubility in seawater (around 4.1 g/l) [17] and high magnesium and chloride concentration in seawater. These two abundant elements allow bringing Pexin solution by formation of MgPO4-or by
mass action displacement [29]. Even if high sedimentary Pauthiconcentration along the Gabes
transect (Fig 8) could be linked to an accumulation effect from PG discharge, an in-situ authi-genic phosphorus precipitation at the sediment-seawater interface cannot be excluded [110]. Authigenic apatite precipitation requires fluorine, calcium, magnesium, and sulphate from seawater and high phosphorus concentration in pore waters. Phosphorus is normally released in pore waters by microbial degradation of OM from the sediment. Pore waters saturated in Fe2+, PO43-and F-provide the conditions suitable for authigenic apatite precipitation [34].
However, Tunisian PG contains phosphorus (1.69wt.%), fluorine (0.55 wt.%) and iron (0.03 wt.%) [15] that can be released into the seawater through their solubility and allow further authigenic apatite precipitation.
Ferric oxyhydroxide minerals in sediments have the property to adsorb phosphorus, increase its concentration in the sediment and promote formation of Pauthi[34] along the
Gabes transect. Although, PFeconcentration is significantly higher along the Gabesthan Djerba
transects (Fig 8), the PFe/Fe ratio is similar (Table 5) and may indicate similar ferric
extremely low (Table 5) compared to other localities, such as the Labrador Sea (between 20 and 26 in [111]) or the Iberian margin (between 6 and 25 in [112]). Van der Zee et al. [112] suggest that low molar Fe/P ratio is the result of high phosphorus adsorption of poorly cry-stalline ferric oxyhydroxide mineral phases having a larger surface capacity and higher ads-orption capacity [113]. In addition, high PFeconcentration in the Gulf of Gabes compared to
the Labrador Sea and the Iberian margin [111,112] reflect a well-oxygenated environment, which increase significantly phosphorus adsorption on ferric oxyhydroxide minerals [112,
114,115].
Phosphorus reservoirs proportion along the coastal stations might reflect the phosphorus reservoirs composition of the bedrock due to important coastal erosion along Tunisian coasts [116]. The large difference in phosphorus reservoir proportion between the Gulf of Hamma-met and the Gulf of Gabes (Table 5,Fig 8) can be related to the age of the rock substratum. The southern part of the Gulf of Hammamet have mainly a Miocene-Pliocene substratum while the Gulf of Gabes and the Djerba Island the substratum is composed by Quaternary rocks [73,74]. However, formation of modern authigenic phosphorus cannot be excluded due to the large contribution of Pexand Pauth(Fig 8). Sheldon [117] have previously suggested
for-mation of authigenic phosphorus at the water-sediment interface in coastal environments. Autigenic apatite precipitation on coastal environment could be related to the high concentra-tion and high proporconcentra-tion of Pexin sediments (Fig 8). Al-Enezi et al. [118] showed a positive
correlation between the quartz and the phosphorus adsorption, however other factors such as pH and salinity may also influence phosphorus adsorption in sediments [118–120]. Authi-genic apatite precipitation can be influenced by parameters such as temperature, pH and adsorbed Mg2+ions [121]. Significant variations in seawater temperature and salinity occur-ring between winter and summer in the Gulf of Gabes [53,122,123] could induce autigenic precipitation.
Conclusions
This study presents the impact of phosphate treatment waste discharge into the marine envi-ronment in Tunisia. Different impacted areas are identified mostly based on theδ13
C signature of sedimentary OM and on the Ptotalconcentration as follows:
1. The area close to the phosphate industry complex is severely impacted by the industrial waste discharge and the environmental condition can be considered as critical. 2. The Gabes off shore is also strongly impacted by the phosphate industries.
3. The first signs of phosphorous contamination by industrial waste discharge are observed in Djerba.
The high volume of industrial waste discharge has serious consequences on the marine environment in the inner part of the Gulf of Gabes: OM and detrital apatite accumulation, acidic seawater with formation of carbonate nodules and severe eutrophication of marine envi-ronment. The large PG discharge impacts also the phosphorus cycle with a high authigenic phosphorus precipitation especially in the Gulf of Gabes.
Acknowledgments
We are especially grateful to Kamel El Kateb for the organization of the field assessment in the Gulf of Gabes. We acknowledge two anonymous reviewers for their valuable comments that help to improve considerably this manuscript.
Author Contributions
Data curation: Akram El Kateb, Andres Ru¨ggeberg.
Formal analysis: Akram El Kateb, Jorge E. Spangenberg. Funding acquisition: Silvia Spezzaferri.
Investigation: Akram El Kateb, Claudio Stalder, Christoph Neururer, Jorge E. Spangenberg. Methodology: Claudio Stalder.
Project administration: Silvia Spezzaferri. Supervision: Silvia Spezzaferri.
Validation: Silvia Spezzaferri.
Writing – original draft: Akram El Kateb.
Writing – review & editing: Claudio Stalder, Andres Ru¨ggeberg, Christoph Neururer, Jorge E. Spangenberg, Silvia Spezzaferri.
References
1. Ruttenberg KC. Reassessment of the oceanic residence time of phosphorus. Chemical Geology. 1993; 107: 405–409.
2. Fo¨llmi KB. The phosphorus cycle, phosphogenesis and marine phosphate-rich deposits. Earth-Sci-ence Reviews. 1996; 40: 55–124.
3. Ruttenberg KC, Dyhrman ST. Dissolved organic phosphorus production during simulated phytoplank-ton blooms in a coastal upwelling system. Frontiers in Microbiology. 2012; 3: 1–12.https://doi.org/10. 3389/fmicb.2012.00001
4. Cisse L, Mrabet T. World Phosphate Production: Overview and Prospects. Phosphorus Research Bul-letin. 2004; 15: 21–25.
5. Notholt AJG, Sheldon RP, Davidson DF. Phosphate deposits of the world, volume 2. Phosphate rock resources. Cambridge University Press; 2005.
6. Belayouni H, Trichet J. Hydrocarbons in phosphatized and non-phosphatized sediments from the phosphate basin of Gafsa. Organic Geochemistry. 1984; 6: 741–754.
7. Belayouni H, Slansky M, Trichet J. A study of the organic matter in Tunisian phosphates series: Rele-vance to phosphorite genesis in the Gafsa Basin (Tunisia). Organic Geochemistry. 1990; 15(1): 47–72.
8. Beji Sassi A, Sassi S. Cadmium associated with phosphate deposits in southern Tunisia. Journal of African Earth Sciences. 1999; 29 (3): 501–513.
9. Ounis A, Kocsis L, Chaabani F, Pfeifer HR. Rare earth elements and stable isotope geochemistry (δ13C andδ18O) of phosphorite deposits in the Gafsa Basin, Tunisia. Palaeogeography, Palaeoclima-tology, Palaeoecology. 2008; 268: 1–18.
10. Kocsis L, Ounis A, Chaabani F, Neili MS. Paleoenvironmental conditions and strontium isotope stratig-raphy in the Paleogene Gafsa Basin (Tunisia) deduced from geochemical analyses of phosphatic fos-sils. International Journal of Earth Sciences (GR Geologische Rundschau). 2013; 102: 1111–1129.
11. Kocsis L, Ounis A, Baumgartner C, Pirkenseer C, Harding IC, Adatte T et al. Paleocene–Eocene palaeoenvironmental conditions of the main phosphorite deposits (Chouabine Formation) in the Gafsa Basin, Tunisia. Journal of African Earth Sciences. 2014; 100: 586–597.
12. Rutherford PM, Dudas MJ, Samek RA. Environmental impacts of phosphogypsum. The Science of the Total Environment. 1994; 149: 1–38.
13. Zairi M, Rouis MJ. Impacts environnementaux du stockage du phosphogypseàSfax (Tunisie). Bulletin des laboratoires des Ponts et Chausse´es. 1999; 219: 29–40.
14. Pe´rez-Lo´pez R, A´ lvarez-Valero M, Nieto JM. Changes in mobility of toxic elements during the produc-tion of phosphoric acid in the fertilizer industry of Huelva (SW Spain) and environmental impact of phosphogypsum wastes. Journal of Hazardous Materials. 2007; 148: 745–750.https://doi.org/10. 1016/j.jhazmat.2007.06.068PMID:17683858
15. Ajam L, Ben Ouezdou M, Sfar Felfoul H, El Mensi R. Characterization of the Tunisian phosphogypsum and its valorization in clay bricks. Construction and Building Materials. 2009; 23: 3240–3247.