HAL Id: hal-01860821
https://hal.archives-ouvertes.fr/hal-01860821
Submitted on 23 Aug 2018HAL is a multi-disciplinary open access archive for the deposit and dissemination of sci-entific research documents, whether they are pub-lished or not. The documents may come from teaching and research institutions in France or abroad, or from public or private research centers.
L’archive ouverte pluridisciplinaire HAL, est destinée au dépôt et à la diffusion de documents scientifiques de niveau recherche, publiés ou non, émanant des établissements d’enseignement et de recherche français ou étrangers, des laboratoires publics ou privés.
Speech Recognition Experiment in ’Natural Quiet’
Background Noise
Julien Meyer, Fanny Meunier, Laure Dentel
To cite this version:
Julien Meyer, Fanny Meunier, Laure Dentel. Speech Recognition Experiment in ’Natural Quiet’ Background Noise. International Congress of Phonetic Sciences, Aug 2015, Glasgow, United Kingdom. �hal-01860821�
Speech Recognition Experiment in ‘Natural Quiet’ Background Noise
Julien Meyer¹, Fanny Meunier¹, Laure Dentel²¹Laboratoire sur le Langage, le Cerveau et la Cognition (CNRS UMR5304), Lyon, France ²Engenharia Elétrica, Universidade Federal do Pará (UFPA), Belém, Pará, Brazil
ABSTRACT
Listening abilities in humans have developed in rural environments which are the dominant setting for the vast majority of human evolution. Hence, the natural acoustic constraints present in such ecological soundscapes are important to take into account in order to study human speech. Here, we measured the impact of basic properties of a typical ‘natural quiet’ and non reverberant soundscape on speech recognition. A behavioural experiment was implemented to analyze the intelligibility loss in spoken word lists with variations of Signal-to-Noise Ratio corresponding to different speaker-to-listener distances in a typical low-level natural background noise recorded in a plain dirt open field. To highlight clearly the impact of such noise on recognition in spite of its low level, we contrasted the ‘noise + distance’ condition with a ‘distance only’ condition. The recognition performance for vowels and consonants and for different classes of consonants is also analyzed.
Keywords: Word recognition, Vowel/Consonant recognition, Background noise, Distant Speech.
1. INTRODUCTION
Background noise is ubiquitous in natural environments. It represents one of the principal perturbations that constituted the acoustic background of spoken communication over human history. The emergence and the evolution of the adaptive listening abilities in humans have developed under the constant influence and pressure of such acoustic perturbations. However, few systematic studies deal with the impact of a natural acoustic background on speech [1]. One difficulty explaining this situation is that natural rural sound environments are known to be rather variable. They depend on the geographical situation, the terrain, the vegetation, meteorological circumstances, but also bio-noises such as animal calls (biophony) and hydro-noises such as rivers or sea rumble (geophony). However, background noises in natural rural environments have common underlying basic properties that are well represented by the noise that remains when no geophony, no biophony and no anthropophony (human-made noise) interfere in the foreground with the quiet murmur of the
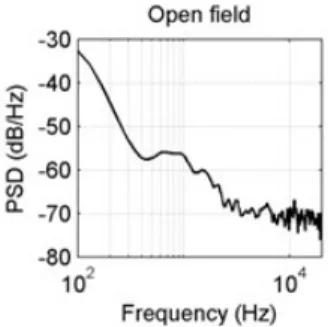
background. This type of underlying background noise is called “natural quiet” in soundscape ecology studies. It is characterized by a non uniform distribution of noisy frequencies that reflects the most regular noisy constraints encountered outdoors. An optimal natural quiet is generally found at night, when the power of sounds is low (often approximately 30 to 35 dB). In forests, natural quiet is rare during the day because of the activity of birds and insects. In temperate climates, its presence depends greatly on the season. A first important characteristic of such a typical “natural quiet” background noise is that it emphasizes low-frequency content. This is a general trend in every ecological milieu because low frequencies travel farther and are less attenuated by obstacles [1]. A second important aspect is that power levels decrease rapidly as a function of increasing frequencies (Fig. 1). In the higher frequency domain of voiced speech (i.e. above 1 kHz), a “natural quiet” noise is weak, so the signal-to-noise ratio of a spoken signal in natural ecological conditions impacts less high frequencies than low frequencies.
Figure 1: Long term spectrum of a typical natural quiet
background noise.
To date, most of the speech in noise studies concerning the influence of outdoor natural environment on spoken communication have focused on the human ability to estimate the distance of the speaker [2, 3] or to tacitly adjust vocal output to compensate for intensity losses due to sound propagation over distance, known as the Lombard effect [4, 5]. Here, our study focuses on speech recognition in a natural non reverberant soundscape. It replicates the only study existing so far on speech
recognition in natural background noise [1], with a different protocol (two parallel conditions instead of one, signal to noise ratios are measured at different intervals), a different pool of participants and a different protocol of analysis.
We evaluated the ability of normal-hearing individuals to recognize words at variable distances in a typical ‘natural quiet’ background noise recorded in a plain non reverberant grass field (Fig. 1). Due to very low indexes of reverberation in this middle they were assumed to be negligible and the effect of distance was simply simulated by spherical amplitude attenuation, basically changing the Signal to Noise Ratio. Additionally, we calculated the participants’ performances on vowels and consonants recognition.
2. METHODS
The primary objective of this experiment was to quantify the intelligibility loss due to amplitude attenuation alone (condition 1) and to amplitude attenuation + a typical ‘natural quiet’ background noise (condition 2). We evaluated the ability of native French participants to recognize French monosyllabic words (spoken at 65.3 dB(A), reference at 1 meter) at distances between 13 to 33 meters, which corresponded in condition 2 to the SNRs (-10.3 dB to -18.4 dB) most revealing of the progressive effect of the selected natural noise (noise at 41.6 dB(A)).
2.1. Participants
The 13 participants of the experiments were 18 to 30 year old French native speakers. Their normal hearing thresholds were tested by audiogram. All participants provided informed consent for the study.
2.2. Background noise
Recording precautions controlling geophony, biophony and anthropophony and meteorological conditions (wind, temperature, hygrometry) enabled us to capture a reasonably stable background noise (standard deviation of 1.2 dB) during quiet conditions (mean value of 41.6 dB (A)). This ambient noise was representative of the type of diurnal background noise of rural isolated middles, with quiet weather and no sonorous animal near the recorder. Acoustically, this type of natural background noise is characterized by high energy levels in lower frequencies of the voice spectrum (below 300 Hz), intermediate levels from 300 to 2000 Hz and lower levels above the 2 kHz range (see Fig. 2 for the noise selected for the present experiment).
Figure 2: Long-term spectrum of the interfering
natural background noise (solid line), of the voice at 13 m (dashed line) and at 33 m (dotted line).
2.3. Stimuli
In total, 19 lists were built and recorded in a sound-proof box by a masculine speaker trained to this task (mean level of emission of words at 65.3 dB(A)). Each list contained 17 words. These words were French common nouns regularly used in the current vocabulary. They were mostly monosyllabic words of CVC and CCV structure, and few - less than 5% - were words of CVV and VVC syllabic structure.
Moreover, all the lists were balanced (ps>.1) in terms of frequency of word occurrence in the French language, number of phonological neighbours, number of phonemes by word, duration of pronunciation of each word, alternation between vowels and consonants, gender of the nouns (more detail on the way lists were balanced is available in [1], an experiment employing the same stimuli)
Each list was organized on a single audio track where each word was separated from the following by 3 seconds of silence. All these tracks were calibrated with the same root mean square energy level. From these original audio tracks we built new audio files by applying the amplitude attenuation due to distance and the masking effect of the background noise.
The SNR levels corresponding to each distance were estimated by calculating the sound power levels of all lists played at each distance (we concatenated words without silent pauses between them and applied the Welch’s method [6, 7]) and by subtracting from these values the sound power levels of the long-term frequency spectrum of the selected noise (cf. Table 1, the standard deviation on word SNRs was equal to 1.88 dB for each distance (balanced lists for this parameter)).
Table 1: Levels of words, SNR of words, vowels
and consonants as a function of distance ( mean value of 65.3 dB(A) for words at 1 meter from the source, natural background noise produced at 41.6 dB(A)). Dist. (m) Levels Words (dB(A)) SNR Words (dB) SNR vowels (dB) SNR Cons. (dB) 13 43 -10.3 -4.3 -17.3 17 40.7 -12.6 -6.7 -19.6 21 38.9 -14.4 -8.5 -21.5 25 37.5 -15.9 -10 -23 29 36 -17.2 -11.3 -24.3 33 34.9 -18.4 -12.4 -25.4
2.4. Design and procedure
Each participant was asked to follow the test played on specialized software through headphones, in diotic listening (Beyerdynamic DT48). The participants had the simple task to listen to each stimulus and to try to recognize the target word, in an open response format. The participants did not receive any feedback on their performance. They were allowed to answer with partial sequences or even not to answer.
After a training phase of 5 words to ensure that they had understood the task, the test phase began with a first list of 17 words in a definite configuration of distance and presence/absence of noise. The process began at the distance of 13 meters and was repeated every 4 meters until 33 meters. For each participant, each distance was tested once with a list degraded by the sole amplitude attenuation and once with a list masked by the combined effect of the background noise and the amplitude attenuation.
3. RESULTS
3.1. Word recognition
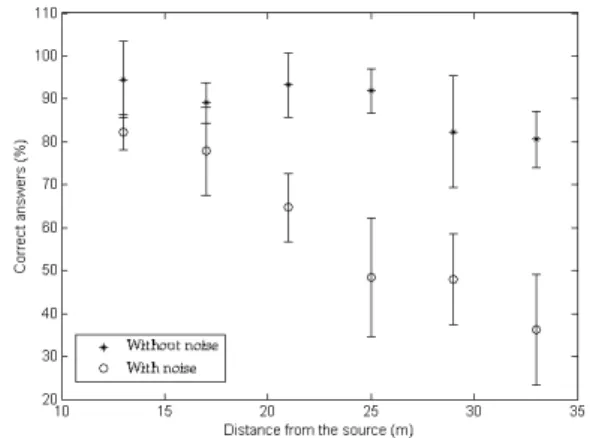
In the ‘noise + distance’ condition (condition 2), the word recognition performance for all participants decreased from 82.3 % at 13 meters to 36.2 % at 33 meters (Fig. 3). On the contrary, in control conditions without noise (condition 1), the central linear part - typical of intelligibility functions - was not reached because the word recognition performance remained very high: between 96.6 % at 13 meters and 85.5 % at 33 meters (Fig. 3). At the two shortest test distances, the results in condition 1 were statistically different from the ‘noise + distance’ condition at a moderate significant level .05 threshold (13 meters: F(1,24)=20.44; p<.05; 17 meters: F(1,24)=13.11; p<.05). Moreover, for
distances of 21 meters and greater, they were highly statistically different, i.e. at a .001 threshold (F(1,24)=87.87; p<.001), which showed that the influence on speech recognition of such a typical rural background noise is not negligible and deserves a detailed study.
Figure 3: Word recognition performance of 13
participants as a function of distance in condition 1 (without noise) and condition 2 (with noise). The pattern of the intelligibility function is quasi linear (R²=.96) in condition 2.
3.2. Consonant and Vowel recognition
The mean vowel recognition performance remained very high whatever the distance and the condition of noise (Fig. 4, left). At the same time, the mean consonant recognition remained high whatever the distance for the condition ‘without noise’, but not for the condition ‘with noise’. In each case, we found a highly significant correlation between the progression of recognition performance for consonants as a function of SNR and the recognition performance for words as a function of SNR (for the condition ‘with noise’, r=.99, p=6.8e-11), whereas the correlation between the progression of recognition scores for words and vowels was much lower (for example, for the condition ‘with noise’ r=.94, p=3.8e-6).
Figure 4: Vowel and consonant recognition
performances as a function of distance (with noise vs. without noise).
All distances taken together, in the ‘with noise’ condition, we found three times more errors on consonants than on vowels, among which twelve times more confusions on consonants. These values contrast with the fact that CVC and CCV syllabic structures presented only twice as many opportunities to produce similar sounding lexical neighbours due to consonants rather than vowels. Moreover, the mean values and the standard deviation values of word recognition scores were closer for the ones of consonants than for the ones of vowels. All together, these results strongly suggest a strong relationship between consonant recognition and the identification of the lexical meaning of words.
For vowels, the results clearly show that in such noise, identity of vowels is mostly preserved. This can be explained by how a ‘natural quiet’ noise interferes with the formants of the vowels. For example, Fig. 5 shows that, even at 33 m, the formants of /i, e, a/ that are important for their identification still emerge
Figure 5: Power spectral Density of the noise and of /i, e,
a/ at 33m.
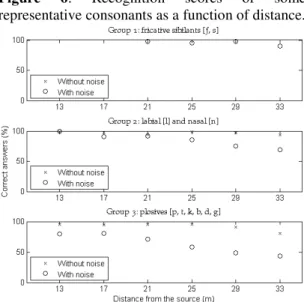
Finally, when comparing the consonant recognition scores of consonants as a function of distance we identified some patterns of results shared by different consonants having common characteristic acoustic cues.
Figure 6: Recognition scores of some representative consonants as a function of distance.
The clearest groups with the best recognition scores were as follows: (i) one group with very high recognition scores made of fricative sibilants (group 1), (ii) another group with lower recognition scores made of highly sonorant consonants (group 2) and (iii) a third group with lower scores made of plosives (group 3). These groups are exemplified in Fig. 6 with the consonants that were the most present in our corpus for each group. When examining how such consonants interfered with the noise by contrasting their power spectral density with the power spectral density of the noise we noted the constituent acoustic cues with the highest SNR where clearly different for each group (see representative examples on Fig. 7): formants for highly sonorant consonants, high frequency frication for sibilants and burst properties for plosives.
Figure 7: Power spectral Density of the noise and of /s, t,
l/ at 13m.
4. CONCLUSIONS
The present study focused on the impact of a quiet natural background noise on human speech recognition. Amplitude attenuation was used as to reveal this impact. Hence, we examined how the typical characteristics of background noises recorded in quiet conditions interfered with standard spoken speech as Signal-to-Noise Ratios decreased. We first established that the effect of distance alone (control condition 1) didn’t degrade much word, vowel and consonant recognition performance. This contrasted with the ‘with noise’ condition and provided complementary results a previous study on speech recognition in natural background noise [1].
In the ‘with noise’ condition, we found a higher stability of vowels over consonants and a high correlation between consonant recognition and word recognition performances in the kind of interfering noise we used, confirming that vowels and consonants play different roles in word processing. The high correlation we found between consonant and word recognition is often found in the literature dealing with speech recognition, but with very different protocols (for a review see [8]).
Finally, for consonants, our findings suggest, as in [1], that sonorant, sibilant and burst properties are important parameters influencing phoneme recognition.
5. ACKNOWLEDGEMENTS
The authors would like to thank the participants for their collaboration during testing. This research was financially supported by the Conselho Nacional de Desenvolvimento Cientifico e Tecnologico (Cnpq) (Pos Doutorado Junior Grant n°159747/2010-4), the European Research Council (starting-grant SpiN Project, ERC n°209234), an EURIAS Fellowship at the Collegium of Lyon and a Marie Sklodowska Curie IIF Fellowship (Project Icon-Eco-Speech). The funders had no role in study design, data collection and analysis, decision to publish, or preparation of the manuscript.
6. REFERENCES
[1] Meyer, J., Dentel, L., Meunier, F. 2013. Speech recognition in Natural Background Noise. Plos One. 8(11), 1-14.
[2] Gardner, M.B. 1969. Distance estimation of 0° or apparent 0° oriented speech signals in anechoic space”. J. Acoust. Soc. Am. 45(1), 47-53.
[3] Zahorik, P., Brungart, D.S., Bronkhorst, A.W. 2005. Auditory distance perception in humans: a summary of past and present research. Acta Acustica 91(1), 409-420.
[4] Zahorik, P. and Kelly, J.W. 2007 Accurate vocal compensation for sound intensity loss with increasing distance in natural environments. J. Acoust. Soc. Am. 122 (5), EL143-EL150.
[5] Michael, D.D., Siegel, G.M., Pick, H.L. Jr. 1995. Effects of distance on vocal intensity. J. Speech
Hear. Res. 38, 1176–1183.
[6] Welch, P.D. 1967. The Use of Fast Fourier Transform for the Estimation of Power Spectra: A Method Based on Time Averaging Over Short, Modified Periodograms. IEEE Trans. Audio Electroacoustics, 15, 70-73.
[7] Harris, F.H. 1978. On the use of windows for harmonic analysis with the discrete fourier transform” Proc. IEEE, 66, 51-83.
[8] Fogerty, D., Humes, L.E. 2010. Perceptual contributions to monosyllabic word intelligibility: segmental, lexical, and noise replacement factors. J.