CARTILAGE RESPONSE TO IN VITRO MODELS OF INJURY IN COMBINATION WITH GROWTH FACTOR AND ANTIOXIDANT TREATMENTS
Cameron A Wheeler
S.B. Mechanical Engineering, MIT, 2003 S.M. Biological Engineering, MIT, 2007
Submitted to the Department of Biological Engineering in Partial Fulfillment of the Requirements for the Degree of
Doctor of Philosophy in Biological Engineering at the
Massachusetts Institute of Technology December 2007
© 2007 Massachusetts Institute of Technology All Right Reserved
The author hereby grants MIT permission to reproduce and to distribute publicly paper and electronic copies of this thesis document in whole or in part.
Signature of Author ,_,
/
--/1
" ~( - - Cameron A Wheeler/?/7 Department of Biological Engineering
Certified by
~4 an J/Grodzinsky, Thesis Advisor Professor of Mechanica, Electric, and Biological Engineering
Accepted by ,
Ram Sasisekharan, Graduate Program Co-Chairman Professor of Biological Engineering MAS- HUET. t4T.T
MASSACHUS-TTS IN, 1011
OF TEOHNOLOGY7RCHNES
V
I
JAN L2 U•
LIBRARIES
Thesis Committee:
Alan J. Grodzinsky ...Professor of Biological, Electrical, and Mechanical Engineering Massachusetts Institute of Technology
Roger D. Kamm ... Professor of Biological and Mechanical Engineering Massachusetts Institute of Technology
Christopher Evans ... ... Professor of Orthopedic Surgery Brigham and Women's Hospital, Harvard Medical School
Abstract
Approximately one in five Americans is affected by arthritis, making it one of the most prevalent diseases and the leading cause of disability in the United States. Post-traumatic arthritis occurs after joint injury (e.g., ACL rupture or intraarticular fracture) and makes up a substantial proportion of the population with arthritis. In previous clinical studies, patients suffering from a traumatic joint injury have shown an increased risk in osteoarthritis (OA), independent of surgical intervention to stabilize the joint. Thus, the early events post-injury have an important effect on tissue within the joint in the long term. To understand the processes involved in the onset of OA and factors leading to OA post-traumatic injury, in vitro models have been developed to isolate components of the complex processes occurring in vivo. While in
vitro models do not mimic true physiologic conditions in vivo, by isolating the effects of
mechanical compression, cytokine treatment, and cartilage co-cultured with adjacent tissue, in
vitro models can give insight into key biological and mechanical pathways occurring in vivo.
This study focuses on changes in cartilage gene and protein expression and associated cartilage matrix degradation in response to static or injurious compression of the tissue in the presence or absence of cytokines including TNF-a and IL-6. In addition, normal or injuriously compressed cartilage explants were co-cultured with injured (excised) joint capsule tissue, another in vitro model of post-traumatic cellular behavior. Both young bovine cartilage and human cartilage from a wide range of ages were used. The growth factors insulin-like growth factor-1 (IGF-1) and Osteogenic protein-i (OP-1), as well as the antioxidant, superoxide dismutase mimetic (SODm), were tested to examine if they had the capability to abrogate the negative effects of these injury models. Taking a systems approach, the effects of these stimuli on expression of over 48 genes (in cartilage as well as joint capsule) were quantified, along with measures of chondrocyte viability, biosynthesis, protein expression, and GAG loss.
Chondrocyte gene expression was differentially regulated by 50% static compression or IGF- 1 treatment or the combination of compression and IGF- 1. Results showed that IGF- 1 stimulated aggrecan biosynthesis in a transcriptionally regulated manner, whereas compression inhibited aggrecan synthesis in a manner not regulated by transcriptional activity. The injury plus co-culture model was examined in detail, and OP-1 and IGF-1 were unable to rescue changes in transcriptional expressions due to injury. However, these growth factors were able to rescue cells from apoptosis, and slightly increase biosynthesis rates. Human tissue was used to further validate the model of mechanical injury (INJ) combined with co-culture (Co).
Immunohistochemical analysis of human cartilage explants after INJ+Co treatment revealed changes in versican and aggrecan protein expression, as well as changes in surface tissue
morphology, that mimicked certain changes observed in human osteochondral plugs taken from patients at the time of notchplasty surgery (post ACL reconstruction) at 1, 3, or 57 months post-ACL rupture.
The oxidative stress involved in a cytokine plus injury model showed that SODm had no ability to selectively diminish protease transcriptional activity. Cartilage treated with this
antioxidant showed significant increases in GAG loss to the medium, but diminished levels of chondrocyte apoptosis. Taken together, this work supports further investigation of the
mechanisms of action of OP-1, IGF-1, and SODm in order to elucidate their possible therapeutic value, and demonstrates the usefulness of these complementary in vitro models of cartilage injury.
Acknowledgements
I want to thank my advisor, Alan Grodzinsky for all the help he has given me in editing and guiding my research. His open personality and approach to research has given me an
opportunity to explore my ideas and concentrate on my scientific interests. My thesis committee, Roger and Chris, have given me useful suggestions as well as important question that have shaped my work. I am extremely grateful for the open environment which exists in Al's group and the interactions I've been able to have with amazing members of the lab. In particular, Jon Fitzgerald, Mike DiMicco, and Jenny Lee guided my thinking and training, and were always available for all my questions. They gave me directly or indirectly a framework for thinking about research which enabled me to develop my own ideas and understand the tools and techniques to explore those ideas. Jon particularly was always patient in the teaching process which was invaluable. I also would like to thank the current members of the group, Sangwon, Bobae, Rachel, Diana, Shuodan, Paul, Detlef, Eric, Yi, and Sui-Yi for their contribution to wonderful working environment. A special thank you is also in order for the constants in the lab equation, Han-Hwa, Linda, and Elliot. All I have relied on to accomplish things I could not do myself, and am grateful for their approachability. Lastly, I want to thank my family, who have always supported me these past four years, and who are my biggest fans. I cherish those
relationships and am grateful that they will always be with me. The past four years have been an amazing time for my own development both personally and scientifically, and I am humbled and grateful for those opportunities.
Table of Contents
CHAPTER 1 MECHANOBIOLOGY: INTRODUCTION, BACKGROUND, AND
SIG NIFICAN CE ... ... 14
1.1 PURPOSE OF THE CHAPTER ... ... 15
1.2 INTRODUCTION ... .. ... 16
1.3 SYSTEMS FOR STUDYING CHONDROCYTE MECHANOTRANSDUCTION ... 16
1.4 CHONDROCYTE BIOSYNTHESIS AND GENE EXPRESSION ... .. 17
1.5 U PSTREAM SIGNALING ... 19
1.6 PRO-INFLAMMATORY PATHWAYS IN NORMAL AND INJURIOUS COMPRESSION ... 22
1.7 SYSTEMS BIOLOGY APPROACHES ... ... 25
1.8 C O NCLU SIO N ... .... ... 27
1.9 REFERENCES AND RECOMMENDED READING ... ... 28
CHAPTER 2 CURRENT IN VITRO INJURY MODELS ... 35
2 .1 IN TR O D U C TIO N ... ... 36
2.2 M ODELS OF M ECHANICAL INJURY... 37
2.3 CYTOKINE TREATMENT MODELS OF INJURY ... ... 39
2.4 SYNOVIUM-JOINT CAPSULE CO-CULTURE MODELS OF INJURY ... 40
2.5 COMBINATION MODELS OF INJURY ... 41
2.6 CONCLUSION . ... ... ... 43
2.7 REFERENCES ... ... ... 44
CHAPTER 3 TRANSCRIPTIONAL EFFECTS OF COMBINED MECHANICAL COMPRESSION AND IGF-1 STIMULATION ON BOVINE CARTILAGE EXPLANTS ... 49 3.1 A BSTR ACT ... ... ... ... 50 3.2 INTRO DU CTIO N ... ... ... ... ... 52 3 .3 M ETH O D S ... 5 5 3.4 RESULTS ... ... ... ... 59 3 .5 D ISC U SSIO N ... .. .. ... ... ... 6 7 3.6 CONCLUSION. ... ... 74 3.7 R EFEREN CES ... ... ... 76 3.8 A PPEN D IX ... ... ... 79
Appendix 3.8.1- Gene Expression relative to Control ... 79
Appendix 3.8.2- The Effects of IGF-1 on Gene Expression... 81
CHAPTER 4 INFLUENCE OF OP-1 AND IGF-1 ON CARTILAGE SUBJECTED TO COMBINED MECHANICAL INJURY AND CO-CULTURE WITH JOINT CAPSULE 83 4.1 INTRODUCTION ... ... 84
4.2 M ATERIALS AND M ETHODS. ... ... ... .... ... ... 87
4.3 RESULTS ... .. ... ... ... . ... ... ... ... 93
4.4 DISCUSSION ... ... ... . ... ... 119
4.6 R EFERENCES ... 129
4.7 A PPENDIX OF FIGURES ... ... 136
4. 7.1 Short Term Gene Expression ... 136
4.7.2 Effects of GF Treatment- Short Term Gene Expression ... 141
4.7.3 Joint Capsule Gene Expression ... ... 147
4.7.4 Longer Term Gene Expression ... 151
4.7.5 Effects of GF Treatment- Longer Term Gene Expression ... 157
CHAPTER 5 HUMAN TISSUE RESPONSE TO MECHANICAL INJURY AND CO-CULTURE WITH EXCISED JOINT CAPSULE ... 163
5.1 INTRO D U CTIO N ... 164
5.2 MATERIALS AND METHODS... 165
5 .3 R ESU LT S ... 17 1 5.4 D ISCUSSION ... 177
5.5 CONCLUSION ... 181
5.6 R EFERENCES ... 182
5.7 A PPEND IX ... ... 185
5.7.1 Biosynthesis Data- Radiolabel incorporation ... 185
5.7.2 GAG Loss to the medium ... 188
CHAPTER 6 THE EFFECTS OF SODM ON CARTILAGE SUBJECTED TO CYTOKINE TREATMENT COMBINED WITH MECHANICAL INJURY ... 190
6 .1 IN TRO D U CTIO N ... 19 1 6.2 MATERIALS AND METHODS... 193
6.3 RESULTS ... ... 199
6.4 DISCUSSION... 206
6.5 CONCLUSION ... 210
6.6 R EFERENCES ... 2 11 6 .7 A P PEND IX ... 2 15 Appendix 6.7.1 SODm Dose Response ... 215
Appendix 6.7.2 H 202 Positive Control... 217
Appendix 6.7.3 Gene Expression 35 Cartilage Relevant Genes... 219
Appendix 6.7.4 The Effects of SODm on Gene Expression... 223
CHAPTER 7 SUMMARY AND CONCLUSION ... 228
APPENDIX A: EXPERIMENTAL PROTOCOLS ... ... 233
A.
1
RNA EXTRACTION PROTOCOL- BOVINE ... 233A.2 RNA EXTRACTION PROTOCOL- HUMAN TISSUE ... 236
A.3 EXTRACTED RNA MEASUREMENTS ... 239
A.4 REVERSE TRANSCRIPTION OF RNA TO CDNA ... 240
A.5 STANDARD CURVE MEASUREMENTS FOR QPCR PRIMERS ... 241
A.6 FINDING/DESIGNING PRIMERS FOR QPCR ... 242
A .7 PRIM ER INVENTORY ... ... 243
A.8 BOVINE DNA STANDARD AND ASSAY USING HOECHST 33258 DYE... 244
A.9 GAG STANDARD AND THE GAG ASSAY WITH MAXY MACHINE ... 246
A. 11 RADIOLABEL SCINTILLATION COUNTING USING MICROBETA PLATE READER ... 250
APPENDIX B: NITRIC OXIDE PROJECT... ... 252
INTRODUCTION ... ... ... .... ... ... 254
M E T H O D S ... ... 2 5 6
R E SU L T S ... ... .. .. .. ... ... 2 6 0 R EFERENCES ... ... .. ... ... 269
List of Figures
Figure 1.1: Schematic of physical forces and flows occurring during mechanical loading of
cartilage in vivo, that can be stimulated in vitro by means of (a) static compression, (b) dynamic compression, and (c) dynamic tissue shear ... 18
Figure 1.2 : Loading of cartilage explants (a), or direct mechanical stimulation of cells (b) can
produce mechanical stimuli that may be sensed by the cell and its pericellular microenvironment (b). These mechanical stimuli may alter the rate of synthesis as well as the molecular structure of ECM molecules such as aggrecan (c) which, in turn, could ultimately affect tissue-level
biomechanical properties in a feedback fashion (a). New cell-level and molecular-level measurement techniques, such as those based on atomic force microscopy, are being used to quantify the molecular mechanical properties of ECM macromolecules (d) as well as cellular m echanical properties (b)... . . ... ... ... 25
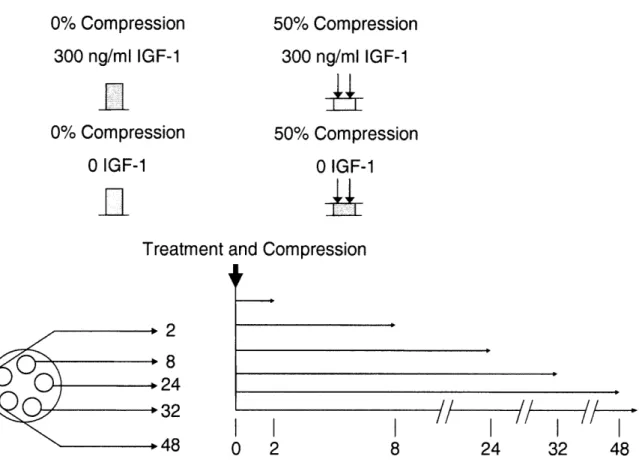
Figure 3.1. A schematic of the four conditions measured. 5 plugs were punched for each time
point and matched for time. IGF-1 treatment and static compression were applied at time 0, and plugs were flash frozen at 2, 8, 24, 32, and 48 hours... .... ... 56
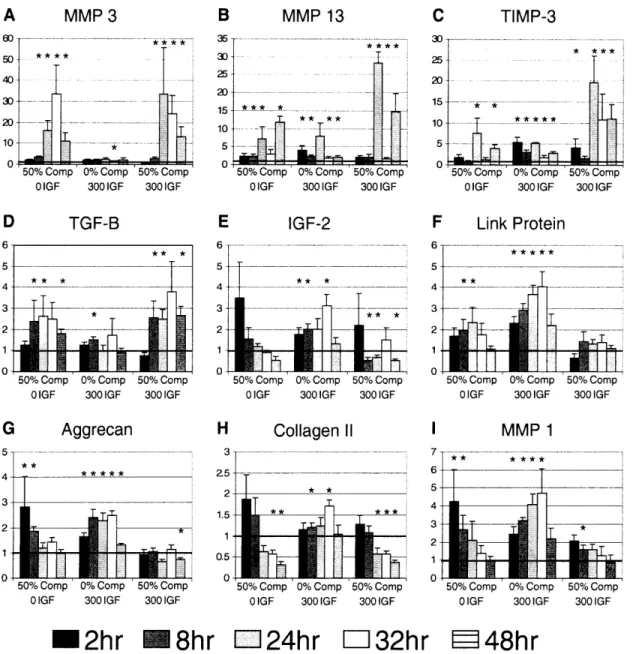
Figure 3.2. Gene expression of proteinases, growth factors, and ECM molecules. 8 cartilage
disks were pooled for each time point for each experiment. All genes were normalized to 18s and plotted relative to 0% compression 0 IGF-1. Significance was measured by the Wilcoxon sign ranked test compared to 0% compression 0 IGF-1 (* p-value <0.07). Mean ± SE (n=4) ... 60
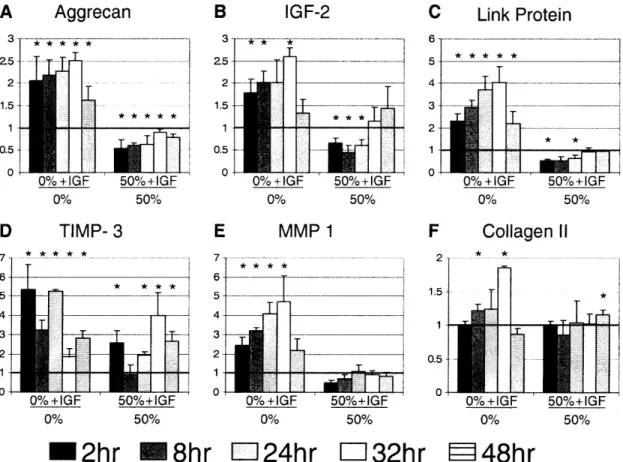
Figure 3.3. Effects of IGF-1. Gene expression was plotted normalized to like loading condition
in order to elucidate the effects of IGF-1 under compression or non-compression. Aggrecan (A) and Link (C) respond to IGF-1 in a compression dependent manner, while TIMP-3 (D) and Collagen II (F) respond to IGF-1 in a compression independent manner. Significance was measured by the Wilcoxon sign ranked test compared to like compression 0 IGF-1. (* p-value <0.07). M ean + SE (n=4) ... 63
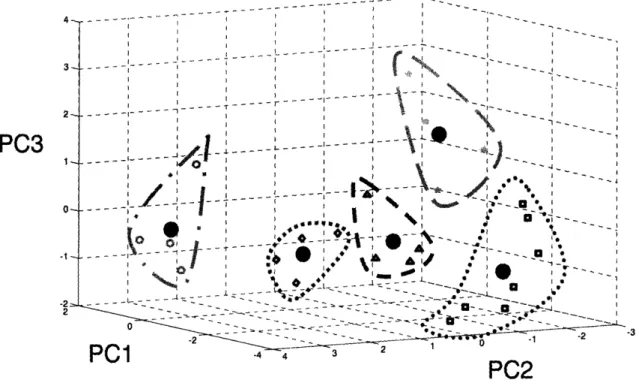
Figure 3.4 Standardized gene expression visualized in principle component space. Principle
component 1, 2, and 3 represent 80% of the variance in the data. Genes were allocated to one of five distinct groups by way of k-means clustering. Large solid black circles denote the centroid of the corresponding group. ... ... ... 65 Figure 3.5 Five expression profiles represent the combination of 0% compression 300 ng/ml of
IGF-1, 50% compression 0 ng/ml of IGF-1, and 50% compression 300 ng/ml of IGF-1. Centroid profiles were calculated through the average projection coordinates of genes in each group, and transformed from principle component space through use of the calculated principle components. Mean ± SE (n varies based on group component number) ... ... 67
Figure 3.6 Aggrecan Protein Synthesis compared to Aggrecan Gene Expression. (A) Aggrecan
protein synthesis as measured by 35S radiolabel incorporation normalized to 0% compression 0 IGF-1 adapted from Bonassar et al [5]. Mean plotted. (B) Aggrecan gene expression
normalized to 18s and plotted relative to 0% compression 0 IGF-1. Significance was measured
by the Wilcoxon sign ranked test compared to like compression 0 IGF-1. (* p-value <0.07) .... 73
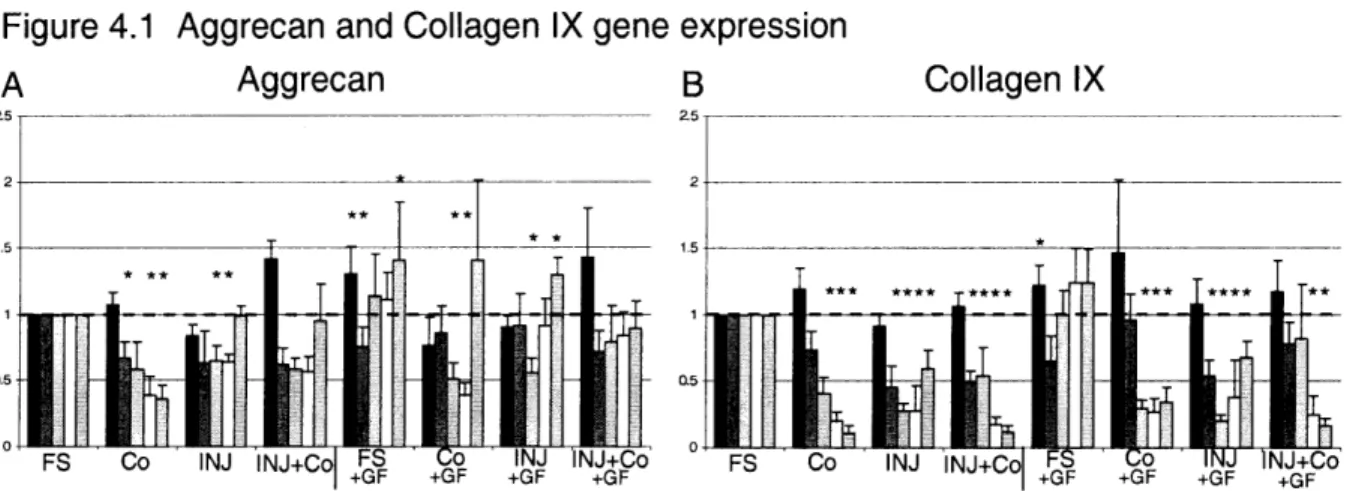
Figure 4.1 Aggrecan and Collagen type IX short-term gene expression. Data was plotted
relative to FS conditions, and stars indicate significance (p-values < 0.05) between condition and corresponding FS value. Mean ± SEM. Time points: m 2 Hrs, m 8 Hrs, 0 24 Hrs, O 48 Hrs, !f 72 Hrs ... 93 Figure 4.2 MMP-9 and TIMP-1 short-term gene expression. Data was plotted relative to FS conditions, and stars indicate significance (p-values < 0.05) between condition and
corresponding FS value. Mean ± SEM. Time points: m 2 Hrs, U 8 Hrs, E 24 Hrs,
OI
48 Hrs, Ei7 2 H rs ... 9 5
Figure 4.3 ADAMTS-1 and iNOS short-term gene expression. Data was plotted relative to FS conditions, and stars indicate significance (p-values < 0.05) between condition and
corresponding FS value. Mean ± SEM. Time points: m 2 Hrs,
m
8 Hrs,D
24 Hrs,O
48 Hrs, 172 H rs ... . ... 9 6 Figure 4.4 LIF and Caspase-3 short-term gene expression. Data was plotted relative to FS
conditions, and stars indicate significance (p-values < 0.05) between condition and
corresponding FS value. Mean ± SEM. Time points: m 2 Hrs, 1 8 Hrs, E 24 Hrs, ElO 48 Hrs, I 72 H rs ... 99 Figure 4.5 Standardized gene expression visualized in principle component space. Principle components 1, 2, and 3 represent 80% of the variance in the data. Genes were allocated to one of five distinct groups by way of k-means clustering. Large solid black circles denote the centroid
of the corresponding group. ... 100
Figure 4.6 Five expression profiles represent the combination of conditions and treatments. Centroid profiles were calculated through the average projection coordinates of genes in each group and transformed from principle component space through use of the calculated principle components. Mean ± SEM (n varies based on group component number). Time points: m 2 Hrs,
m 8 Hrs, E 24 Hrs, O 48 Hrs, E3 72 Hrs ... 102 Figure 4.7 Basal levels of gene expression for joint capsule and cartilage relative to the least
abundant gene. Proteinases are colored in red; ECM molecules are colored in blue. ... 103 Figure 4.8 Aggrecan and Fibronectin longer-term gene expression. Data was plotted relative to
FS conditions, and stars indicate significance (p-values < 0.05) between condition and
corresponding FS value. Mean ± SEM. Time points:
I
Day 2, U Day 4, 0 Day 8, O Day 16... 10 5
Figure 4.9 MMP-3 and MMP-9 longer-term gene expression. Data was plotted relative to FS conditions, and stars indicate significance (p-values < 0.05) between condition and
corresponding FS value. Mean ± SEM. Time points:
I
Day 2, N Day 4, 0 Day 8, OE Day 16Figure 4.10 TIMP-1 and c-Fos longer-term gene expression. Data was plotted relative to FS conditions, and stars indicate significance (p-values < 0.05) between condition and
corresponding FS value. Mean ± SEM. Time points:
U
Day 2, M Day 4, O Day 8,Ol
Day 16... ... ... 10 9
Figure 4.11 Standardized gene expression visualized in principle component space. Principle
components 1, 2, and 3 represent 70% of the variance in the data. Genes were allocated to one of five distinct groups by way of k-means clustering. Large solid black circles denote the centroid of the corresponding group ... 113
Figure 4.12 Five expression profiles represent the combination of conditions and treatments.
Centroid profiles were calculated through the average projection coordinates of genes in each group and transformed from principle component space through use of the calculated principle components. Mean ± SEM (n varies based on group component number). Time points:
U
Day 2, 0 Day 4, O Day 8, O Day 16... ... 114Figure 4.13 Sulfate incorporation measured over 16 days. Data was plotted relative to FS
conditions (A) and relative to the corresponding treatment (B). Stars indicate significance (p-values < 0.05) between condition and corresponding FS (A) or treatment (B) value. Mean ±
SEM. Time points: N Day 2, M Day 4,
U
Day 8, O Day 12, 9 Day 16... 116Figure 4.14 Proline incorporation measured over 16 days. Data was plotted relative to FS
conditions (A) and relative to the corresponding treatment (B). Stars indicate significance (p-values < 0.05) between condition and corresponding FS (A) or treatment (B) value. Mean ±
SEM. Time points: N Day 2, M Day 4,
U
Day 8, O Day 12, Q Day 16... 117Figure 4.15 Levels of apoptosis 8 days after loading. Percentage apoptotic cells represent the
amount of apoptotic cells divided by the total number of cells. Stars indicate significance (p-values < 0.05) between condition and FS. Bar indicates statistical difference (p-(p-values < 0.05) between the two end points. Mean ± SEM. ... 118
Figure 4.16 Levels of apoptosis 16 days after loading. Percentage apoptotic cells represent the
amount of apoptotic cells divided by the total number of cells. Stars indicate significance (p-values < 0.05) between condition and FS. Mean ± SEM ... ... ... 119
Figure 5.1 Schematic of knee joint where orange circles denote location of joint capsule excision
and white ovals denote areas of cartilage harvest ... ... 167
Figure 5.2 Biosynthesis rates of [35S]-Sulfate and [3H]-Proline 1st mm knee tissue in Human 2 (19 years). Stars represent significant difference compared to FS conditions (p-values <0.05).
... ... 1 7 1
Figure 5.3 Biosynthesis rates of [35S]-Sulfate and [3H]-Proline ankle tissue in Human 3 (19 years) . ... ... ... 172
Figure 5.4 Biosynthesis rates of [35S]-Sulfate and [3H]-Proline ankle tissue in Human 5 (74 years). Bars represent statistical significance between ends (p-value < 0.05)... 172
Figure 5.5 GAG loss to the medium in 1st mm Knee, 2nd mm Knee, and Ankle from Human 2
(19 years old). Percentage GAG loss was determined by GAG lost to the medium divided by total GAG measured (GAG lost to medium + GAG in plug). Stars represent statistical
significance compared to FS conditions (p-value < 0.05). ... 174
Figure 5.6 IHC samples stained with Anti-DPE targeting Versican expression from 1st mm and 2nd mm knee cartilage from Human 2 (19 years old). Plugs were placed in 10% formalin after 2, 6, and 16 days of treatment post treatment/injury... 176
Figure 5.7 IHC samples stained with Anti-CDAG targeting aggrecan expression from 1st mm
and 2nd mm knee cartilage from Human 2 (19 years old). Plugs were placed in 10% formalin after 2, 6, and 16 days of treatment post treatment/injury. ... 177
Figure 5.8 IHC samples stained with Anti-DPE targeting versican expression from human
cartilage tissue taken from notchplasty experiment post-ACL reconstructive surgery. Tissue was examined 0, 1, 3, and 57 months post-surgery. ... 178
Figure 5.9 IHC samples stained with Anti-CDAG targeting aggrecan expression from human
cartilage tissue taken from notchplasty experiment post-ACL reconstructive surgery. Tissue was examined 0, 1, 3, and 57 months post-surgery. ... 179
Figure 6.1 Superoxide dismutase mimetic structure, Manganese(III)tetrakis (1-methyl-4-pyridyl)
porphyrin pentachloride. ... .. ... ... .... ... ... 192
Figure 6.2 Aggrecan and collagen type II gene expression at 2, 8, 24, 48, and 72 hours after
treatment. Data was plotted relative to FS conditions, and stars indicate significance (p-values <
0.05) between condition and corresponding FS value. Mean ± SEM. ... 199
Figure 6.3 Caspase-3 and MMP-9 gene expression at 2, 8, 24, 48, and 72 hours after treatment.
Data was plotted relative to FS conditions, and stars indicate significance (p-values < 0.05) between condition and corresponding FS value. Mean ± SEM... 200
Figure 6.4 Effects of SODm treatment on aggrecan and collagen type II gene expression at 2, 8,
24, 48, and 72 hours after treatment. Data was plotted relative to corresponding loading conditions (FS or INJ), and stars indicate significance (p-values < 0.05) between SODm
treatment and corresponding loading value. Mean ± SEM... 201
Figure 6.5 Standardized gene expression visualized in principle component space. Principle
components 1, 2, and 3 represent 79% of the variance in the data. Genes were allocated to one of five distinct groups by way of k-means clustering. Large solid black circles denote the centroid of the corresponding group. ... 203
Figure 6.6 Five expression profiles represent the combination of FS + 2.5 gM SODm, INJ, and
INJ + 2.5 gM SODm. Centroid profiles were calculated through the average projection coordinates of genes in each group, and transformed from principle component space through use of the calculated principle components. Mean ± SE (n varies based on group component
num ber) ... 205
Figure 6.7 sGAG loss to the medium in free swell (FS), mechanical injury (INJ), TNF-a
treatment (TNF), and mechanical injury with TNF-a treatment (INJ+TNF) and all conditions +
2.5 gM SODm plotted relative to FS conditions. Stars indicate significance (p-values < 0.05) between condition and FS, and bar indicates significance between two conditions. Mean ± SEM.
List of Tables
Table 3.1 24 Cartilage Relevant Genes. Primers were designed Primer3 software
(www.genome.wi.mit.edu/cgi-bin/primer/primer3www.cgi). Standard dilutions were used to calculate relative mRNA copy number ... ... 57
Table 3.2 P-value of Centroid Profile Separation. P-values were obtained through student
T-test, comparing centroid to centroid Euclidean distance. Degrees of freedom were taken as the num ber of genes in each group. ... ... 64 Table 3.3 Gene clustering groupings. Resulted gene sorting according to extent and kinetics of
expression. Specific gene allocation and centroid coordinates when all data are clustered (A), 0% compression 300 ng/ml IGF-1 data clustered (B), 50% compression 0 IGF-1 data clustered (C), and 50% compression 300 ng/ml IGF-1 data clustered (D). ... ... 69
Table 4.1 List of 48 cartilage relevant genes measured by qPCR. Primer3 and Primer Express
were used to design primers. Standard dilutions were used to calculate relative mRNA copy num b er . ... . . ... 90
Table 4.2 P-value of Centroid Profile Separation. P-values were obtained through student
T-test, comparing centroid to centroid Euclidean distance. Degrees of freedom were taken as the number of genes in each group.. .... ... 122
Table 4.3 P-value of Centroid Profile Separation. P-values were obtained through student
T-test, comparing centroid to centroid Euclidean distance. Degrees of freedom were taken as the num ber of genes in each group. ... ... ... 125
Table 5.1 List of human donor information and tissue provided by Gift of Hope Organ and
T issue D onor N etw ork ... ... ... 166
Table 6.1 List of 36 cartilage relevant genes measured by qPCR. Primer3 and Primer Express
were used to design primers. Standard dilutions were used to calculate relative mRNA copy number . ... 196
Table 6.2 P-value of Centroid Profile Separation. P-values were obtained through student
T-test, comparing centroid to centroid Euclidean distance. Degrees of freedom were taken as the num ber of genes in each group. ... 208
Chapter 1
Mechanobiology: Introduction, Background, and
Significance
* This chapter has appeared as a review paper in Current Opinions in Orthopaedics (Wheeler,
Cameron A; Fitzgerald, Jonathan B; Grodzinsky, Alan Cartilage mechanobiology: the
response of chondrocytes to mechanical force. Current Opinion in Orthopedics.
1.1 Purpose of the Chapter
A comprehensive understanding of chondrocyte mechanobiology is critically important for a clear understanding of the etiopathology and treatment of osteoarthritis (OA) as well as for the long-term survival of tissue engineered implants for cartilage repair.
Recent Findings
A large body of evidence has emerged documenting the effects of various mechanical loading modalities on chondrocyte biosynthesis and gene expression. Many physical forces and flows occur in cartilage during loading in vivo. For example, dynamic compression of cartilage results in deformation of cells and the extracellular matrix, hydrostatic pressurization of the tissue fluid, pressure gradients and the accompanying flow of fluid within the tissue, and streaming potentials and currents induced by fluid convection of counter-ions through the negatively charged extracellular matrix (ECM). In addition, local changes in tissue volume caused by compression also lead to alterations in matrix water content, ECM fixed charge density, mobile ion concentrations, and osmotic pressure. Any of these mechanical and physicochemical phenomena in the micro-environment of chondrocytes may affect cellular metabolism. While specific components of certain mechanotransduction pathways have been identified, the exact mechanisms by which mechanical forces influence the biological activity of chondrocytes are not yet fully understood. New genomic and proteomic technologies and
methodologies including systems biological analyses are being applied to better understand cellular mechanotransduction.
Summary
Investigators have focused on mechano-regulation of upstream signaling and responses at the level of gene transcription, protein translation and post-translational modifications.
Intracellular pathways including those involving integrin signaling, mitogen activated protein kinases (MAPKs), and release of intracellular calcium have been confirmed in several
1.2 Introduction
Articular cartilage is an avascular, aneural, alymphatic tissue that provides a low friction weight bearing surface for joint locomotion. During joint loading in vivo, cartilage is subjected to mechanical stresses and strains that span a wide range of amplitudes and frequencies [1, 2]. Peak stresses can reach 10-20 MPa (100-200 atm) during activities such as stair climbing [3]. While compressive strains of 15% - 40% may occur in response to long-term or "static" loads within the physiological range [1], compressions of only a few percent occur during normal ambulation (e.g., the "dynamic" strains that occur at walking frequencies of -1 Hz). Chondrocytes occupy 3% to 5% of tissue volume in adult human cartilage [1]. These cells maintain a mechanically functional extra-cellular matrix (ECM) by mediating the synthesis, assembly, and degradation of proteoglycans (PGs), collagens, glycoproteins, and other matrix molecules. It is well known that chondrocytes can sense and respond to their mechanical environment; however, the
mechanotransduction pathways by which mechanical forces influence the biological activity of chondrocytes are not fully understood.
1.3 Systems for Studying Chondrocyte Mechanotransduction
Since mechanotransduction mechanisms are difficult to quantify in vivo, model systems such as cartilage explant organ culture and three dimensional chondrocyte/gel culture have been used. Cartilage explants preserve native tissue structure and cell-matrix interactions and thereby enable quantitative correlations between mechanical loading parameters and biological responses such as gene expression and biosynthesis. Muir [4] emphasized the important but complex role of the native ECM and chondrocyte-ECM interactions in chondrocyte response to load; thus, investigators [4] have cautioned that the use of isolated, plated chondrocytes that are depleted of ECM must be approached with care regarding the potential for chondrocyte dedifferentiation and the interpretation of the results in relation to the behavior of cartilage. In native tissue, however,
the coupling between mechanical, chemical, and electrical forces and flows within the ECM can complicate the identification of specific physical stimuli, necessitating specialized experimental and theoretical modeling approaches. Therefore, three-dimensional agarose [5], alginate [6], and other scaffold culture systems have also been used to study chondrocyte response to mechanical compression[7-9], hydrostatic pressure [10], stretch [ 11], physicochemical stimuli (pH and osmolarity [12], and electrical currents [13]). Finally, a variety of specialized, incubator-housed instruments have been developed to mimic mechanical stimuli found in vivo and apply
components of compression, shear, stretching, hydrostatic or osmotic pressure to explants, isolated cells, or cell-encapsulated gel constructs in vitro [14-17], shown schematically in Fig.
1.1.
1.4 Chondrocyte biosynthesis and gene expression
Static compression (Fig. 1.1a) of animal and human cartilage explants [18, 19] as well as high hydrostatic pressure applied to chondrocyte monolayers [20] can cause a dose-dependent decrease in the biosynthesis of proteoglycans, collagens, and other ECM proteins as quickly as one hour after application of compression. Complete recovery of biosynthesis can occur after release of compression, but at different rates for different ECM macromolecules [21], strongly suggesting that specific transduction pathways are involved. In contrast, dynamic compression and shear (Fig 1.1b,c) [18, 22, 23] and cyclic hydrostatic compression [20, 24] can markedly upregulate ECM biosynthesis in a manner dependent on compression amplitude and frequency [20, 22], as well as the developmental stage and the depth from the articular surface of the cartilage sample [14, 25, 26]. Tissue-level and cell-level quantitative autoradiography have been used to visualize the spatial distribution of newly-synthesized ECM molecules in response to compression and shear [23, 27, 28], and to compare with the theoretically predicted profiles of
physical stimuli, highlighting the roles of ECM and cell deformation as well as intratissue fluid flow (shown schematically in Fig. 1.1).
PHYSICAL STIMULI in Unconfined Compression
Ramp - & - Hold
Transient --
Static
Dynamic
Dynamic
W\
Compression /-
Compression
Shear
Transient effects
*hydrostatic
pressure
*fluid exudation
estreaming current
S15-30
minutes (relax)
Static effects
*Matrix
deformation
*Matrix
consolidation
(a)
Transient effects
*same,
but mild
*depends
on offset comp
Steady (dyn) effects
*Cyclic
matrix deform
*" Radially directed flow *" High pressure: center
*Enhanced
transport
(b)
Transient effects
*all
but minor
*depends
on offset
Steady (dyn) effects
*Cyclic
matrix deform
'minimal HP build up
*minimal
fluid flow
SNo
transport effect
(c)
Figure 1.1: Schematic of physical forces and flows occurring during mechanical loading of cartilage in vivo, that can be stimulated in vitro by means of (a) static compression, (b) dynamic compression, and (c) dynamic tissue shear.
Mechanical forces can also influence aggrecan gene expression [29-33] and the
transcription of many matrix proteins and proteases in chondrocytes and other connective tissue cells [33-36]. Investigators have also found thatfluid shear flow [37-40] can alter aggrecan synthesis and the expression of aggrecan, TIMP-1, IL-6 and MMP-9. The induction of MMP-9 gene expression appeared to be mediated via the JNK signaling pathway [38], and the aggrecan promoter via the ERK pathway [39]. While the fluid velocities in these experiments were much
higher than physiological for cartilage, the resulting shear stresses may be relevant. When isolated bovine and human chondrocytes were cyclically stretched on flexible membranes, aggrecan and type II collagen mRNA expression were increased [40], consistent with a role for cell deformation and membrane perturbation. Cyclic (1 Hz square wave) uniaxial stretch (5% elongation) of embryonic chick sternal chondrocytes seeded into a 3D collagen sponge induced expression of Indian hedgehog (Ihh) and also upregulated bone morphogenic proteins 2 and 4 downstream of Ihh which, in combination, stimulated cell proliferation [11 ]. Interestingly, mechanical induction of Ihh mRNA was abolished by blocking stretch activated channels [11].
1.5 Upstream Signaling
Investigators have been trying to map the sequential intracellular signaling pathways through which mechanical forces can modify the gene expression of specific molecules. Major roles have been identified for certain classical signaling pathways including those involving integrins, mitogen activated protein kinases (MAPKs), and release of intracellular calcium.
Integrin signaling pathways
Evidence suggests that integrins can convert extracellular mechanical stimuli into intracellular signals in a variety of cell types [41]. In chondrocytes, the alpha a5pl fibronectin-binding integrins have been implicated as part of a mechanotransduction complex that involves tyrosine protein kinases, cytoskeletal proteins, ion channels, and second-messenger signaling cascades [42, 43]. Researchers have also shown that the a5pl integrin complex is present in OA chondrocytes, but results in different downstream effects when activated or blocked compared to normal chondrocytes [44]. Application of hydrostatic pressure to chondrocyte monolayers in a manner that induced strain on the culture dish and plated cells caused interleukin-4 (IL-4) secretion via x51I1 integrin and subsequent intracellular calcium release followed by cell hyperpolarization [42, 45]. One possible connecting link is the N-methyl-D-aspartate (NMDA)
receptor, since integrin signaling has been shown to influence the activity of this receptor in other cells [46]. NMDA is phosphorylated by protein kinases including protein kinase C (PKC) and phosphotidylinositol 3-kinase (PI3K) [47]. Salter el al. observed that the NMDA receptor induced depolarization in OA chondrocytes and hyperpolarization in normal chondrocytes, suggesting a possible alteration in chondrocytic mechanotransduction as a consequence of the function of the NMDA receptor during OA [48].
Mitogen activated protein kinase pathways
Investigators have been trying to map the sequential intracellular signaling pathways through which mechanical forces may modify chondrocyte gene expression of specific
molecules. Several recent studies have demonstrated a role for mitogen activated protein kinases (MAPKs) [49, 50] which can alter matrix gene expression and changes in matrix production by chondrocytes within compressed cartilage and in chondrocyte monolayers [51]. This family of ubiquitous signaling molecules includes extracellular-signal regulated protein kinases (ERK1/2), c-Jun N-terminal kinase (JNK) and p38. Activated MAP kinases are thought to translocate to the nucleus, where they may induce phosphorylation of transcriptional factors and eventual
upregulation of various genes.
Fanning et al. [52] examined the effects of slow ramp-and-hold compression of cartilage explants to final static strains up to 50% that were held for a range of compression durations; these
compression conditions were found previously to inhibit chondrocyte biosynthesis but not to affect cell viability. Mechanical compression caused (1) a rapid induction of ERK1/2
phosphorylation at 10 min followed by a rapid decay, as well as a sustained level of ERK2 phosphorylation that persisted for at least 24 hrs; (2) phosphorylation of p38 in strictly a transient fashion, with maximal phosphorylation occurring at 10 min; and (3) stimulation of SEKI
phosphorylation with a maximum at the relatively delayed time point of 1hr and with a higher amplitude than ERK1/2 and p38 phosphorylation. (SEKiis an immediate upstream specific
activator of JNKs 1,2 and 3 [53], and the JNK and p38 kinases together constitute the SAPK sub-family of MAPKs [54]). Fanning et al. [50] proposed that the rapid activation of ERK1/2 and p38 may be due to the cell deformation, fluid flow and pressurization, while the SEK1 pathway was activated only under static compression without fluid flow or pressurization [50]. Thus, it was suggested that the initial transient ERK1/2 response was due to the dynamic components of static compression, consistent with the results of Li et al. [49], who found a significant
upregulation of ERK1/2 activation in response to dynamic compression. ATP and Ca2+
Ion channels have been identified as another important factor in mechanotransduction, including effects of cell stretching on chondrocyte hyperpolarization and depolarization [55]. ATP has been shown to be involved in signaling in many cell types. Under compressive conditions, bovine chondrocytes can release ATP [56, 57] which, in the extracellular space, can then bind to membrane receptors and initiate a signaling cascade including stimulation of proteoglycan synthesis [58]. While ATP can induce anabolic signaling in normal chondrocytes, OA
chondrocytes do not show upregulation of matrix production. Mechanical stimulation can also increase the concentration of intracellular calcium ions, derived either from intracellular stores or from the extracellular space and transported into the cell via stretch activated ion channels. While hyperosmotic stress can initiate intracellular Ca2+ signaling in chondrocytes [59], Erickson et al. demonstrated that the stretch activated ion channels were not necessarily
responsible for Ca2+ transients under these conditions. Cell volume was also shown to decrease under hyperosmotic stress and, hence, the stretch effect was explained by an inhomogeneity in the cell surface [59]. The role of intracellular calcium in native cartilage explants was studied by Vahlmu and Raia [60]; using blockers of intracellular Ca2+ and protein kinase C, they
demonstrated that regulation of aggrecan mRNA levels under creep compression involved Ca2+/calmodulin and myo-inositol 1,4,5-triphosphate signaling processes. Fitzgerald et al. also
found that compression of cartilage explants induces multiple time-dependent gene expression patterns that involve intracellular calcium and cyclic AMP [61].
1.6 Pro-inflammatory pathways in normal and injurious
compression
Acute traumatic joint injury increases the risk for subsequent development of OA [62]. In order to quantify the events following cartilage and joint injury, investigators have turned to a variety of in vitro and animal models. Studies have shown that threshold levels of compressive strain, strain rate, and peak stress can cause cartilage matrix disruption, tissue swelling, cell necrosis and apoptosis, and increased loss of matrix macromolecules [63-70]. As a baseline control for changes in gene expression in bovine calf cartilage explants, mRNA levels measured in non-injured free swelling tissue was found to vary over five orders of magnitude, with matrix molecules being the most highly expressed of the genes tested and cytokines, matrix
metalloproteinases (MMPs), aggrecanases (ADAMTSs), and transcription factors showing lower levels of expression [71]. While the matrix molecules showed little change in expression after injurious compression, MMP-3 increased -250-fold, ADAMTS-5 increased -40-fold, and TIMP-1 increased -12-fold over free swelling levels [66]. In addition, injurious compression results in a decrease in biosynthetic rates in the remaining viable cells, and these viable cells no
longer respond to the stimulatory effects of moderate dynamic compression seen in normal cartilage [70]. Taken together, these studies suggest that mechanical overload can cause long-term cell mediated changes in matrix quality and turnover.
Deschner et al. recently summarized the interaction between loading and inflammatory pathways
[72], which may be activated by excessive loads and inhibited by moderate cyclical loading [42,
Mechanical forces can influence production of NO [16, 74, 75], PGE2 [37], and IL-6 [76]. Interestingly, cross-talk between NO and PGE2 pro-inflammatory pathways, and between NOS2 and COX2 (upstream of NO and PGE2), can be regulated by mechanical stimuli [77]. These pathways have been traditionally associated with inflammatory cytokines such as IL-1, an initiator of cartilage degradation [42, 45, 73, 78-80]. Dynamic compression (15% strain amplitude, 1Hz, 48 hr) could inhibit NO synthesis by equine chondrocytes in agarose gel
constructs [81] ,and could inhibit NO and PGE2 release by superficial zone equine chondrocytes stimulated by IL-103 [82].
Cell microenvironment and organelle morphology
Loading of cartilage (Fig. 1.2a) produces cellular deformation [83, 84] in proportion to the local deformation of the ECM, and in a manner consistent with the depth-dependent compressive properties of the bulk tissue [85]. Deformations within the pericellular matrix (Fig. 1.2b) also affect the physicochemical microenvironment of the chondrocyte [28, 86] and may, in turn, signal the cell to modulate its biosynthetic response. Deformation-induced fluid flow in the pericellular region enhances transport of soluble factors to cell receptors, and alters the local concentration of mobile ions leading to electrochemical changes such as shifts in pH[87]. Cell-surface connections to the ECM enable pericellular deformations to be transmitted through the cell membrane to intracellular organelles via cytoskeletal elements such as actin microfilaments, microtubules, and intermediate filaments[20, 83, 88]. Compression can also dramatically affect the morphology of intracellular organelles that regulate cell biosynthesis and metabolism by
altering gene transcription, intracellular transport and trafficking, and protein translation and post-translational processing. Using chemical fixation, high-pressure freezing, and electron microscopy, Szafranski et al. [89] observed that compression of bovine cartilage explants caused a concomitant reduction in the volume of the extracellular matrix, chondrocyte, nucleus, rough endoplasmic reticulum, and mitochondria. Interestingly, however, the Golgi apparatus was able
to resist loss of intraorganelle water and retain a portion of its volume relative to the remainder of the cell. These combined results suggested the hypothesis that organelle volume changes were driven mainly by osmotic interactions while shape changes were mediated by structural factors, such as cytoskeletal interactions that may be linked to extracellular matrix deformations. The observed volume and shape changes of the chondrocyte organelles and the differential behavior between organelles during tissue compression provides evidence for an important mechanotransduction pathway linking translational and post-translational events. For example, since the Golgi is the site of post-translational modifications of aggrecan (e.g., glycosylation and sulfation) [89, 90], changes in Golgi morphology and function with compression may play a critical role in the known changes in GAG chain length and sulfation caused by compression [21]. Such changes in GAG and aggrecan structure, which also occur naturally with age (Fig. 1.2c) may profoundly influence aggrecan function. Such functional mechanical changes can now be measured directly using atomic force microscopy methodologies [91, 92] (Fig. 1.2d).
Cartilage Mechanobiology
(a)Figure 1.2
Figure 1.2 : Loading of cartilage explants (a), or direct mechanical stimulation of cells (b) can produce mechanical stimuli that may be sensed by the cell and its pericellular microenvironment (b). These mechanical stimuli may alter the rate of synthesis as well as the molecular structure of ECM molecules such as aggrecan (c) which, in turn, could ultimately affect tissue-level
biomechanical properties in a feedback fashion (a). New cell-level and molecular-level measurement techniques, such as those based on atomic force microscopy, are being used to quantify the molecular mechanical properties of ECM macromolecules (d) as well as cellular mechanical properties (b).
1.7 Systems biology approaches
Real time PCR and gene clustering analyses have been used to study intermediate-size gene sets (20-48 genes) thought to be involved with cartilage mechanotransduction. Fitzgerald et al. [33] examined the kinetics of mechano-regulation of gene transcription in response to static compression of bovine calf cartilage explants for periods between 1-24 hours in the presence or absence of an intracellular calcium chelator or an inhibitor of cyclic AMP activated protein kinase A. Cluster analysis of the data revealed four main expression patterns: two groups that contained either transiently upregulated or duration-enhanced expression profiles could each be
(b)
subdivided into genes that did or did not require intracellular calcium release and cyclic AMP activated protein kinase A for their mechano-regulation. Transcription levels for aggrecan, type II collagen, and link protein were upregulated approximately 2 to 3-fold during the first 8 hrs of 50% compression and subsequently down-regulated to levels below that of free-swelling controls by 24hrs. Transcription levels of matrix metalloproteinases-3,9,13, aggrecanase- 1 and the matrix protease regulator cyclooxygenase-2 increased with the duration of 50% compression 2 to 16-fold up to by 24 hrs. Thus, transcription of proteins involved in matrix remodeling and
catabolism dominated over anabolic matrix proteins as the duration of static compression
increased. These approaches are also being used to study responses to dynamic compression and tissue shear of cartilage explants.
Researchers have begun to integrate genomic and proteomic approaches with the computational tools of systems biology for applications in musculoskeletal research, including medical diagnostics, and drug discovery [93]. DNA microarray technology is being used to explore the complex feedback loops in transcription factors and layered signaling pathways underlying the mechanotransduction as well as the pathobiology of osteoarthritis. Aigner et al. [94-96] examined transcript levels of matrix components and matrix degrading proteinases using DNA arrays. By comparing normal chondrocytes with early and late stage OA chondrocytes, they examined expression trends involving up and down regulation of MMPs, TIMPS, proteoglycans, and collagens [96]. Such approaches can be directly applied to the study of mechanotransduction. While DNA arrays can sample large numbers of genes, they are limited in their sensitivity and they do not measure posttranscriptional regulation or modifications [94]. While recognizing these limitations, the potential of such profiling approaches is clear [95, 97], since the results can be used to formulate hypotheses about specific molecules and mechanisms in ways that are complementary to the traditional one-gene or one-protein hypothesis-testing approach.
1.8 Conclusion
Chondrocytes can sense and respond to mechanical forces in an extraordinarily sensitive and robust manner. These cells can distinguish between compression, tension and shear
deformation of the surrounding ECM, and respond in a manner that varies with the rate (frequency) of loading. Recent studies have identified several intracellular signaling pathways that are involved in chondrocyte mechanotransduction and the regulation of cartilage and exhibit levels of overlap or crosstalk in their signaling. These complex signals are responsible for activation of ECM molecules proteinases, inflammatory factors, and regulatory proteins which govern tissue homeostasis. Significant technical advances have enabled the study of transduction mechanisms by chondrocytes within their native, dense ECM. Advanced genomic and proteomic technologies should lead to a further rapid increase understanding the fundamental link between chondrocyte mechanobiology, physiology, and tissue homeostatis in health and disease, with direct application to cartilage repair and tissue engineering.
Acknowledgements
1.9 References and recommended reading
1. Herberhold, C., S. Faber, T. Stammberger, et al., In situ measurement of articular
cartilage deformation in intact femoropatellar joints under static loading. J. Biomech.,
1999. 32(12): p. 1287-1295.
2. Ateshian, G.A., S.D. Kwak, L.J. Soslowsky, and V.C. Mow, A Stereophotogrammetric
Method for Determining in-Situ Contact Areas in Diarthroidal Joints, and a Comparison with Other Methods. Journal of Biomechanics, 1994. 27(1): p. 111-124.
3. Hodge, W.A., R.S. Fijan, K.L. Carlson, et al., Contact Pressures in the Human Hip-Joint
Measured Invivo. Proc. Natl. Acad. Sci. U.S.A., 1986. 83(9): p. 2879-2883.
4. Muir, H., The chondrocyte, architect of cartilage. BioEssays, 1995(17): p. 1039-1048.
5. Benya, P.D. and J.D. Shaffer, Dedifferentiated chondrocytes reexpress the differentiated
collagen phenotype when cultured in agarose gels. Cell, 1982. 30(1): p. 215-24.
** A classic in the field and important for all applications in cartilage tissue engineering. 6. Hauselmann, H.J., R.J. Fernandes, S.S. Mok, et al., Phenotypic stability of bovine
articular chondrocytes after long-term culture in alginate beads. J Cell Sci, 1994. 107 (
Pt 1): p. 17-27.
7. Buschmann, M.D., Y.A. Gluzband, A.J. Grodzinsky, and E.B. Hunziker, Mechanical
Compression Modulates Matrix Biosynthesis in Chondrocyte Agarose Culture. Journal of
Cell Science, 1995. 108: p. 1497-1508.
8. Ragan, P.M., V.I. Chin, H.H. Hung, et al., Chondrocyte extracellular matrix synthesis
and turnover are influenced by static compression in a new alginate disk culture system.
Arch. Biochem. Biophys., 2000. 383(2): p. 256-64.
9. Hung, C.T., R.L. Mauck, C.C. Wang, et al., A paradigm for functional tissue engineering
of articular cartilage via applied physiologic deformational loading. Ann Biomed Eng,
2004. 32(1): p. 35-49.
* A very good review of applications of chondrocyte mechanobiology to tissue cartilage engineering
10. Domm, C., J. Fay, M. Schunke, and B. Kurz, [Redifferentiation of dedifferentiated joint
cartilage cells in alginate culture. Effect of intermittent hydrostatic pressure and low oxygen partial pressure]. Orthopaedic, 2000. 29(2): p. 91-9.
11. Wu, Q., Y. Zhang, and Q. Chen, Indian hedgehog is an essential component of
mechanotransduction complex to stimulate chondrocyte proliferation. J Biol Chem, 2001.
276(38): p. 35290-6.
** An important example of cell signaling in response to mechanical stretching of chondrocytes 12. Hung, C.T., M.A. LeRoux, G.D. Palmer, et al., Disparate aggrecan gene expression in
chondrocytes subjected to hypotonic and hypertonic loading in 2D and 3D culture.
Biorheology, 2003. 40(1-3): p. 61-72.
13. Szasz, N.H., H. Sen, S. Grodzinsky, A, Electric field regulation of chondrocyte
biosynthesis in agarose gel constructs. Trans Orthop Res Soc, 2003(28): p. 672.
14. Torzilli, P.A., R. Grigiene, C. Huang, et al., Characterization of cartilage metabolic
response to static and dynamic stress using a mechanical explant test system. J Biomech,
15. Frank, E.H., M. Jin, A.M. Loening, et al., A versatile shear and compression apparatus
for mechanical stimulation of tissue culture explants. Journal of Biomechanics, 2000.
33(11): p. 1523-1527.
16. Fermor, B., J.B. Weinberg, D.S. Pisetsky, et al., The effects of static and intermittent
compression on nitric oxide production in articular cartilage explants. J Orthop Res,
2001. 19(4): p. 729-37.
17. Vanderploeg, E.J., S.M. Imler, K.R. Brodkin, et al., Oscillatory tension differentially
modulates matrix metabolism and cytoskeletal organization in chondrocytes and fibrochondrocytes. J Biomech, 2004. 37(12): p. 1941-52.
18. Sah, R.L.Y., Y.J. Kim, J.Y.H. Doong, et al., Biosynthesis Response to Cartilage Explants
to Dynamic Compression. J. Orthop. Res., 1989. 7: p. 619-636.
19. Guilak, F., B.C. Meyer, A. Ratcliffe, and V.C. Mow, The effects of matrix compression
on proteoglycan metabolism in articular cartilage explants. Osteoarthr. Cartilage, 1994.
2: p. 91-101.
20. Jortikka, M.O., J.J. Parkkinen, R.I. Inkinen, et al., The role of microtubules in the
regulation of proteoglycan synthesis in chondrocytes under hydrostatic pressure.
Archives of Biochemistry and Biophysics, 2000. 374(2): p. 172-180.
21. Kim, Y.J., A.J. Grodzinsky, and A.H. Plaas, Compression of cartilage results in
differential effects on biosynthetic pathways for aggrecan, link protein, and hyaluronan.
Arch. Biochem. Biophys., 1996. 328(2): p. 331-40.
22. Kim, Y.J., R.L. Sah, A.J. Grodzinsky, et al., Mechanical regulation of cartilage
biosynthetic behavior: physical stimuli. Arch. Biochem. Biophys., 1994. 311(1): p. 1-12.
23. Jin, M., E.H. Frank, T.M. Quinn, et al., Tissue shear deformation stimulates proteoglycan
and protein biosynthesis in bovine cartilage explants. Arch Biochem Biophys, 2001.
395(1): p. 41-8.
24. Parkkinen, J.J., M.J. Lammi, A. Pelttari, et al., Altered Golgi-Apparatus in
Hydrostatically Loaded Articular-Cartilage Chondrocytes. Annals of the Rheumatic
Diseases, 1993. 52(3): p. 192-198.
25. Wong, M., M. Siegrist, and X. Cao, Cyclic compression of articular cartilage explants is
associated with progressive consolidation and altered expression pattern of extracellular matrix proteins. Matrix Biol, 1999. 18(4): p. 391-9.
26. Li, K.W., A.K. Williamson, A.S. Wang, and R.L. Sah, Growth responses of cartilage to
static and dynamic compression. Clin Orthop Relat Res, 2001(391 Suppl): p. S34-48.
** A good review the effects of tissue age on the response of cartilage to mechanical loading. 27. Buschmann, M.D., Y.J. Kim, M. Wong, et al., Stimulation of aggrecan synthesis in
cartilage explants by cyclic loading is localized to regions of high interstitial fluid flow.
Archives of Biochemistry and Biophysics, 1999. 366(1): p. 1-7.
28. Quinn, T.M., A.J. Grodzinsky, M.D. Buschmann, et al., Mechanical compression alters
proteoglycan deposition and matrix deformation around individual cells in cartilage explants. Journal of Cell Science, 1998. 111: p. 573-583.
29. Valhmu, W.B., E.J. Stazzone, N.M. Bachrach, et al., Load-Controlled Compression of
Articular Cartilage induces a transient stimulation ofAggrecan gene expression. Arch.
Biochem. Biophys., 1998. 353(1): p. 29-36.
30. Smith, R.L., S.F. Rusk, B.E. Ellison, et al., In vitro stimulation of articular chondrocyte
mRNA and extracellular matrix synthesis by hydrostatic pressure. J Orthop Res, 1996.
31. Takahashi, K., T. Kubo, K. Kobayashi, et al., Hydrostatic pressure influences mRNA
expression of transforming growth factor-beta 1 and heat shock protein 70 in chondrocyte-like cell line. J Orthop Res, 1997. 15(1): p. 150-8.
32. Suh, J.K., G.H. Baek, A. Aroen, et al., Intermittent sub-ambient interstitial hydrostatic
pressure as a potential mechanical stimulator for chondrocyte metabolism. Osteoarthritis
Cartilage, 1999. 7(1): p. 71-80.
33. Fitzgerald, J.B., M. Jin, D. Dean, et al., Mechanical compression of cartilage explants
induces multiple time-dependent gene expression patterns and involves intracellular calcium and cyclic AMP. Journal of Biological Chemistry, 2004. 279(19): p.
19502-19511.
** A good example of a study of mechanical regulation of gene expression including the use of clustering algorithms for statistical analysis of multiple gene responses
34. Fehrenbacher, A., E. Steck, M. Rickert, et al., Rapid regulation of collagen but not
metalloproteinase 1, 3, 13, 14 and tissue inhibitor of metalloproteinase 1, 2, 3 expression in response to mechanical loading of cartilage explants in vitro. Arch. Biochem.
Biophys., 2003. 410(1): p. 39-47.
35. Upton, M.L., J. Chen, F. Guilak, and L.A. Setton, Differential effects of static and
dynamic compression on meniscal cell gene expression. J Orthop Res, 2003. 21(6): p.
963-9.
36. Chen, J., W. Yan, and L.A. Setton, Static compression induces zonal-specific changes in
gene expression for extracellular matrix and cytoskeletal proteins in intervertebral disc cells in vitro. Matrix Biol, 2004. 22(7): p. 573-83.
37. Smith, R.L., B.S. Donlon, M.K. Gupta, et al., Effects offluid-induced shear on articular
chondrocyte morphology and metabolism in vitro. J Orthop Res, 1995. 13(6): p. 824-31.
38. Jin, G., R.L. Sah, Y.S. Li, et al., Biomechanical regulation of matrix metalloproteinase-9
in cultured chondrocytes. Journal of Orthopaedic Research, 2000. 18(6): p. 899-908.
39. Hung, C.T., D.R. Henshaw, C.C.B. Wang, et al., Mitogen-activated protein kinase
signaling in bovine articular chondrocytes in response to fluidflow does not require calcium mobilization. Journal of Biomechanics, 2000. 33(1): p. 73-80.
40. Holmvall, K., L. Camper, S. Johansson, et al., Chondrocyte and chondrosarcoma cell
integrins with affinity for collagen type II and their response to mechanical stress. Exp
Cell Res, 1995. 221(2): p. 496-503.
41. Wang, N., J.P. Butler, and D.E. Ingber, Mechanotransduction across the cell surface and
through the cytoskeleton. Science, 1993. 260(5111): p. 1124-7.
42. Salter, D.M., S.J. Millward-Sadler, G. Nuki, and M.O. Wright, Integrin-interleukin-4
mechanotransduction pathways in human chondrocytes. Clinical Orthopaedics and
Related Research, 2001(391): p. S49-S60.
43. Chowdhury, T.T., D.M. Salter, D.L. Bader, and D.A. Lee, Integrin-mediated
mechanotransduction processes in TGFbeta-stimulated monolayer-expanded chondrocytes. Biochem Biophys Res Commun, 2004. 318(4): p. 873-81.
* A good example of integrin interactions and mechanotransduction
44. Millward-Sadler, S.J., M.O. Wright, H. Lee, et al., Altered electrophysiological responses
to mechanical stimulation and abnormal signaling through alpha5betal integrin in chondrocytes from osteoarthritic cartilage. Osteoarthritis Cartilage, 2000. 8(4): p. 272-8.
45. Millward-Sadler, S.J., M.O. Wright, H. Lee, et al., Integrin-regulated secretion of
interleukin 4: A novel pathway of mechanotransduction in human articular chondrocytes.
J. Cell. Biol., 1999. 145(1): p. 183-9.
46. Chavis, P. and G. Westbrook, Integrins mediate functional pre- and postsynaptic
maturation at a hippocampal synapse. Nature, 2001. 411(6835): p. 317-21.
47. Hisatsune, C., H. Umemori, M. Mishina, and T. Yamamoto, Phosphorylation-dependent
interaction of the N-methyl-D-aspartate receptor epsilon 2 subunit with phosphatidylinositol 3-kinase. Genes Cells, 1999. 4(11): p. 657-66.
48. Salter, D.M., M.O. Wright, and S.J. Millward-Sadler, NMDA receptor expression and
roles in human articular chondrocyte mechanotransduction. Biorheology, 2004. 41(3-4):
p. 273-81.
* A good review of specialized receptors and their role in signaling in mechanotransduction
49. Li, K.W., A.S. Wang, and R.L. Sah, Microenvironment regulation of extracellular
signal-regulated kinase activity in chondrocytes -Effects of culture configuration, interleukin-1, and compressive stress. Arthritis Rheum., 2003. 48(3): p. 689-699.
50. Fanning, P.J., G. Emkey, R.J. Smith, et al., Mechanical regulation of mitogen-activated
protein kinase signaling in articular cartilage. J. Biol. Chem., 2003. 278(51): p.
50940-50948.
* A thorough study of the kinetics of MAPK pathways in reaction to transient ramp-and-hold compression of cartilage.
51. Kim, S.J., S.G. Hwang, I.C. Kim, and J.S. Chun, Actin cytoskeletal architecture regulates
nitric oxide-induced apoptosis, dedifferentiation, and cyclooxygenase-2 expression in articular chondrocytes via mitogen-activated protein kinase and protein kinase C
pathways. J Biol Chem, 2003. 278(43): p. 42448-56.
* A very good example of the role of the actin cytoskeleton in a variety of different signaling pathways.
52. Fanning, P., G. Emkey, A.J. Grodzinsky, and S. Trippel, Response of Cartilage to
Mechanical Loading is correlated with sustained ERK1/2 Activation. ORS 47th Annual
Meeting, 2001.
53. Dhanasekaran, N., S.T. Tsim, J.M. Dermott, and D. Onesime, Regulation of cell
proliferation by G proteins. Oncogene, 1998. 17(11 Reviews): p. 1383-94.
54. Tibbles, L.A. and J.R. Woodgett, The stress-activated protein kinase pathways. Cell Mol
Life Sci, 1999. 55(10): p. 1230-54.
55. Millward-Sadler, S.J., M.O. Wright, P.W. Flatman, and D.M. Salter, ATP in the
mechanotransduction pathway of normal human chondrocytes. Biorheology, 2004.
41(3-4): p. 567-75.
56. Elfervig, M.K., R.D. Graff, G.M. Lee, et al., ATP induces Ca(2+) signaling in human
chondrons cultured in three-dimensional agarose films. Osteoarthritis Cartilage, 2001.
9(6): p. 518-26.
57. Graff, R.D., E.R. Lazarowski, A.J. Banes, and G.M. Lee, ATP release by mechanically
loaded porcine chondrons in pellet culture. Arthritis Rheum, 2000. 43(7): p. 1571-9.
58. Croucher, L.J., A. Crawford, P.V. Hatton, et al., Extracellular ATP and UTP stimulate
cartilage proteoglycan and collagen accumulation in bovine articular chondrocyte pellet

![Figure 3.6. Aggrecan Protein Synthesis compared to Aggrecan Gene Expression. (A) Aggrecan protein synthesis as measured by 35S radiolabel incorporation normalized to 0% compression 0 IGF-1 adapted from Bonassar et al [5]](https://thumb-eu.123doks.com/thumbv2/123doknet/14202641.480269/73.918.189.791.119.449/aggrecan-synthesis-aggrecan-expression-radiolabel-incorporation-normalized-compression.webp)