HAL Id: hal-02820990
https://hal.inrae.fr/hal-02820990
Submitted on 6 Jun 2020
HAL is a multi-disciplinary open access
archive for the deposit and dissemination of sci-entific research documents, whether they are pub-lished or not. The documents may come from teaching and research institutions in France or abroad, or from public or private research centers.
L’archive ouverte pluridisciplinaire HAL, est destinée au dépôt et à la diffusion de documents scientifiques de niveau recherche, publiés ou non, émanant des établissements d’enseignement et de recherche français ou étrangers, des laboratoires publics ou privés.
Non parametric and parametric analysis of Engel
function for calorie, dietary diversity and food shares in
the calories, in rural and urban Mali
Ibrahima Bocoum, Sandrine Dury
To cite this version:
Ibrahima Bocoum, Sandrine Dury. Non parametric and parametric analysis of Engel function for calorie, dietary diversity and food shares in the calories, in rural and urban Mali. Journées Jeunes Chercheurs du Département SAE2, Oct 2009, Montpellier, France. 15 p. �hal-02820990�
Non parametric and parametric analysis of Engel function for
calorie, dietary diversity and food shares in the calories, in rural
and urban Mali.
Ibrahima Bocoum
PhD candidate. University of Montpeller1. UMR MOISA, INRA Montpellier, 2 Place Pierre Viala, Bât. 26, 34060 Montpellier Cedex 2. Tel: (33) 4 61 99 28 68, Fax: (33) 4 67 54 58 05.
bocoum@supagro.inra.fr
Sandrine Dury
Economist of food consumption. UMR MOISA, CIRAD Montpellier, TA C-99/15, 34398 Montpellier Cedex 5. Tel : (33) 4 67 61 56 50, Fax : (33) 4 67 61 44 15.
sandrine.dury@cirad.fr
Journées Jeunes Chercheurs, INRA SAE2, Montpellier, October 1-2, 2009
Abstract – We investigate the relationship between per capita expenditure and households’
food consumption through per capita calorie intake, dietary diversity score and share of different groups in the calories, using data from a 2001 nationally representative survey on Malian households. Using a non parametric method, we find non linear Engel curves, and therefore employ a quadratic demand model to estimate the Engel functions. We find a significant and positive relationship between per capita expenditure and calorie intake, lending support to the conventional wisdom that income growth can alleviate inadequate calorie intake. However, in rural areas, diet remains particularly unbalanced as per capita expenditure increases: decreasing share of cereals is only compensated by increasing share of oils and fats. In both rural and urban areas, the share of fruits and vegetables is insensible to per capita expenditure. This highlights the limit of households’ monetary poverty alleviation to improve their food security. The results also suggest that: calorie intake improves with increasing transfers in kind (urban areas); diet quality improves with household head education (rural and urban areas); the share of meat, poultry, milk and eggs improves with decreasing health budget share (urban areas); the share of fruits, vegetables, roots and tubers improves with decreasing transport budget share (rural areas).
Key words: Engel functions, food consumption, monetary poverty, Mali
Copyright 2009 by Ibrahima Bocoum and Sandrine Dury. All rights reserved. Readers may make verbatim copies of this document for non-commercial purposes by any means, provided that this copyright notice appears on all such copies.
1. Introduction
Many development policies concerning poverty alleviation assume that increasing income would result, at least implicitly, in better food security. This is true historically, but concerning specific questions –such as nutritional issues- this is not clear. The study of the relationship between per capita calorie consumption and income or total expenditure has given controversial results. For some authors (Behrman and Wolfe (1984), Berhman and Deolalikar (1987), Bouis and Haddad (1992)) the expenditure elasticity of calorie consumption is close to zero whereas for others it is significantly positive (e.g. Strauss and Thomas (1990), Subramanian and Deaton (1996), Orhi Vachaspati et al. (1998), Abdulai and Aubert (2004b)). However, this controversy is not so clear since there are in fact many differences such as type of data and method of data collection or method of per capita calorie and expenditure calculation. Although there is an important literature on this question, issues on empirical studies remain very thin for subsaharan Africa (Abdulai and Aubert, 2004b). Moreover, the link between per capita income or total expenditure and the quality of the diet is not sufficiently documented for this region. As pointed out by Teklu (1996) and Abdulai and Aubert (2004a), the evidence on income elasticities for individual food and food groups for sub-Saharan Africa is also very thin.
Studies on these questions are even rarer in urban areas, where households also face food insecurity problems.
The objective of this paper is to assess the relationship between different nutritional indicators of food consumption (calorie intake, dietary diversity, calorie share of certain food groups) and total expenditure of households, in the specific context of the Sahelian region of Africa, especially in rural and urban Mali.
The importance of food insecurity in the Sahelian context, where a large population does not meet its basics food need, is such that one can expect a positive and significant relationship between per capita calorie intake and per capita expenditure. However, it is difficult to have an idea on the relationship between per capita expenditure and the quality of households’ diet a priori. But recent evidences on important rate of malnutrition in the wealthiest cotton production zone (Sikasso) suggest a possible weak relationship.
Section one describes the data and presents descriptive statistics; section two discusses the choice of the functional form of demand equations and the choice of the demand model; section three presents the results; and finally the last section discusses the results and gives some concluding remarks.
2. Data and descriptive statistics
This study draws upon data collected for a nationally representative survey (called EMEP) of households’ expenditures and food consumptions carried out by the Malian national institute of statistics (DNSI) on a funding of the World Bank, in four rounds (one each quarter of the year) between January and December 2001. Our analysis is based on a sample of 4952 households, 3121 in rural areas and 1831 in urban areas. Besides a questionnaire on the different types of expenditures, foods serving for the preparation of each meal in the household were weighted during a week for each round. The number of individuals eating each meal has been taken into account in order to better assess per capita consumption. Besides meal gifts and guests have also been taken into account. However, we could not take into account outside food consumption since the number of individuals concerned with this type of consumption, was not clearly identified. An important work of data cleaning has been realized on the raw data files of the survey, before using them for the analysis. The equivalences used initially to convert the weights in calories were corrected using
composition tables found in Favier et al. (1995), Nordeide (1997), Souci et al. (2000) and the Food Composition Table for International Use of Food and Agriculture Organization of the United Nations (FAO). The edible parts of foods found in the references above, were also added to estimate more correctly individual calorie intakes. We used an inter quartile interval of median +/- 3*(Q3-Q1) and median +/- 6*(Q3-Q1) by livelihood zone and type of areas respectively for calorie intakes and expenditures, to find suspicious per capita consumptions
(at a desegregate level1). Consumptions outside these intervals were corrected by imputation
of median consumption of households living in the same zone and the same type of areas. Missing information was also corrected by the same process. Because there were also missing rounds for an important number of households, we were constrained to make only cross-sectional analysis by using mean consumptions (mean annual per capita expenditure and mean per capita and per day calorie intake). Since the source of each food used for the preparation of meals was available, we have valued home consumption by using unit costs (computed with information for each food on total expenditure and quantities in grams) and added it to per capita expenditure. Subsequently, all per capita expenditure are expressed in
purchasing power parity2 (PPP) and in descriptive statistics and econometrical analysis
observations will be weighted by a coefficient corresponding to the weight of each household in the whole sample.
We grouped rural and urban households in three per capita expenditure categories: tercile1 are the poorest households and tercile3 the less poor households.
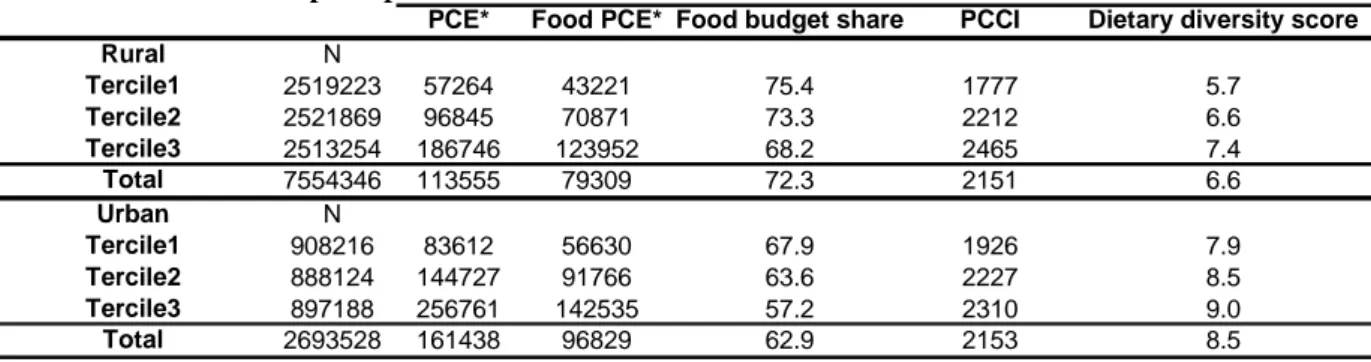
Table 1 summarizes descriptive statistics on mean per capita and per year expenditure (PCE), per capita food expenditure (food PCE), food budget share, per capita and per day calorie
intake (PCCI) and dietary diversity score3.
Table 1 : Global consumption patterns in rural and urban Mali 2001
PCE* Food PCE* Food budget share PCCI Dietary diversity score
Rural N Tercile1 2519223 57264 43221 75.4 1777 5.7 Tercile2 2521869 96845 70871 73.3 2212 6.6 Tercile3 2513254 186746 123952 68.2 2465 7.4 Total 7554346 113555 79309 72.3 2151 6.6 Urban N Tercile1 908216 83612 56630 67.9 1926 7.9 Tercile2 888124 144727 91766 63.6 2227 8.5 Tercile3 897188 256761 142535 57.2 2310 9.0 Total 2693528 161438 96829 62.9 2153 8.5 * In PPP
The mean PCE in PPP is 113555 francs in rural areas and 161438 francs in urban areas. Food expenditure represents respectively 72.3% and 62.9% of the total expenditure in rural and urban areas. This expenditure increases with increasing total expenditure, but its share in the total expenditure decreases with increasing total expenditure. This seems to be consistent with Engel law. PCCI and household dietary diversity increase with increasing PCE both in rural and urban areas. Households in urban areas have a more diversified diet than those in rural
1
Individual products were put together with certain logic: all non transformed cereals, all transformed cereals, all beef meat, all other meat, all poultry, all fish, all milk, all oil and fats, all fruits, etc.
2 Using unit values for the most frequent food consumption (food represent almost 75% of total budget in
average), we computed a Paasche index of prices for each region and type of area. The district of Bamako has been chosen as the reference in the index computation.
3 The dietary diversity score is the number of different food groups consumed in average during a week.
Following FAO (2007), we have taken twelve groups: cereals [1], white roots and tubers [2], vegetables [3], fruits [4], meat [5], eggs [6], fish [7], pulses, legumes and nuts [8], milk [9], oils and fats [10], sweets [11], spices, condiments and beverages [12].
areas (scores are respectively 8.5 and 6.6). It is remarkable to see that poorest urban households have a higher score than richest rural households. However, PCCI is almost equivalent in rural and urban areas (almost 2150 kcal per capita and per day). We can also observe a greater heterogeneity of food consumption for rural areas than urban areas. The poorest rural households have an average PCCI of 1777 kcal whereas the richest ones have 2465 kcal. For urban areas, PCCI lies between 1926 kcal and 2310 kcal. The higher heterogeneity in rural areas is probably due to method of home consumption estimation, but can be also explained by greater differences in households’ livelihoods.
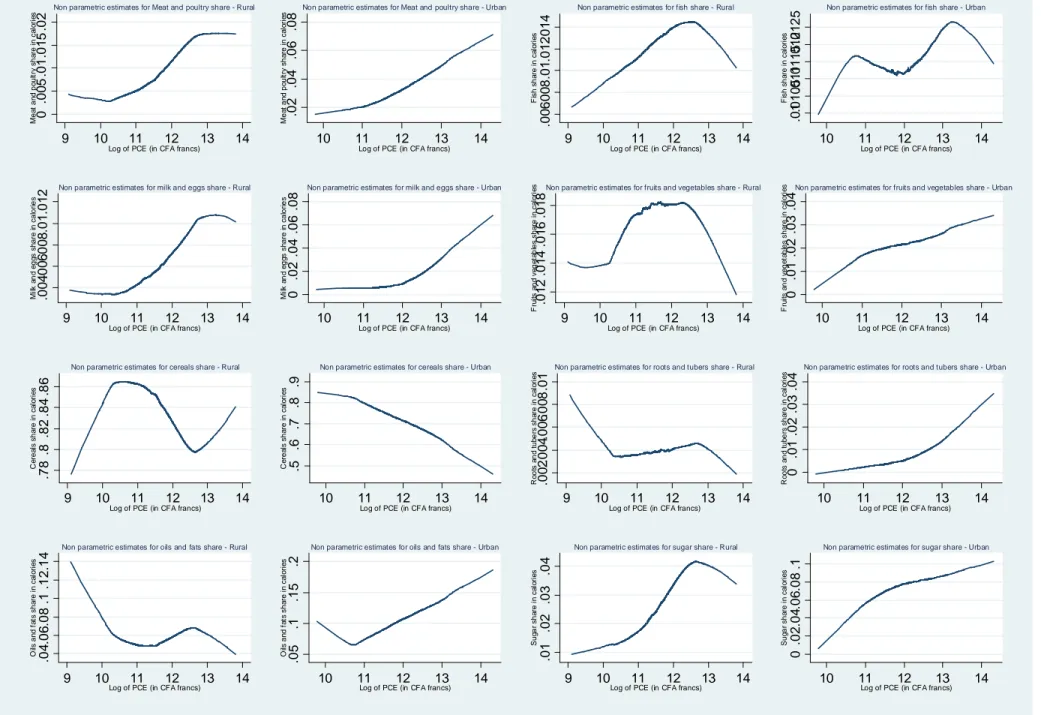
Table 2 describes food consumption patterns. Columns 1-4 show expenditure patterns expressed as shares of the budget. They are computed from the budget shares of each of the 4952 observations, averaged over the different categories of per capita expenditure and over the whole sample in column 4. Columns 5-8 show the distribution of calories over the various food groups. Cereals represent the most important budget share (respectively 53% and 82.3% in rural areas and 35.7% and 69.1% in urban areas). This food group is the largest source of calorie for Malian households: 82% and 70% of calorie intake in rural and urban areas. However the calorie and budget share of cereals are smaller for urban households and decline with increasing per capita expenditure in each type of area. After cereals, meat and poultry and fruits and vegetables have the most important budget shares (respectively 7% and 6.2% in rural areas and 16.1% and 10.4% in urban areas).
These food groups contribute, however, weakly to calorie intake in comparison to oils and fats (which are less important in the budget nevertheless), because calories from meat, poultry, fruits and vegetables are more expensive. Calories from other animal source products are also expensive. Cereals provide cheaper calories, especially to the poorest households. We observe an increase in price of calories from low to high per capita expenditure. This is due to a shift in consumption from cheap cereals to more refined and processed products.
3. Method
Non parametric analysis is more and more used by authors to identify the right shape of the relationship linking PCE to calorie consumption or consumption of certain food groups: Subramanian and Deaton (1996), Banks et al. (1997), Abdulai and Aubert (2004a), (2004b). Once the right shape identified, one can then choose the most adequate parametric estimation. Following earlier works, in this study we made non parametric estimations and analyse the shape of the relationship between PCE, on one hand and PCCI, dietary diversity, and shares of different food groups in total calorie intake on the other hand. The estimation method is smooth locally weighted linear regression, with a bandwidth of 0.8. We tried also smaller bandwidths; the shape of Engel curves remained unchanged.
The locally linear estimator evaluated at a point x is the estimator of the parameter
α
of thefollowing regression: (1) yi = +
α β
(xi− +x)ε
i(Where x is logarithm of per capita expenditure and y the level of food consumption) Obtained by weighted least squares, with the weight:
i x x k h −
(Where h is the bandwidth)
This weight is the result of the minimisation of the function:
[
]
2 , 1 ( ) n i i i i x x Min k y x x h α β = α β − − − − ∑
Table 2 : Consumption patterns and prices per calorie, by food groups in rural and urban Mali 2001
Tercile 1 Tercile 2 Tercile 3 Mean Tercile 1 Tercile 2 Tercile 3 Mean Tercile 1 Tercile 2 Tercile 3 Mean Cereals 56.4% 54.8% 47.6% 53.0% 83.2% 84.4% 79.3% 82.3% 0.04 0.05 0.06 0.05 Roots and tubers 0.4% 0.6% 0.7% 0.6% 0.2% 0.3% 0.2% 0.2% 0.12 0.30 0.98 0.54 Meat and poultry 5.3% 5.6% 10.0% 7.0% 0.5% 0.6% 1.4% 0.9% 0.93 1.41 2.14 1.61 Fish 5.0% 5.8% 6.7% 5.9% 1.3% 1.2% 1.5% 1.4% 0.50 0.54 0.77 0.61 Fruits and vegetables 6.1% 6.4% 6.3% 6.2% 2.2% 2.2% 2.6% 2.3% 1.10 1.13 1.55 1.26 Milk and eggs 0.8% 1.3% 1.6% 1.2% 0.7% 0.8% 0.9% 0.7% 0.56 0.53 2.53 1.40 Oils and fats 3.0% 3.1% 3.5% 3.2% 5.0% 4.2% 5.8% 5.0% 0.07 0.08 0.09 0.08 Sugar 3.5% 4.8% 6.4% 4.9% 2.0% 2.3% 3.8% 2.8% 0.22 0.25 0.29 0.26 Other foods 19.4% 17.5% 17.0% 17.9% 5.0% 3.9% 4.5% 4.5% 0.46 0.72 0.91 0.70
Tercile 1 Tercile 2 Tercile 3 Moyenne Tercile 1 Tercile 2 Tercile 3 Moyenne Tercile 1 Tercile 2 Tercile 3 Moyenne Cereals 40.2% 35.9% 31.2% 35.7% 72.4% 69.9% 64.9% 69.1% 0.05 0.05 0.10 0.07 Roots and tubers 0.7% 1.0% 1.5% 1.1% 0.1% 0.3% 0.5% 0.3% 0.64 0.51 0.89 0.70 Meat and poultry 12.1% 16.5% 19.7% 16.1% 2.6% 3.3% 4.2% 3.4% 0.63 0.90 1.83 1.13 Fish 6.8% 5.7% 5.5% 6.0% 1.3% 1.2% 1.4% 1.3% 0.67 0.72 1.03 0.80 Fruits and vegetables 9.8% 10.4% 11.2% 10.4% 2.2% 2.4% 2.6% 2.4% 0.74 0.83 1.07 0.88 Milk and eggs 1.3% 1.7% 2.6% 2.0% 0.8% 0.8% 1.5% 1.0% 0.77 1.77 1.40 1.37 Oils and fats 6.6% 6.6% 6.7% 6.6% 10.0% 11.2% 13.1% 11.4% 0.07 0.08 0.10 0.08 Sugar 6.6% 6.7% 6.5% 6.6% 7.3% 8.0% 8.5% 7.9% 0.14 0.12 0.15 0.14 Other foods 15.8% 15.6% 15.1% 15.5% 3.3% 3.0% 3.1% 3.2% 0.74 1.00 1.41 1.05
Rural
Food expenditure share Calorie share Price per calories (FCFA per 1000 calories)
Urban
Food expenditure share Calorie share Price per calories (FCFA per 1000 calories)
Note: Tercile1 represents the poorest households. Budget and calorie shares for the different food groups are computed for each household and
then averaged over the different categories of per capita expenditure and over the whole sample. For price per calorie computation, we divided the average per capita expenditure (the value of home consumption has been taken into account) by per capita calorie intake per day, for each food group and household and then averaged over the different categories of per capita expenditure and over the whole sample.
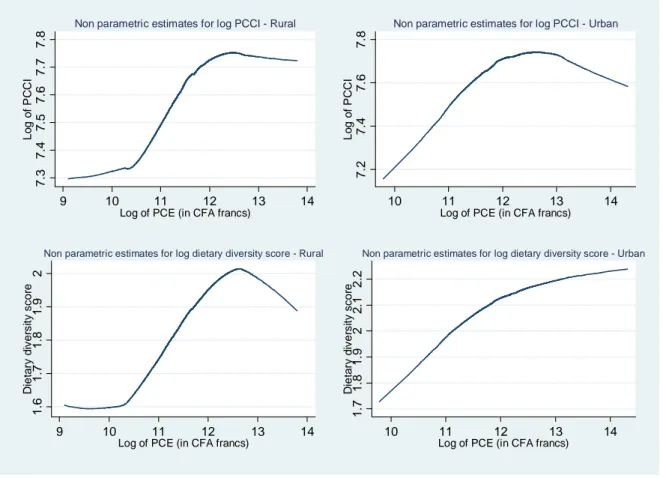
Figure 1 and 24 show the different curves generated by this method. We can observe clear non linear shapes even for PCCI, and this is contradictory with recent result found by Subramanian and Deaton (1996) or Abdulai and Aubert (2004b). The logarithm of PCCI and
logarithm of dietary diversity score show a certain concavity in logarithm of PCE5. Log of
PCCI and log of dietary diversity score is almost steady when log of PCE increases, for the very poor households in rural areas. A possible explanation is that these households have already covered their vital food needs but not their other basic non food needs, thus with increasing PCCI, before increasing further their food consumption, they have to deal with these other needs (such as dress or shelter).
Our findings suggest that a simple linear regression is insufficient to make the best estimation of the Engel functions.
7 .3 7 .4 7 .5 7 .6 7 .7 7 .8 L o g o f P C C I 9 10 11 12 13 14
Log of PCE (in CFA francs)
Non parametric estimates for log PCCI - Rural
7 .2 7 .4 7 .6 7 .8 L o g o f P C C I 10 11 12 13 14
Log of PCE (in CFA francs)
Non parametric estimates for log PCCI - Urban
1 .6 1 .7 1 .8 1 .9 2 D ie ta ry d iv e rs it y s c o re 9 10 11 12 13 14
Log of PCE (in CFA francs)
Non parametric estimates for log dietary diversity score - Rural
1 .7 1 .8 1 .9 2 2 .1 2 .2 D ie ta ry d iv e rs it y s c o re 10 11 12 13 14
Log of PCE (in CFA francs)
Non parametric estimates for log dietary diversity score - Urban
Figure 1 : Non parametric estimates for log of PCCI and log of dietary diversity score in rural and urban areas
4
The scales in the figure 2 are automatically computed to take into account the difference in the value of the food shares in the two areas. Putting all the curves in a unique graphic with unique scale would make the observation of the shapes, difficult.
5 Logarithmic transformation was also done for the score of dietary diversity, but not for calorie shares of the
0 .0 0 5 .0 1 .0 1 5 .0 2 M e a t a n d p o u lt ry s h a re i n c a lo ri e s 9 10 11 12 13 14
Log of PCE (in CFA francs)
Non parametric estimates for Meat and poultry share - Rural
.0 2 .0 4 .0 6 .0 8 M e a t a n d p o u lt ry s h a re i n c a lo ri e s 10 11 12 13 14
Log of PCE (in CFA francs)
Non parametric estimates for Meat and poultry share - Urban
.0 0 6. 0 0 8 .0 1 .0 1 2. 0 1 4 F is h s h a re i n c a lo ri e s 9 10 11 12 13 14
Log of PCE (in CFA francs) Non parametric estimates for fish share - Rural
.0 1.0 1 0 5.0 1 1.0 1 1 5.0 1 2.0 1 2 5 F is h s h a re i n c a lo ri e s 10 11 12 13 14
Log of PCE (in CFA francs) Non parametric estimates for fish share - Urban
.0 0 4. 0 0 6. 0 0 8 .0 1 .0 1 2 M ilk a n d e g g s s h a re i n c a lo ri e s 9 10 11 12 13 14
Log of PCE (in CFA francs) Non parametric estimates for milk and eggs share - Rural
0 .0 2 .0 4 .0 6 .0 8 M ilk a n d e g g s s h a re i n c a lo ri e s 10 11 12 13 14
Log of PCE (in CFA francs)
Non parametric estimates for milk and eggs share - Urban
.0 1 2 .0 1 4 .0 1 6 .0 1 8 F ru it s a n d v e g e ta b le s s h a re i n c a lo ri e s 9 10 11 12 13 14
Log of PCE (in CFA francs)
Non parametric estimates for fruits and vegetables share - Rural
0 .0 1 .0 2 .0 3 .0 4 F ru it s a n d v e g e ta b le s s h a re i n c a lo ri e s 10 11 12 13 14
Log of PCE (in CFA francs)
Non parametric estimates for fruits and vegetables share - Urban
.7 8 .8 .8 2 .8 4 .8 6 C e re a ls s h a re i n c a lo ri e s 9 10 11 12 13 14
Log of PCE (in CFA francs) Non parametric estimates for cereals share - Rural
.5 .6 .7 .8 .9 C e re a ls s h a re i n c a lo ri e s 10 11 12 13 14
Log of PCE (in CFA francs) Non parametric estimates for cereals share - Urban
.0 0 2. 0 0 4. 0 0 6. 0 0 8 .0 1 R o o ts a n d t u b e rs s h a re i n c a lo ri e s 9 10 11 12 13 14
Log of PCE (in CFA francs)
Non parametric estimates for roots and tubers share - Rural
0 .0 1 .0 2 .0 3 .0 4 R o o ts a n d t u b e rs s h a re i n c a lo ri e s 10 11 12 13 14
Log of PCE (in CFA francs)
Non parametric estimates for roots and tubers share - Urban
.0 4 .0 6 .0 8 .1 .1 2 .1 4 O ils a n d f a ts s h a re i n c a lo ri e s 9 10 11 12 13 14
Log of PCE (in CFA francs) Non parametric estimates for oils and fats share - Rural
.0 5 .1 .1 5 .2 O ils a n d f a ts s h a re i n c a lo ri e s 10 11 12 13 14
Log of PCE (in CFA francs) Non parametric estimates for oils and fats share - Urban
.0 1 .0 2 .0 3 .0 4 S u g a r s h a re i n c a lo ri e s 9 10 11 12 13 14
Log of PCE (in CFA francs) Non parametric estimates for sugar share - Rural
0 .0 2 .0 4 .0 6 .0 8 .1 S u g a r s h a re i n c a lo ri e s 10 11 12 13 14
Log of PCE (in CFA francs) Non parametric estimates for sugar share - Urban
Following recent studies which found non linear relationships, we estimated a quadratic demand model:
2
(2) Yi = +α βlnPCEi+γ(lnPCEi) +ηZi+εi
Where Y represents the consumption of household i i
sociodemographic characteristics of household term of error
i i
Z i
ε
Different variables where added in the model to control results: the share of individuals under 15 years old (und15), the share of individuals above 65 years old (abov65), logarithm of household size (lnhsize), a dummy variable on whether the household head has ever been to school or not (hhschool) and the ethnic group of the household (one dummy variable for each ethnic group).
We have also added other variables that we think can have an influence on the levels of food
consumption: gifts6, budget shares of health and transportation (health and trans) in all the
regressions and land surface possessed per capita (land), cattle and small ruminants possessed per capita (cattle and smallr) and the dynamic of the cattle in comparison with the preceding
year (dcattle1 and dcattle27) only in the log PCCI and log dietary diversity score regressions).
Because food consumption patterns are not necessarily the same for rural and urban households, we estimated separate regressions.
PCE elasticities formula in a double log quadratic equation is obtained by first differentiating the function Y (Ohri-Vachaspati et al., 1998):
(3) η β= +2 ln PCEγ
PCE elasticities formula in a semi log quadratic8 equation is:
(4) /
Where is the result of the differentiation of with respect to ln :
2 ln ln i i i i i i i i Y Y PCE Y PCE PCE η µ µ µ β γ = ∂ ≡ = + ∂
Nature of the measure of calories and implication for elasticity estimation
The consequences of the choice of the dependant variable in econometrical estimation of the demand for calories have been discussed by several authors in the past years. Discussions were about the implication of the choice of calories obtained indirectly from food purchased (commonly called calorie availability) and calories obtained directly from food consumption weighted (commonly called calorie intake) and otherwise problems related to the choice of food expenditures as a proxy of food consumption.
Most studies on total expenditure (or income) elasticity of food consumption use calorie availability as dependant variable instead of calorie intake (Bouis and Haddad, 1992). Calorie availability is obtained by converting the total quantity of food purchased, declared over a period of time by a household, into calories by using food composition tables.
Bouis and Haddad (1992) showed that calorie availability can lead to upwardly biased elasticity estimates due to possible underestimates of meals served to non family members
6 guest for the number of guest present for meals, rec for quantity of meals received from other households.
These number and quantity are converted to obtain a number of rations in respect with the value of one ration for the concerned household, and then divided by the household size.
7 dcattle1 is a dummy variable which takes the value 1 if the size of the cattle has increased and 0 otherwise.
dcattle2 is a dummy variable which takes 1 if the size of the cattle has decreased. There was a dummy variable
to know if the size of the cattle remain steady or not, but has not been put in the regression.
8
(e.g. hired workers or servants). Ohri-Vachaspati et al. (1998) found that calorie availability can also underestimate elasticity measures due to possible missing information on infrequent bulk purchases and memory lapse in recalling purchases.
Behrman and Deolalikar (1987) showed that income-food expenditure elasticity measures overestimate considerably the true nutrient elasticity due to the fact that increase in price per nutrient as income increases is ignored. Furthermore, Ohri-Vachaspati et al. (1998) explained that if the food purchases are calculated as a share of total expenditure, there may be a problem of co linearity; and then estimation of total expenditure-food expenditure elasticity raises a problem of endogeneity.
In this study, food consumption indicators are directly derived from weighted food data.
Direction of the link between total expenditure and nutrition
Some authors, who estimated income elasticity of calorie intake, examined also the direction of the link between income and nutrition: does nutrition determines productivity and hence income or income determines nutrition?
The partisans of both approaches exist. According to Subramanian and Deaton (1996), the partisans of the first approach postulate that productivity depends nonlinearly on nutrition and this relationship can predict the existence of unemployment since those who do not get enough to eat are insufficiently productive; the partisans of the second approach take nutrition to be conditioned by income and by the demand for food; the object of research of the latter approach has been the analysis of Engel functions.
Moreover, Ward and Sanders (1980) explained that the income variable is endogenous when using simple least squares to estimate income elasticity of food consumption, due to the effect of nutrient consumption on income in the case of calories and protein which relate to energy and development: “failure to meet adequate nutritional levels in gestation and through the
first 3 years of life can permanently retard physical and mental development…with the lower energy levels resulting from poor nutrition, an individual is unable to exert as much effort in his employment or job search, thus reducing his current period income” (Ward and Sanders,
1980, p. 147). These authors suggested the use of a two-stage, least square estimating technique to eliminate simultaneous-equation bias.
However, even aware of the complexity of the links between nutrition and income, for some reasons, namely transfers, loans and savings, one can think total expenditure far less subject than income, to fluctuations due to nutrition changes. Total expenditure is certainly smoother over periods than income due to the existence of coping strategies in risky environments.
4. Results
4.1. PCE elasticities
Table 3 shows the results of the ordinary least square estimates of double log demand model for log of PCCI and log of dietary diversity score. All the coefficients for lnPCE and lnPCEsqr (the quadratic term of log of PCE) are significant at least at 10%. If the coefficient for lnPCEsqr was not significant, a simple linear demand model would have been sufficient (Banks et al., 1997). Hence the results of our estimates confirm that in our case a quadratic demand is superior to a linear demand. Using the above first elasticity formula, we find an average elasticity of 0.23 and 0.13 respectively for rural and urban areas. Even these elasticities are far from being zero, they are smaller than a recent result in Africa of 0.5 found by Abdulai and Aubert (2004b) in average for Tanzanian households. Average elasticities estimated by category of PCE show a decrease when PCE increases: estimates for the poorest,
intermediary and richest households9 are respectively 0.27, 0.23, 0.19 and 0.24, 0.13, 0.03 in rural and urban areas. It is likely that an increase of PCE beyond the richest households in urban areas does not result in PCCI improvement. These results are coherent with the descriptive statistics, since they confirm that as PCE increase, households substitute progressively quality (more refined and processed food with higher price per calorie) to quantity.
The PCE elasticity of dietary diversity is 0.19 and 0.13 in average respectively in rural and urban areas. This means that as their PCE improves, households’ diets are slightly more diversified. Estimates for the poorest, intermediary and richest households are respectively 0.23, 0.20, 0.16 and 0.17, 0.13, 0.09 in rural and urban areas. For the richest households in urban areas, it is likely that that an increase of PCE does not result in a diet more diversified, probably because they already have a highly diversified diet.
Table 3 : OLS estimates of double log calorie and dietary diversity score regressions with other covariates10
Rural Urban Rural Urban
lnPCE 1.012* 2.400*** 0.959* 0.975*** (2.33) (4.92) (2.57) (5.09) lnPCEsqr -0.0340 -0.0954*** -0.0331* -0.0354*** (-1.81) (-4.71) (-2.05) (-4.47) lnhsize -0.153*** -0.165*** 0.0365*** 0.0711*** (-9.94) (-9.55) (3.38) (7.37) hhschool -0.0452 0.0116 0.0473* 0.0229** (-1.57) (0.63) (2.16) (2.61) guest -0.190*** -0.226*** 0.0694* 0.0248 (-7.10) (-8.13) (2.54) (1.57) rec -0.168 0.0513* -0.0794 0.00626 (-1.80) (2.04) (-1.32) (0.71) health -1.493** -0.114 0.775* 0.178 (-2.94) (-0.24) (2.35) (0.85) trans -0.674** -0.0674 -0.214 0.0925 (-2.67) (-0.47) (-0.89) (1.20) dcattle1 0.00290 0.00258 0.0237 -0.00893 (0.13) (0.05) (1.52) (-0.51) dcattle2 0.0249 0.0894* -0.00472 -0.0198 (1.12) (2.43) (-0.32) (-0.73) land 0.00103 0.000300 0.000404 -0.00245** (1.44) (0.11) (0.67) (-3.03) cattle -0.00901 -0.00731 -0.00967** -0.0135** (-1.53) (-0.45) (-2.60) (-2.87) smallr 0.00664 -0.00738 0.00707 0.00714 (1.22) (-0.67) (1.94) (1.34) Constant 0.916 -6.944* -4.900* -4.621*** (0.36) (-2.37) (-2.27) (-4.00) R-sq 0.327 0.259 0.294 0.316
Log PCCI Log dietary diversity score
t statistics in parentheses
* p<0.05, ** p<0.01, *** p<0.001
The presence of heteroskedasticity has been corrected using robust standard errors
9 By averaging individual elasticities in each group.
10 Although many control variables (dummy variables for ethnic groups, share of individuals under 15 years old,
share individuals above 65 years old) are significant in the regressions they are not represented in the table, because they have no direct economic interpretation.
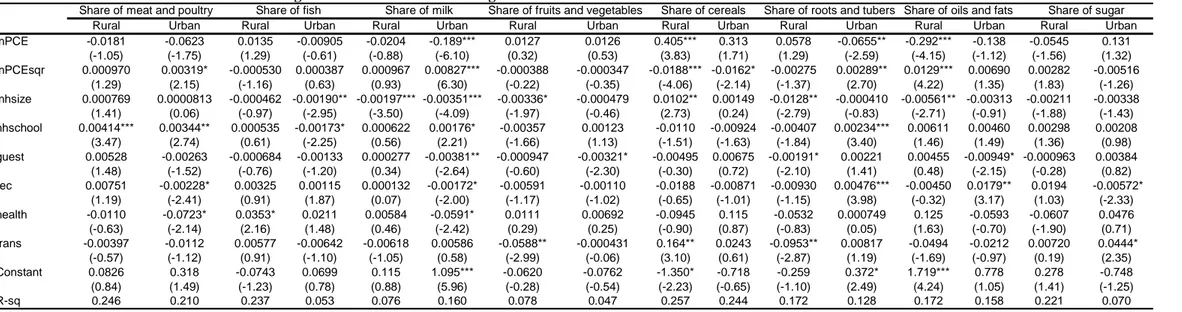
For the calorie share, the results of the estimations (table 4 in appendix) show insignificant coefficients for log of PCE and the log of the quadratic PCE term at 10% for most of the food groups, meaning an absence of linkage between PCE and share of these foods groups in calorie intake. Besides, results show that the coefficient gamma of the quadratic term of log of PCE is always significant when the coefficient beta of log of PCE is significant. This confirms the superiority of a quadratic demand equation over a linear one, for food groups too.
Using the second formula of elasticity for a semi logarithmic model with the significant beta and gamma coefficients, we find respectively in rural and urban areas an average elasticity of -0.03 and -0.07 for share of cereals in the calories, meaning a slight decrease of cereals in the total calorie consumption. This share decreases more quickly as PCE increases in rural and urban areas. Cereals constitute the most important category of food consumed by Malians, especially in rural areas where home consumption (representing almost 60% of total food consumption) is essentially made of millet, sorghum, rice and maize that are produced by households themselves. Thus, a negative elasticity is coherent with the positive elasticity found for dietary diversity.
However it seems that the slight decline of the share of the cereals in calories, is compensated only by a very slight increase of the share of meat/poultry (elasticity is 0.01 in average), milk (elasticity is 0.01 in average) and roots/tubers (elasticity is 0.001 in average) in urban areas (table 4). In urban areas, whereas the elasticity coefficient is almost steady for meat/poultry across PCE groups, we observe first a slight decrease for milk/eggs, roots/tubers for the poorest households before positive elasticities for the intermediary and richest households. Besides in rural areas, the negative elasticity of cereals calorie share seems to be compensated only by a slight increase of the oils and fats calorie share (elasticity is 0.005 in average). This elasticity is first negative for the poorest rural households and become positive for richer rural households.
4.2. Relationship between other variables and households’ food consumption Relationship between household size and households’ food consumption
We find a PCE elasticity of household size of -0.15 and -0.16 respectively for rural and urban areas, suggesting that households’ food consumption decrease with increasing household size. Subramanian and Deaton (1996) found exactly the same result. These results seem coherent as these authors explain it: large households are also those with an important share of children, and it is known that children have smaller energy needs and less calorie consumption. Although significant, the coefficient estimated for household size in the dietary diversity regression (interpretable as elasticity) is very close to zero (respectively 0.03 and 0.07 in rural and urban areas). We do not find any direct interpretation of positive sign of the relationship between dietary diversity and household size. Apart from share of cereals in the calories (in rural areas), all the significant coefficients in front of household size in the food groups’ regressions are negative. This suggests that in rural areas the share of cereals in the calories increases with PCE, and this is coherent since cereals provide cheaper calories. The addition of this result to the negative sign for the other coefficients, both in rural and urban areas, suggests clearly a substitution of cheaper calories to expensive ones as household size increases.
Relationship between education and households’ food consumption
We have introduced in the regressions a dummy variable on whether the household head has been at school or not. Estimations show non significant coefficients for calorie intake in both rural and urban areas, suggesting that the level of calorie intake in a household with a schooled head and a household with a non schooled head, are not significantly different.
However it seems that a households with a schooled head have a higher dietary diversity score, coefficients are weak but significant at 1% (respectively 0.04 and 0.02 in rural and urban areas).
By food group, positive and significant coefficients of the education of household head (as described above) in the share of meat and poultry regression in rural and urban areas, suggest that this share increases with household head education. The coefficients are also positive and significant, in the share of milk/eggs and roots/tubers regressions, in urban areas. To summarize, it is likely that household head education has at least a positive effect on the quality of households’ diet globally and the share of animal source foods, both in rural and urban areas.
Relationship between solidarity and households’ food consumption
Here we are only dealing with the solidarity between households inside the same community through the average number of guests per week for meals and the quantity of meals received from other households.
Results show a significant and negative coefficient between the number of guests and PCCI, suggesting that calorie intake decline with increasing guests. On the contrary the coefficient is significant but positive between guests and dietary diversity in rural areas. This is surprising, but suggests that households which receive most guests have a higher quality of diet.
In addition, it is remarkable to observe that the share of milk/eggs, fruits/vegetables and oils/fats in the calories, decline with an increasing number of guests, suggesting that increasing guests is prejudicial to households’ diet quality in urban areas.
The coefficient of the variable for the quantity of meal received is significant and positive in the log PCCI regression in urban areas, suggesting that gifts have a positive effect on households’ calorie intake in urban areas. This is not the case in rural areas since we observe a negative relationship between quantity of meal received and calorie intake (coefficient is significant at 10%). This suggests that in rural areas, households which receive meal gifts from other households of the community are also those which have the weakest consumption level.
There is also a negative relationship between the quantity of meal received and the share of meat/poultry, milk/eggs and sugar in the calories, in urban areas, suggesting that in these areas, households which receive meal have also worse diet quality. Only the share of roots/tubers and oils/fats seem to increase with increasing quantity of meal received in urban areas. We can also note that, in rural areas, meal gifts have no significant effect on the share of the different food groups in the calorie consumed.
Relationship between health and transportation budget shares and households’ food consumption
PCCI in rural areas decreases with increasing share of health and transportation expenditures in rural households’ total budget (estimates show significant and negative coefficients). On the contrary no relationship appears between these budget shares and PCCI in urban areas. However, the coefficient between health budget share and meat/poultry and milk/eggs in urban areas is significant and negative, suggesting that the shares of meat/poultry and milk/eggs decrease with increasing health budget share. Coefficients suggest a decrease of the shares of fruits/vegetables and roots/tubers with increasing transportation budget share in rural areas. Coefficients also suggest an increasing share of cereals in the calories with increasing transportation budget share in rural areas, implying a certain substitution of cheaper calorie to more expensive calories as transportation budget share increases.
The coefficients for per capita surface of land in PCCI regressions in rural and urban areas are not significant; suggesting no relationship between the surface of land and PCCI in rural and urban areas. Dietary diversity score seems to decrease with increasing surface of land per capita in urban areas (coefficient significant and negative). This is surprising but this is possibly due to the low dietary diversity of peasants in the suburbs of urban areas.
The coefficients for per capita quantity of cattle and small ruminants in PCCI regressions in rural and urban areas are also not significant; suggesting no relationship. But results show significant negative coefficients for per capita quantity of cattle in the dietary diversity score regressions in both rural and urban areas, suggesting that cattle breeders have a diet less diversified in general. However, in rural areas, quantity of small ruminants per capita and dietary diversity are positively related (coefficient significant at 10%), suggesting that households’ dietary diversity increases with increasing quantity small ruminants.
5. Discussion and concluding remarks
Although we find a positive and significant PCE elasticity of calorie intake and dietary diversity, especially for the poorest rural and urban households, these results show that in reality the nutritional quality of households’ diet does not significantly improve with PCE, especially in rural areas. In rural areas, diet remains particularly unbalanced as PCE increases, since the decrease of cereals calorie share is only compensated by an increasing share of oils and fats. In both areas, the share of fruits and vegetables in the calories is insensible to PCE. This study is a contribution to fill the gap in the literature on studies on the relationship between expenditure or income and food consumption in Africa, using also original food consumption indicators to better take into account diet quality, and comparing patterns of rural and urban households. It highlights the limits of households’ monetary poverty alleviation to improve their food security. In addition, our results also suggest that: urban households’ calorie intake improves with increasing transfers in kind (meals); a household with a head who has already been schooled has a better diet quality in both rural and urban areas; decreasing health pressure on urban households’ budget is accompanied by an improvement of the share of meat, poultry, milk and eggs in their total calorie consumption; and decreasing transportation pressure on rural households’ budget is accompanied by an improvement of the share of fruits, vegetables, roots and tubers in their total calorie consumption. So finally these results suggest in addition to monetary poverty alleviation that investing on education, developing public transfers in kind and reducing health and transportation costs, can also improve households food security.
References
Abdulai, A. and Aubert, D., 2004a. A cross-section analysis of household demand for food and nutrients in Tanzania. Agricultural Economics, 31(1), 67-79.
Abdulai, A. and Aubert, D., 2004b. Nonparametric and parametric analysis of calorie consumption in Tanzania. Food Policy, 29(2), 113-129.
Banks, J., Blundell, R. and Lewbel, A., 1997. Quadratic Engel curves and consumer demand. Review of Economics and Statistics, 79(4), 527-539.
Behrman, J. R. and Deolalikar, A. B., 1987. Will Developing Country Nutrition Improve with Income? A Case Study for Rural South India. The Journal of Political Economy, 95(3), 492.
Behrman, J. R. and Wolfe, B. L., 1984. More Evidence on Nutrition Demand: Income Seems Overrated and Women's Schooling Underemphasized. Journal of Development Economics, 14(1-2), 105-128.
Bouis, H. E. and Haddad, L. J., 1992. Are estimates of calorie-income fxelasticities too high?: A recalibration of the plausible range. J Dev Econ, 39, 333-364.
Favier, J., Ireland-Ripert, J., Toque, C. and Feinberg, M., 1995. Répertoire général des aliments. Composition table.[French (CIQUAL) food composition database. Book 1. General composition.] 2nd ed. Paris, France: Lavoisier, Tec&Doc.
Nordeide, M. B., 1997, Table de composition d'aliments du Mali. Instituts de Nutrition.
Ohri-Vachaspati, P., Lorge Rogers, B., Kennedy, E. and Goldberg, J. P., 1998. The effects of data collection methods on calorie–expenditure elasticity estimates: a study from the Dominican Republic. Food Policy, 23(3-4), 295-304.
Souci, S. W., Fachmann, W. and Kraut, H., 2000, Food Composition and Nutrition Tables. Stuttgart, medpharm. Scientific Publishers, CRC Press.
Strauss, J., Thomas, D., Yale, University and Center, E. G., 1990, The Shape of the Calorie-expenditure Curve. Economic Growth Center, Yale University.
Subramanian, S. and Deaton, A., 1996. The Demand for Food and Calories. Journal of Political Economy, 104(1), 133.
Teklu, T., 1996. Food demand studies in sub-Saharan Africa: a survey of empirical evidence. Food Policy, 21(6), 479-496.
Ward, J. O. and Sanders, J. H., 1980. Nutritional Determinants and Migration in the Brazilian Northeast: A Case Study of Rural and Urban Ceara. Economic Development and Cultural Change, 29(1), 141.
APPENDIX
Tableau 4 : OLS estimates of semi log food shares in the calories regressions with other covariates11
Rural Urban Rural Urban Rural Urban Rural Urban Rural Urban Rural Urban Rural Urban Rural Urban
lnPCE -0.0181 -0.0623 0.0135 -0.00905 -0.0204 -0.189*** 0.0127 0.0126 0.405*** 0.313 0.0578 -0.0655** -0.292*** -0.138 -0.0545 0.131 (-1.05) (-1.75) (1.29) (-0.61) (-0.88) (-6.10) (0.32) (0.53) (3.83) (1.71) (1.29) (-2.59) (-4.15) (-1.12) (-1.56) (1.32) lnPCEsqr 0.000970 0.00319* -0.000530 0.000387 0.000967 0.00827*** -0.000388 -0.000347 -0.0188*** -0.0162* -0.00275 0.00289** 0.0129*** 0.00690 0.00282 -0.00516 (1.29) (2.15) (-1.16) (0.63) (0.93) (6.30) (-0.22) (-0.35) (-4.06) (-2.14) (-1.37) (2.70) (4.22) (1.35) (1.83) (-1.26) lnhsize 0.000769 0.0000813 -0.000462 -0.00190** -0.00197*** -0.00351*** -0.00336* -0.000479 0.0102** 0.00149 -0.0128** -0.000410 -0.00561** -0.00313 -0.00211 -0.00338 (1.41) (0.06) (-0.97) (-2.95) (-3.50) (-4.09) (-1.97) (-0.46) (2.73) (0.24) (-2.79) (-0.83) (-2.71) (-0.91) (-1.88) (-1.43) hhschool 0.00414*** 0.00344** 0.000535 -0.00173* 0.000622 0.00176* -0.00357 0.00123 -0.0110 -0.00924 -0.00407 0.00234*** 0.00611 0.00460 0.00298 0.00208 (3.47) (2.74) (0.61) (-2.25) (0.56) (2.21) (-1.66) (1.13) (-1.51) (-1.63) (-1.84) (3.40) (1.46) (1.49) (1.36) (0.98) guest 0.00528 -0.00263 -0.000684 -0.00133 0.000277 -0.00381** -0.000947 -0.00321* -0.00495 0.00675 -0.00191* 0.00221 0.00455 -0.00949* -0.000963 0.00384 (1.48) (-1.52) (-0.76) (-1.20) (0.34) (-2.64) (-0.60) (-2.30) (-0.30) (0.72) (-2.10) (1.41) (0.48) (-2.15) (-0.28) (0.82) rec 0.00751 -0.00228* 0.00325 0.00115 0.000132 -0.00172* -0.00591 -0.00110 -0.0188 -0.00871 -0.00930 0.00476*** -0.00450 0.0179** 0.0194 -0.00572* (1.19) (-2.41) (0.91) (1.87) (0.07) (-2.00) (-1.17) (-1.02) (-0.65) (-1.01) (-1.15) (3.98) (-0.32) (3.17) (1.03) (-2.33) health -0.0110 -0.0723* 0.0353* 0.0211 0.00584 -0.0591* 0.0111 0.00692 -0.0945 0.115 -0.0532 0.000749 0.125 -0.0593 -0.0607 0.0476 (-0.63) (-2.14) (2.16) (1.48) (0.46) (-2.42) (0.29) (0.25) (-0.90) (0.87) (-0.83) (0.05) (1.63) (-0.70) (-1.90) (0.71) trans -0.00397 -0.0112 0.00577 -0.00642 -0.00618 0.00586 -0.0588** -0.000431 0.164** 0.0243 -0.0953** 0.00817 -0.0494 -0.0212 0.00720 0.0444* (-0.57) (-1.12) (0.91) (-1.10) (-1.05) (0.58) (-2.99) (-0.06) (3.10) (0.61) (-2.87) (1.19) (-1.69) (-0.97) (0.19) (2.35) Constant 0.0826 0.318 -0.0743 0.0699 0.115 1.095*** -0.0620 -0.0762 -1.350* -0.718 -0.259 0.372* 1.719*** 0.778 0.278 -0.748 (0.84) (1.49) (-1.23) (0.78) (0.88) (5.96) (-0.28) (-0.54) (-2.23) (-0.65) (-1.10) (2.49) (4.24) (1.05) (1.41) (-1.25) R-sq 0.246 0.210 0.237 0.053 0.076 0.160 0.078 0.047 0.257 0.244 0.172 0.128 0.172 0.158 0.221 0.070
Share of meat and poultry Share of fish Share of milk Share of fruits and vegetables Share of cereals Share of roots and tubers Share of oils and fats Share of sugar
t statistics in parentheses
* p<0.05, ** p<0.01, *** p<0.001
The presence of heteroskedasticity has been corrected using robust standard errors
11 Although many control variables (dummy variables for ethnic groups, share of individuals under 15 years old, share individuals above 65 years old) are significant in the