Publisher’s version / Version de l'éditeur:
International Journal of Ventilation, 1, June 1, pp. 13-22, 2002-06-01
READ THESE TERMS AND CONDITIONS CAREFULLY BEFORE USING THIS WEBSITE.
https://nrc-publications.canada.ca/eng/copyright
Vous avez des questions? Nous pouvons vous aider. Pour communiquer directement avec un auteur, consultez la
première page de la revue dans laquelle son article a été publié afin de trouver ses coordonnées. Si vous n’arrivez pas à les repérer, communiquez avec nous à PublicationsArchive-ArchivesPublications@nrc-cnrc.gc.ca.
Questions? Contact the NRC Publications Archive team at
PublicationsArchive-ArchivesPublications@nrc-cnrc.gc.ca. If you wish to email the authors directly, please see the first page of the publication for their contact information.
NRC Publications Archive
Archives des publications du CNRC
This publication could be one of several versions: author’s original, accepted manuscript or the publisher’s version. / La version de cette publication peut être l’une des suivantes : la version prépublication de l’auteur, la version acceptée du manuscrit ou la version de l’éditeur.
Access and use of this website and the material on it are subject to the Terms and Conditions set forth at
Tracer gas measurements for ventilation, air movement and air
infiltration in a four-sided atrium office building
Reardon, J. T.; Atif, M. R.; Shaw, C. Y.
https://publications-cnrc.canada.ca/fra/droits
L’accès à ce site Web et l’utilisation de son contenu sont assujettis aux conditions présentées dans le site LISEZ CES CONDITIONS ATTENTIVEMENT AVANT D’UTILISER CE SITE WEB.
NRC Publications Record / Notice d'Archives des publications de CNRC:
https://nrc-publications.canada.ca/eng/view/object/?id=711ada29-05f5-409b-866e-d76e1da2964b https://publications-cnrc.canada.ca/fra/voir/objet/?id=711ada29-05f5-409b-866e-d76e1da2964b
Tracer gas measurements for ventilation, air
movement and air infiltration in a four-sided atrium
office building
Reardon, J.T.; Atif, M.R.; Shaw, C.Y.
A version of this document is published in / Une version de ce document se trouve dans : International Journal of Ventilation, v. 1, no. 1, June 2002, pp. 13-22
www.nrc.ca/irc/ircpubs
TRACER GAS MEASUREMENTS FOR VENTILATION, AIR MOVEMENT AND AIR INFILTRATION IN A FOUR-SIDED ATRIUM OFFICE BUILDING
James T. Reardon Morad R. Atif Chia-yu Shaw
Ph.D, M.ASHRAE Ph.D, M.ASHRAE Ph.D, P.Eng., M.ASHRAE
ABSTRACT
The research described in this paper is part of a project aimed at improving energy costs and the indoor environment of atrium buildings. Tracer gas techniques were used to assess the ventilation performance in terms of air distribution and contaminant migration patterns and to measure the air infiltration rate of a three-storey atrium. This atrium serves as an entrance to a large office-laboratory complex. The results indicate that even though the HVAC systems of the test atrium are connected to the building complex, tracer gas techniques were successfully used to determine the air distribution and contaminant migration patterns, and the air infiltration rate. A detailed description of the methods used and the test results are presented
INTRODUCTION
The atrium is proliferating, with an increasing frequency, in new, renovated, and converted office and commercial buildings. This proliferation is more important in cold regions, such as Canada, where people can do their daily activities, such as banking and shopping, in a naturally-lit environment, away from the negative effects of the long and cold winter. The atrium is also a solution to reduce the pedestrian flow in overcrowded cities. These amenities have made the atrium attractive for both commercial and office buildings, and as a new element in old and historic buildings. The frontage of an atrium brings an additional view and daylight; thus, reducing electrical lighting consumption and increasing employee satisfaction.
This paper presents the results of a field study conducted in an atrium building to assess its ventilation performance in terms of air distribution and contaminant migration patterns. It also presents the measured air infiltration rate for winter conditions.
TEST ATRIUM
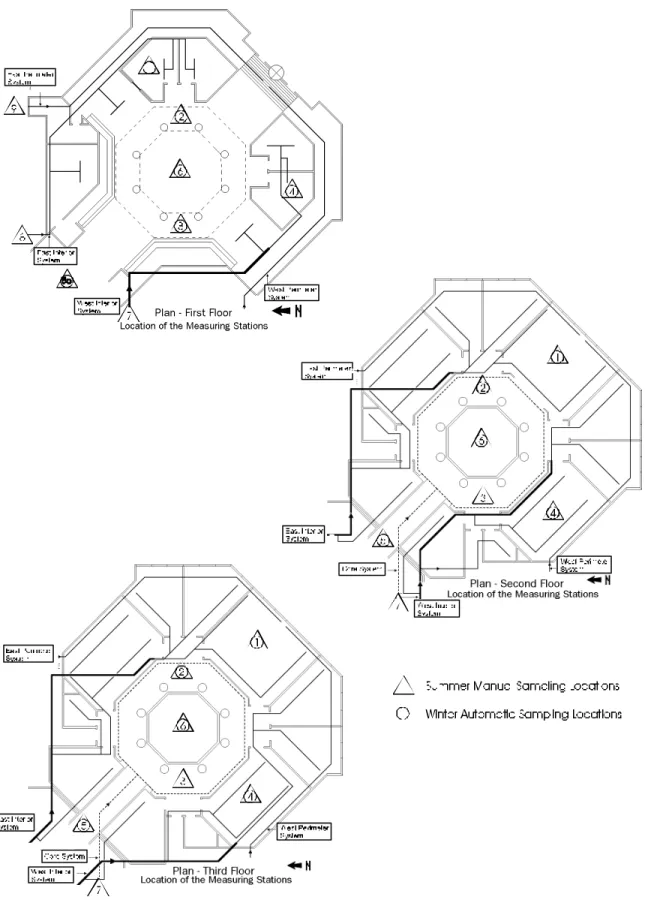
The selected atrium (Figure 1) is located in Ottawa, Canada. This three-storey atrium has an octagonal shaped floor plan and is surrounded by walkways, which lead to adjacent meeting rooms, office spaces and interview rooms. Principal access to the outdoors is through a revolving door on the ground (first) floor. Linear corridors on each floor level lead from the central core area to another five-storey atrium space which leads to other parts of the building complex.
The ground floor (F1) of this atrium houses the main building entrance and reception desk, with a total plan floor area of 421 m2. It is fairly open, with floor-to-ceiling exterior glazed surfaces forming approximately one third of the outer walls. The remaining bounding walls of this atrium separate it from other sections of the building complex. A perimeter walkway separates two pairs of interview/services rooms, on either side of the main entranceway, from this exterior glazing.
The second and third floors (F2 and F3) contain offices and conference rooms, each with one or two doors, adjacent to the atrium. These adjacent rooms are not designed to receive light from the atrium and receive daylight from their exterior fenestration. The floor plan layouts of F2 and F3 are virtually identical with total core space plan floor areas of 130 m2 each, which includes their perimeter walkway areas.
The roof of the atrium core is a glazed eight-sided pyramid. The total volume contained in the atrium core air space was calculated to be 3550 cubic metres, which includes all the space on the ground floor, the core space plus the perimeter walkway space on the F2 and F3 levels and the space contained beneath the glazed pyramid roof.
DESCRIPTION OF THE HVAC SYSTEM
Each floor level of the atrium has two interior and two perimeter systems which supply air to the atrium and its immediately adjacent spaces/rooms. Floors F2 and F3 also each have a centre core supply system. All the supply systems are all-air VAV systems. Each system that supplies ventilation air to one or more individual
zones in the atrium also supplies air to other sections of the building complex. The supply air is a mixture of outdoor air and recirculated air. The layout of these supply systems is illustrated in Figure 2.
The interior and core supply systems provide only cooling. Heating and cooling are provided by the perimeter systems. Return air is drawn through vent openings connecting the rooms and walkway areas to above-ceiling plenum spaces, and from there through the central walkway's above-ceiling plenum spaces, and ultimately into the mechanical equipment rooms located in adjacent parts of the building complex.
METHODOLOGY
Three types of tracer gas measurements (SF6) are
reported in this paper: air distribution, contamination migration, and air infiltration. The sampling locations included 9 locations on F1 and 7 each on F2 and F3. These sampling locations were mainly selected to provide the broadest indication of any nonuniformities in the spatial distribution of the tracer gas concentration (i.e., to indicate inadequate mixing). Doors of the immediately adjacent rooms on F2 and F3 were all closed for these tests. Doors of the interview rooms and cloak room on F1 were opened wide to include these room’s interior spaces in the atrium core air space, since the F1 interior systems supplied both these rooms and the open spaces on the ground floor of the atrium.
For air distribution and contaminant migration pattern tests, flow rates were measured before and after each test in the main supply ducts leading to each zone, using averaging tubes installed in straight sections of each duct to verify that conditions were the same at the end as at the start of each test. Also, the main corridors connecting the atrium to the rest of the building complex were open for these tests. For infiltration tests, temporary barriers were erected in these corridors to isolate the atrium as much as possible from the rest of the building complex.
For the summer testing period, tracer gas measurements were made using hand sampling to collect the air samples which were later analyzed in the laboratory with the gas chromatograph fitted with an electron capture detector. For the winter testing period, the gas chromatograph apparatus, together with a 16-position automatic sampling valve connected to a network of sampling pumps and tubing and a computerized data acquisition system were
installed on-site. Figure 2 illustrates the sampling locations used for these various tests.
All tests were conducted after normal office hours.
Air Distribution Patterns - The air distribution
pattern tests attempted to measure the distribution patterns of the ventilation air provided by the atrium core space supply systems on each floor, under “normal” operating conditions. The general strategy was to inject the dose of tracer gas into the supply system(s) of interest and subsequently to measure the concentration time histories at the various locations on all three levels throughout the atrium for a period of two hours following that injection. The detection of tracer gas, in terms of time and concentration, at a sampling location provides a good indication of how fast and how much supply air reaches that location. In an attempt to create fixed, constant test conditions, the thermostats were all set abnormally high or low to force the VAV systems to provide constant maximum flow rates. The duration of each test was not long enough to result in significant departures from comfortable conditions caused by these abnormal settings of the thermostats.
Contaminant Migration Patterns - The contaminant
migration pattern tests attempted to measure the distribution patterns of an airborne contaminant released at the centre of the atrium core’s ground floor. The contaminant source was simulated by the steady release of tracer gas at that central location for a total tracer gas dose equal to that used in the air distribution tests. The migration patterns of the tracer gas “contaminant” were investigated by measuring the tracer gas concentration at the various locations of interest throughout the atrium by repetitive sampling for 2 hours following the start of the tracer gas release.
Air Infiltration Rate - The tracer gas decay
technique was used to measure the air infiltration rate (ASTM 1995) for the atrium's core. The tracer dose was released using a distributed dosing scheme intended to assist its initial distribution and ultimate mixing throughout the atrium.
In addition to the sampling locations in the atrium's core air space, two sampling locations on each of the F2 and F3 levels were located within representative immediately adjacent rooms – one with an exterior wall (locations 2-1 and 3-1) and one without an exterior wall (locations 2-4 and 3-4). These four extra sampling locations were swapped into the automatic
sampling during the later monitoring period, intended to provide some indication of the exfiltration paths being followed by the tracer gas.
Various freestanding fans were deployed around the perimeter walkways and on the atrium’s ground floor level to assist the mixing of the tracer gas following the distributed dosing and the test of the distributed dosing scheme. One of the largest of these fans was even set-up to blow air directly up toward the roof glazing from the centre of the ground floor.
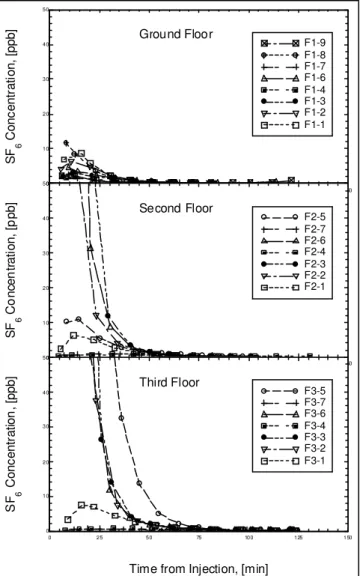
RESULTS AND ANALYSIS Air Distribution Patterns
Test B1-2-S Summer Nighttime, All HVAC
Systems On, F1 Core Systems Dosed - Figure 3
illustrates the tracer gas concentration profiles measured on the F1, F2 and F3 levels in the atrium. Tracer gas was dosed into only the two interior supply air systems for the ground floor. The results for the ground floor show that the tracer gas dose (and hence, the air supplied by the two interior systems) was very quickly distributed relatively uniformly throughout the ground floor.
The second floor results show that the tracer gas distributed relatively uniformly throughout this floor as quickly as on the ground floor. The core space locations received the most and earliest transported tracer gas. The adjacent space location (2-1) which is supplied by the same east interior supply air system as the east interior zone on F1 seems to have received the tracer gas peak a little later than the core space locations, and the return air location (2-5) tracked along with it. The results measured on the third floor indicate virtually the same air distribution patterns as on the second floor with proportionally lower concentrations, being one floor further removed from the dosed floor, F1.
Test B1-3-S Summer Nighttime, All HVAC
Systems On, F2 Core Supply Dosed - Figure 4
illustrates the tracer gas concentration profiles measured on the three floor levels in the atrium. Tracer gas was dosed into only the core supply air system on the second floor. The results for the ground floor locations show a lack of large concentration peaks in the centre of the atrium. What little tracer gas finds its way to the ground floor seems to be circulated there via the east interior supply system (1-8) shared between the east interior zones on both
F1 and F2. The tracer gas in the F1 level relatively quickly is distributed evenly throughout that level. The results do indicate that the east interior zone shares similar non-peak concentration levels as observed in the east interior adjacent spaces on both F2 (2-1) and F3 (3-1). The results measured on F2 and F3 show similar peak concentrations in their respective core spaces.
The collective results from Tests B1-2-S and B1-3-S suggest that air distribution patterns within the atrium mainly move air upwards in the core space. This conclusion is supported by the relatively low concentrations measured at F1 sampling locations, similar core space peak concentration behaviours on F2 and F3, and the high concentrations observed in the main return air flow drawn from F3 (3-5). Very little air supplied to the core on F2 and F3 migrates into the adjacent spaces on those levels.
Test B1-2-W Winter Nighttime, All HVAC
Systems On, F1 Core Systems Dosed - Figure 5
illustrates the tracer gas concentration profiles measured at automatic sampling locations on the F1, F2 and F3 levels in the atrium. Tracer gas was dosed into only the two interior supply air systems for the ground floor. The results indicate that the air distribution is relatively rapid and on the ground floor level creates a well-mixed condition as early as 40 minutes after the tracer gas injection.
The second floor results indicate that the core space on F2 almost immediately received air and its tracer gas content supplied through the ground floor’s interior supply systems, suggesting a substantial upward movement of air in the atrium core. The adjacent space location (2-1) in the east interior zone of F2 received some tracer gas earlier than the appearance of tracer gas in the F2 return air plenum (2-5) above the corridor ceiling suggesting that some air flowed directly from the core space into that adjacent space. Virtually no tracer gas entered the adjacent space location (2-4) in the west interior zone suggesting no air flowed directly from the core into that room. This also suggests that no tracer gas was recirculated from the return air plenum into the west interior and perimeter systems’ supplies. All the F2 level, except the adjacent spaces in the west interior zone became well-mixed as early as 45-50 minutes after the tracer gas injection.
The third floor results indicate very similar core space behaviour as observed on F2, further supporting the
indication of a general upward movement of air within the atrium core. In the adjacent spaces in the two interior zones on F3, there is no indication of significant airflow into those adjacent zones. All the F3 level, except the adjacent spaces in the west interior zone (3-4) became well-mixed at 50-55 minutes after the tracer gas injection.
Comparison of Winter and Summer Tests, All
HVAC Systems On, F1 Core Systems Dosed - A
comparison between the results of the two tests, B1-2-S and B1-2-W, provides the following observations. Both tests’ results indicate a dominant general upward air motion within the atrium core space, which quickly transported the tracer gas from the F1 interior “core” supply air flow to the core space on F2 and F3. The winter tests showed substantially greater peaks and quicker decays in the tracer gas concentrations, suggesting a greater total flow of air into the atrium air space than for the summer test. This could be due to air infiltration, caused by strong stack effect for the colder outdoor air temperatures. Both summer and winter results indicated very little transport of tracer gas into adjacent spaces. However, the winter results indicated even less tracer gas was transported into the adjacent spaces on both the F2 and F3 levels than in the summer test. This suggests that, despite the stronger stack effect due to the greater indoor/outdoor temperature difference, the air exfiltration leakage route was not out through the exterior envelopes of these adjacent spaces.
Contaminant Migration Patterns
Test B1-7-S Summer Daytime, All HVAC Systems
Off, Maximum Stratification - Figure 6illustrates
the tracer gas concentrations measured at sampling locations on the three floor levels in the atrium. This test was conducted during a hot, sunny summer weekend day with no HVAC systems operating in the atrium in an attempt to create maximum thermal stratification. The objective was to examine the contaminant migration patterns from the point source for conditions likely to be the maximum thermal stratification in the core air space.
The results for F1 indicate that virtually none of the tracer gas migrated into the connecting corridor. Not surprisingly, large fluctuations in concentration were observed at the centre sampling location positioned just 0.5 m below the point source. The values of the off-scale peak concentrations are indicated as
annotations in the graph. A generally steady increasing trend was observed in the concentrations (1-1 and 1-2) measured in the zone that is normally supplied by the east interior system. Somewhat less steady increasing trends but generally larger concentrations (1-3 and 1-4) were observed in the west interior zone.
The results for F2 indicate that the tracer gas migrated relatively uniformly to the locations in the atrium core and the corridor. The contaminant migration was slower and smaller, but generally steadier, into the adjacent spaces of the east (2-1) and west (2-4) interior zones. The more erratic general increase of concentration at the core locations suggests a turbulent natural convection flow existed in the core space under these conditions. The migration into the corridor may suggest that some air flowed from the core through the corridor into the rest of the building. The results for F3 indicate that the tracer gas migration was even more uniform to the locations in the atrium core and the corridor than on F2. The contaminant migrations into adjacent spaces (3-1 and 3-4) were also more uniform in their slower, steadier and smaller increases in concentration. The migration airflows seem to have well mixed the contaminant throughout the core air space on F3.
Test B1-6-S Summer Daytime, All HVAC Systems On - Figure 7illustrates the tracer gas concentrations measured at sampling locations on the F1, F2 and F3 levels in the atrium. This test was conducted during a hot, sunny summer day with all the HVAC systems operating at maximum flow rates in the atrium. The objective of this test was to examine the contaminant migration patterns from the point source for conditions subject to the maximum cooling loading in the core air space that could exist with the HVAC systems operating to combat a tendency toward thermal stratification in the atrium.
The results for F1 indicate that the tracer gas distributed relatively uniformly throughout the core air space. The interview room supplied by the east interior system was the exception in that it received an early portion of the contaminant which subsequently decayed indicating that no air flowed into that room directly from the open foyer space.
The results for F2 indicate that the tracer gas migrated relatively uniformly within the core air space, except that the concentrations at the centre location are lower
than those in the core’s perimeter walkway and in the return air plenum above the corridor. The tracer gas migrated into the adjacent room, supplied by the east interior and perimeter systems, at concentrations slightly greater than those measured in the core space. The tracer gas also migrated into the adjacent room (2-4) supplied by the west interior and perimeter systems. Since the concentrations measured in the east adjacent space (2-1) are larger than and lead those measured in the return plenum, recirculation into the east supply systems does not seem to have been the principal route by which the tracer gas migrated into the east adjacent zones.
The results for F3 indicate that the tracer gas migrated even more uniformly within the core air space than on F2.
It is important to note that the concentrations measured on all three floor levels in the B1-6-S test with HVAC operation were approximately 5-10 times smaller than those measured in the B1-7-S test with no HVAC operation, despite a source with twice the release rate and total dosage. This was probably due to the HVAC operation causing a rapid dilution and removal of the airborne contaminant, both by its outdoor air supply fraction and by its exhaust. As well, indoor air recirculated from other sections of the building uncontaminated by tracer gas would also have contributed to this dilution. This suggests that the HVAC systems are quite effective at removing airborne contaminants. The results illustrated in Figures 6 and 7 indicate that the airflow patterns transporting airborne contaminants are much more irregular when dominated by natural convection (without HVAC operation) than when the HVAC operation apparently dominates the airflow patterns in the atrium.
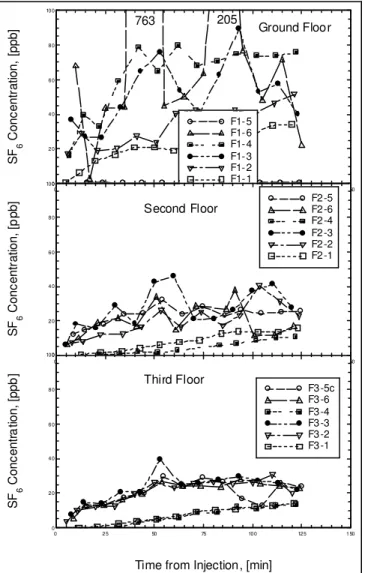
Air Infiltration Rate
Test B1-1-W Winter Daytime, All HVAC Systems
Off, Corridors Sealed - Figure 8 shows the
concentrations measured at all the various sampling locations during the winter air infiltration test. The vertical line indicates the time, 115 minutes after the start of the tracer gas dose injection, when the operation of the mixing fans' was started. The average indoor and outdoor air temperatures during this test were TIN = +23.3C and TOUT = -8.5C. Several
observations are immediately apparent. First, except for a few sampling locations, most of the atrium space
was relatively well-mixed as early as 50 minutes following injection, and the measured concentration decay data could be used to determine an air change rate for the air space. Second, the impact of operating the mixing fans was to create a spatially very uniform tracer gas concentration throughout the atrium air space as early as 20 minutes following their start-up. Third, the checks for migration of the tracer gas into the closed rooms adjacent to the atrium core indicated very little or no airflow into those rooms from the core (locations 2-1, 2-4, 3-1, and 3-4, sampled for times between 189 and 217 minutes after injection).
Despite the indications in Figure 8 that there may be different decay rates before and after the mixing fans were started, a single exponential curve was fitted mathematically using non-linear regression techniques to all the measured data, after 60 minutes initial mixing. The curve fit calculation results provide an air change rate of 1.19 h-1. When the outlier locations’ data and the migration-check data (2-1, 2-4, 3-1 and 3-4) are omitted from the curve fit the resulting air change rate is 1.22 h-1. Therefore, in practical terms, the two curve fit results are the same, a measured air change rate of 1.2 h-1. Curve fits to the data (with outliers and migration-check data removed) measured before and after the fans were started provide air change rates of 1.25 h-1 without and 1.05 h-1 with supplementary mixing.
The operation of the mixing fans was originally intended as a contingency plan to evenly distribute the initial tracer gas dose throughout the space for the calculation of an air change rate. As the measured results have indicated, the distributed dosing scheme created a reasonably uniform spatial distribution of concentration throughout the atrium core, sufficiently so for an air change rate to be successfully calculated. Also, the air change rate calculated from the data measured while the mixing fans were not operating (1.25 h-1) compares within a few percent with the air change rate calculated using all the measured data, both without and with the mixing fans operating. Therefore, the air change rate calculated from the data measured while the mixing fans were not operating, 1.2 air changes per hour, may reflect closely the actual air change rate in the atrium core for no mechanical ventilation systems operating and for the weather conditions prevailing during the test.
CONCLUSIONS
The tracer gas techniques applied here were successful in helping understand the air distribution patterns created by the building’s HVAC systems in the atrium and the patterns of migration of an airborne contaminant released at the centre of the atrium’s ground floor level. With specific regard to this building, the following conclusions can be drawn from the measured data and their analysis as presented and discussed above.
Air Distribution Patterns - The summer air
distribution tests suggest a general upward air movement within the centre core of the atrium, accompanied by good mixing throughout each floor’s perimeter walkway areas and its centre core area. Air supplied to the ground floor core area becomes transported upward and distributed around the upper two floors’ core and perimeter walkway areas. Air supplied to the core of the second and third floors becomes mixed throughout their respective floor levels and any floor level above but does not reach the ground floor of the atrium. The core air supplies on the second and third floors provide good air distribution around their respective perimeter walkway areas. Very little of the air supplied to the core areas on any of the floors finds its way into the adjacent rooms when their doors are closed, except by recirculation into supply systems which are shared between core spaces and adjacent spaces. The zonal distinctions are quite clear.
Contaminant Migration Patterns - The summer
daytime contaminant migration test for maximum stratification conditions with all the HVAC systems not operating indicated a general upward flow of air in the atrium centre core, with more uniform spatial concentration (i.e., better mixing) of the contaminant as height above the atrium floor increased. The upward movement of air in the core was accompanied by air flowing into the atrium from the rest of the building through the ground floor’s connecting corridor and out from the atrium into the rest of the building through the third floor’s connecting corridor. The contaminant also effectively migrated into closed adjacent rooms.
The operation of the HVAC system provided a rapid removal of the steadily released tracer gas contaminant compared to the maximum stratification test with no HVAC systems operating. This was despite obvious recirculation of the contaminant
through the supply systems on all three floor levels. The general upward movement of air in the atrium centre core transported the contaminant from the atrium floor to the upper levels, where its spatial distribution became more uniform with increasing height. The contaminant also effectively migrated into closed adjacent rooms.
Air Infiltration Rate - The strategy to distribute the tracer gas dose on each floor level, both directed into the centre core space and along the perimeter walkways was successful at creating a sufficiently uniform spatial distribution of tracer gas concentration for calculating an air change rate value from its time decay.
The operation of the mixing fans, deployed to circulate air within the centre core and around the perimeter walkways on each floor level, created a very uniform tracer gas concentration throughout the atrium air space within less than 30 minutes after their start-up. Their effect on the spatial distribution of concentration was almost immediate in the measured results.
Very little tracer gas migrated into the adjacent rooms on the upper floors of the atrium. The air change rate for the atrium space calculated from the decay with no mixing fans operating, was 1.2 air changes per hour, on a cold winter day in Ottawa.
ACKNOWLEDGEMENTS
The support of the project by the following organizations is gratefully acknowledged: Société Immobilière du Quebec, Public Works and Government Services Canada, Natural Resources Canada / CANMET, Hydro-Québec, and the Institute for Research in Construction of the National Research Council of Canada. The following people also contributed to the accomplishment of the project: Robert MacDonald, Marcel Brouzes, Robert Magee, Robert Evans, Lloyd McSheffrey, Hugo Carriere, Dion Hanrahan, and Jacques Vincelette – all of NRC; and Vince Minichilli, Dominique Godin, and Joey Naccarello of Nortel Networks Ltd. Their individual and collective contributions are gratefully acknowledged.
REFERENCES
ASTM. 1995. Standard E741-95 “Standard Test Method for Determining Air Change in a Single Zone by Means of a Tracer Gas Dilution.” American Society for Testing and Materials, West Conshohocken, PA.
Figure 2. Manual and Automatic Tracer Gas Sampling Locations for Summer and Winter Tests and Diagram of HVAC Systems’ Layout in the Atrium
0 10 20 30 40 50 0 25 50 75 100 125 150 F1-1 F1-9 F1-8 F1-7 F1-6 F1-4 F1-3 F1-2 Ground Floor S F 6 C on c en tr a ti on , [ppb ] 0 10 20 30 40 50 0 25 50 75 100 125 150 F2-5 F2-7 F2-6 F2-4 F2-3 F2-2 F2-1 Second Floor S F 6 C o n cen tr a ti on , [p pb ] 0 10 20 30 40 50 0 25 50 75 100 125 150 F3-5 F3-7 F3-6 F3-4 F3-3 F3-2 F3-1 Third Floor
Time from Injection, [min]
S F 6 C on c en tr a tion , [ppb ]
Figure 3. Tracer Gas Results of Test B1-2-S: Summer Air Distribution, All HVAC Systems On, F1 Dosed
0 10 20 30 40 50 0 25 50 75 100 125 150 F1-9 F1-8 F1-7 F1-6 F1-4 F1-3 F1-2 F1-1 Ground Floor S F 6 C on c en tr a ti on , [ppb ] 0 10 20 30 40 50 0 25 50 75 100 125 150 F2-5 F2-7 F2-6 F2-4 F2-3 F2-2 F2-1 Second Floor S F 6 C o n cen tr a ti on , [p pb ] 0 10 20 30 40 50 0 25 50 75 100 125 150 F3-5 F3-7 F3-6 F3-4 F3-3 F3-2 F3-1 Third Floor
Time from Injection, [min]
S F 6 C on c en tr a tion , [ppb ]
Figure 4. Tracer Gas Results of Test B1-3-S: Summer Air Distribution, All HVAC Systems On, F2 Dosed
0 10 20 30 40 50 0 25 50 75 100 125 150 F1-5C F1-6 F1-4 F1-3 F1-2 F1-1 Ground Floor S F 6 C on c en tr a ti on , [ppb ] 0 10 20 30 40 50 0 25 50 75 100 125 150 F2-5 F2-6 F2-4 F2-2 F2-1 Second Floor S F 6 C o n cen tr a ti on , [p pb ] 0 10 20 30 40 50 0 25 50 75 100 125 150 F3-5 F3-6 F3-4 F3-2 F3-1 Third Floor
Time from DAS Start, [min]
S F 6 C on c en tr a tion , [ppb ]
Figure 5. Tracer Gas Results of Test B1-2-W: Winter Air Distribution, All HVAC Systems On, F1 Dosed
0 20 40 60 80 100 0 25 50 75 100 125 150 F1- 5 F1- 6 F1- 4 F1- 3 F1- 2 F1- 1 Ground Floor 205 763 S F 6 C on c en tr a tion , [ppb ] 0 20 40 60 80 100 0 25 50 75 100 125 150 F2 -5 F2 -6 F2 -4 F2 -3 F2 -2 F2 -1 Second Floor S F 6 C on c en tr a tion , [p pb ] 0 20 40 60 80 100 0 25 50 75 100 125 150 F3 -5c F3 -6 F3 -4 F3 -3 F3 -2 F3 -1 Third Floor
Time from Injection, [min]
S F 6 C on c en tr a tion , [ppb ]
Figure 6. Tracer Gas Results of Test B1-7-S: Summer Contaminant Migration, All HVAC Systems Off –
0 10 20 30 40 50 0 25 50 75 100 125 150 F1-9 F1-8 F1-7 F1-6 F1-4 F1-3 F1-2 F1-1 Ground Floor 134 1157, 539, 54, 58, 852 60, 1959, 1583 S F 6 C on c en tr a ti on , [ppb ] 0 1 2 3 4 5 6 7 8 9 10 0 25 50 75 100 125 150 F2-5 F2-7 F2-6 F2-4 F2-3 F2-2 F2-1 Second Floor S F 6 C o n cen tr a ti on , [p pb ] 0 1 2 3 4 5 6 7 8 9 10 0 25 50 75 100 125 150 F3-5 F3-7 F3-6 F3-4 F3-3 F3-2 F3-1 Third Floor
Time from Injection, [min]
S F 6 C on c en tr a tion , [ppb ]
Figure 7. Tracer Gas Results of Test B1-6-S: Summer Contaminant Migration, All HVAC Systems On –
Daytime Solar Cooling Load
0 50 100 150 200 250 300 350 0 50 100 150 200 250 time=115 1-4 1-1 3-4/3 2-4/3 1-3 3-2/1 2-2/1 1-2 1-6 2-6 3-6 S F6 C on c en tr a tio n , [ppb ] 10 100 1000 0 50 100 150 200 250 time=115 1-4 1-1 3-4/3 2-4/3 1-3 3-2/1 2-2/1 1-2 1-6 2-6 3-6
Time from Start of Injection (actual), [min]
S F6 C on c en tr a tio n , [ppb ]
Figure 8. Tracer Gas Results of Test B1-1-W: Winter Air Infiltration, All HVAC Systems Off , Corridors