A Capital Equipment Capacity Planning Methodology for Aerospace Parts
Manufacturing in a High-Mix, Low Volume Environment
by
Matthew A. Reveley
B.S. Mechanical Engineering, Tufts University, 2006
Submitted to the MIT Sloan School of Management and the Department of Mechanical Engineering in Partial Fulfillment of the Requirements for the Degrees of
Master of Business Administration and
Master of Science in Mechanical Engineering
In conjunction with the Leaders for Global Operations Program at the Massachusetts Institute of Technology
June 2012
C 2012 Matthew A Reveley. All rights reserved.
ARCHIVES
MA SSACHUSErIS IN3TITUT
0 F EC 0 L 0 GY
JUN
14 201
LEFA
R
IES
The author hereby grants to MIT permission to reproduce and to distribute publicly paper and electroniccopies of this thesis document in whole or in part in any medium now known or hereafter created. .1 v - 1
Signature of Author
Certified by
MIT Sloan School nt, Department of Mechanical Engineering
May 11, 2012
David Hardt, Thesis Supervisor Ralph E. and Eloise F. Cross Professor of Mechanical Engineering
Certified by
Roy Welsch, Thesis Supervisor Eastman Kodak Leadyrs for Gloal (perations Professor of Managementeays o 9p Ro Wesc, Tesi Suervso Accepted by
Maura Herson, Director of 1IiT Sloan MBA Program
)f% MIT Sloan School of Management
bavid Hardt, Chairman of the Committee on Graduate Students Department of Mechanical Engineering Accepted by
A Capital Equipment Capacity Planning Methodology for Aerospace Parts
Manufacturing in a High-Mix, Low Volume Environment
by
Matthew A. Reveley
Submitted to the MIT Sloan School of Management and the Department of Mechanical Engineering on May 11, 2012 in Partial Fulfillment of the Requirements for the Degrees of Master of Business
Administration and Master of Science in Mechanical Engineering
Abstract
A static capacity planning model was developed and tested following a four-phased framework. This model was developed for the purposes of capital planning for capacity requirements at a large aerospace parts manufacturing plant. Implications for capacity planning of the nature of the aerospace industry, as well as the company and plant being studied are discussed, as well as the current state of capacity planning.
In phase I of model development, an appropriate modeling solution is selected. In phase II, information is collected from the user base as to the desired user experience and functionality of the model, as well as the parameters that should be considered in it. Phase III involves assessment of the parameters' impact on capacity, and identification of appropriate data sources to feed the model. Additionally, phase III
recommends changes to current data structures in order to optimize the balance of model accuracy with minimal incremental resource allocation. In phase IV, the mathematical model is explained, and the user
interface is developed. With a working model, the results are validated with the shop floor, identifying gaps in data sources previously unobservable.
Following model development and validation, the model is applied to a subset of the shop, and used to develop recommendations for addressing predicted future capacity constraints. Application of the model reveals a blind spot in current heuristics-based planning, where high development loads can lead to immediate capacity constraints, but effects of the experience curve can actually cause this constraint to disappear on its own, without the need for excess equipment purchases.
Finally, extensions of the research and lessons learned are discussed, suggesting future project work within the plant studied, as well as elsewhere in the company and in other companies or plants.
Thesis Supervisor: David Hardt
Title: Ralph E. and Eloise F. Cross Professor of Mechanical Engineering Thesis Supervisor: Roy Welsch
Acknowledgments
The author would like to thank first and foremost his colleagues and advisors, as well as the staff and faculty at MIT, the Sloan School, and the Leaders for Global Operations program and alumni. Specifically, the author would like to recognize: Professors Roy Welsch and David Hardt for their guidance and for multiple treks up to Maine; Don Rosenfield, Jane Deutsch, Ted Equi, Jeff Shao, Patty Eames and the rest of the LGO administration for their endless patience and diligence; Jeremy Lieberman, Christina Williams and Jason Chen for their input, advice and support.
Additionally, gratitude is due to United Technologies, Pratt and Whitney, and the North Berwick Parts Center for their support of the LGO program and for sponsoring this internship and being gracious hosts. Specifically, thanks go to: Mike Newsky, Mike Papp, Steve Ruggiero and Chris Karcher for their support of the project, and for their endless wealth of knowledge; Ron Boone, Gino Veneroni, Kerry Thompson, Pat McKenna, Wayne Sevigny, Ken Allen and Colin Claffey for their levity, knowledge, and patience; Mariam Correa for her overwhelming support and enthusiasm; Wade Maynard, Pat Reagan, Dick McDonald, Ty Cryer, Keith Pooler, Mac Mann, Ken Dickie, Steve Mongiat, Mike Macmahon, Rene
Thibeault and Dave Cote for their time, effort, and humor.
Table of Contents
A b stra c t ... 3
Acknow ledgm ents... 5
Table of Contents...7
List of Figures & Tables ... 10
I Chapter 1 - Introduction and Thesis Overview ... 12
1.1 Strategic Capacity Planning in M anufacturing Organizations... 12
1.2 Static Capacity M odeling... 14
1.2.1 Phase I - Selection of M odeling Solution... 14
1.2.2 Phase II - User Requirem ents Specification... 15
1.2.3 Phase III - Design of Data Structure and Inform ation Flow ... 15
1.2.4 Phase IV - Implem entation and Validation ... 15
1.3 Thesis Overview ... 16
2 Chapter 2 - State of Capacity Planning at the North Berwick Parts Center ... 17
2.1 Relevant Industry Background... 18
2.1.1 M arket Forces ... ... ... 18
2.1.2 Industry Structure... ... 19
2.1.3 Implications for Capacity Planning... 20
2.2.1 Engine M anufacturing... 22
2.2.2 Spares M anufacturing ... 23
2.2.3 M anagem ent and Inforn ation System s... 24
2.2.4 Implications for Capacity Planning... 25
2.3 The North Berwick Parts Center ... 26
2.3.1 M anagem ent Structure ... 27
2.3.2 OEM Parts M anufacturing at NBPC... 29
2.3.3 Developm ent at NBPC... 32
2.3.4 M aintenance, Repair, and Overhaul Business at NBPC ... 33
2.3.5 Implications for Capacity Planning... 34
2.4 Capital Procurement and Strategic Capacitation... 35
2.4.1 Capital Project Planning and Budget Approval ... 36
2.4.2 Implications for Capacity Planning... 37
2.5 Capacity Planning Process... 38
3 Chapter 3 - Phase I: Selection of M odeling Solution... 40
4 Chapter 4 - Phase II: User Requirem ents Specification ... 42
4.1 User Experience ... 42
5 Chapter 5 - Phase III: Design of Data Structure and Information Flow... 52
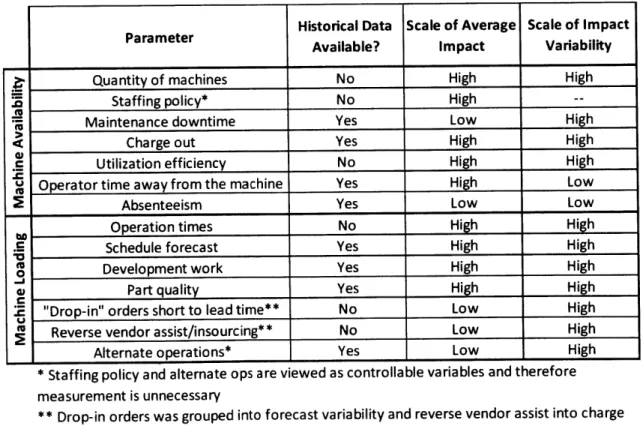
5.1 Param eter Im pact Analysis ... 54
5.2 Data Sources and Flow s... 67
6 Chapter 6 - Phase IV : Implem entation and Validation ... 68
6.1 U ser Interface Im plem entation... 68
6.2 M athem atical M odel Im plem entation... 73
6.3 M odel V alidation ... 81
7 Chapter 7 - Application in Business Unit 840... 84
7.1 Hot Sheet Analysis and Validation... 84
7.2 Deep Dive A nalysis and Solution Developm ent... 86
8 Chapter 8 - Lessons Learned and Extensions... 90
8.1 Lessons Learned...90
8.2 Recom m endations for Future W ork... 91
9 Exhibits and Appendices...92
9.1 Exhibit 1... 93
9.2 Exhibit 2...94
9.3 Appendix A - Acronym Definitions ... 96
List of Figures & Tables
Figure 1 - Sample Model Decision Aid (1 79705B-8109)... 17
Figure 2 - NBPC Organizational Chart ... 28
Figure 3 - Module Center Capital Procurement Process ... 36
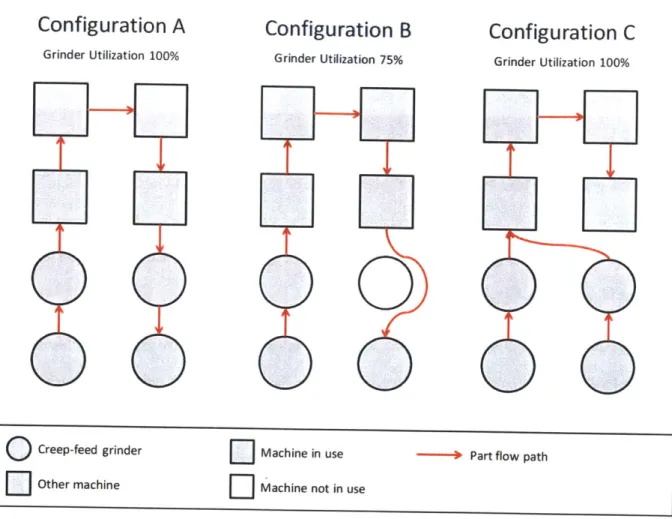
Figure 4 - Basic Cell Layouts, BU 850 Creep-Feed Grinders... 48
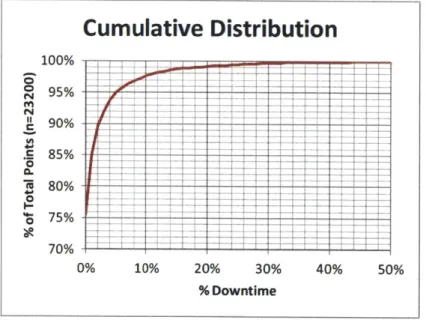
Figure 5 - Cumulative Distribution of Machine Downtime as % of Monthly Availability ... 56
Figure 6 - Quantile Plots by Business Unit of Monthly Charge-Out vs. Normal Distribution ... 57
Figure 7 - Quantile Plots by Business Unit of Monthly DCI vs. Normal Distribution ... 59
Figure 8 - Aggregate Realized Forecast Inaccuracies by Horizon...62
Figure 9 - Cumulative Distribution of Operation Scrap Factor as a % of Delivered Parts ... 65
Figure 10 - Data Sources for Prototype Model ... 67
Figure 1 - Sample Plant-Wide Constraint Report... 70
Figure 12 - Sam ple U ser Input Table ... 72
Figure 13 - Learning Curve Parameter Fit ... 81
Figure 14 - Current Loading Model Validation Data... 83
Figure 15 - Initial Hot Sheet Results, Unit 840... 85
Figure 16 - Constraints for Deep Dive Analysis, Unit 840... 86
Figure 17 - Short-Term Work Redistribution... 87
Figure 18 - Projected Impact of Current Capital Plan...88
Figure 19 - Alternative Scenario Recommendation... 89
Table 1 - Pratt & Whitney's Major Gas Turbine Engine Products (Pratt and Whitney, 2011)...22
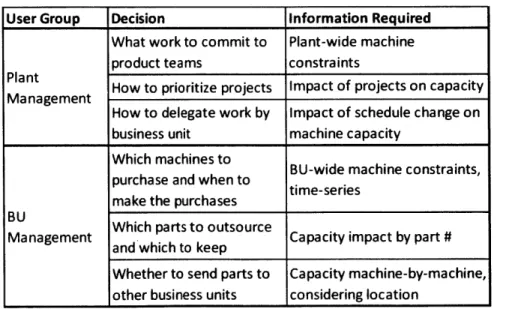
Table 3 - Critical Management Machine Capacity Decisions... 43
Table 4 - Factors Affecting Capacity ... 45
Table 5 - Hypothetical W ork Center Configuration... 49
Table 6 - Summary of Parameter Impact Analysis ... 53
Table 7 - P-Values from Student's T-Test Comparing Monthly BU Charge-Out ... 58
Table 8 - Parameter Data Automation Requirements...66
Table 9 - Machine Availability Variable Definitions... 73
Table 10 - Maintenance Downtime Variable Definitions ... 74
Table 11 - Machine Load Variable Definitions...76
Table 12 - Quality/If-Necessary Factor Variable Definitions ... 77
Table 13 - Development Batch Inflation Factor Variable Definitions ... 79
Table 14 - Validation Data Collection Method... 82
1 Chapter 1
-
Introduction and Thesis Overview
Virtually all large manufacturing organizations are faced with difficult decisions regarding the investment of capital in manufacturing equipment. For capital-intensive industries such as aerospace, understanding and quantifying the risks associated with these investments, and the demands driving the need for
investment are critical to a firm's success. (Vranakis & Chatzoglou, 2012) These challenges are amplified as the manufacturing environment becomes more complex.
Aircraft engine part manufacturing represents an archetypal example of a high-complexity heavy manufacturing environment, characterized by an extremely diverse product portfolio with relatively low part-by-part volumes. This complexity vastly increases the amount of data that is necessary to fully characterize the manufacturing system. Unfortunately, not all of this information is relevant to the business' day-to-day decision making, so there is a diminishing and eventually negative marginal benefit to monitoring and controlling each subsequent parameter. To deal with this problem, large manufacturing organizations pick and choose the degree to which the myriad parameters of the system are monitored and controlled based upon their relative utility and perceived impact on relevant decisions.
This thesis seeks to apply a structured approach to developing an extensible tool for understanding capital equipment capacity for the purposes of long-term capital planning, while operating under the constraints of a high-complexity manufacturing environment. Through this process, organizational "blind spots" are identified upon which poor investment decisions can be made without the aid of such a tool.
1.1
Strategic Capacity Planning in Manufacturing Organizations
Capacity planning has been extensively studied as it relates to investment decision-making in
manufacturing industries. Specifically, there has been extensive research into the application of capacity planning methodologies in the semiconductor manufacturing industry, where capacity expansion can cost
firms billions of dollars. (Geng & Jiang, 2009) Geng et. al. evaluated a host of capacity planning methodologies for the semiconductor industry, including static capacity modeling, the "neighborhood
search method", and applications of linear and stochastic programming. A static capacity model is aggregated, and, while fairly easy to use, may be subject to substantial inaccuracy due to this aggregation. Neighborhood search methods attempt, through trial and error within a simulated environment, to identify the optimal investment strategy by evaluating small incremental changes around the current strategy. By contrast, mathematical programming uses mathematical modeling to systematize the optimization process in order to evaluate the full investment space.
Tenhi5l et. al. assess various planning methodologies' efficacy depending upon the type of process under consideration. Four types of processes are assessed, "job shops", "batch processes", "batch processes with bottleneck control", and "production lines", organized in decreasing order of complexity. Planning
methodologies assessed are "rough-cut capacity planning", "capacity requirements planning", "finite loading with capacity leveling" and "finite loading with optimization", in order of increasing
sophistication. It is suggested that rough-cut capacity planning, or looking at high-level aggregate data, is most effective for job shops characterized by extremely high mix, low-volume manufacturing with pooled resources. Secondly, it is suggested that batch processes, characterized by high-mix low-volume
production with some task interdependence as seen in mixed-model cellular shops, are best suited for capacity requirements planning, enabling planning for individual machine or aggregate labor capacities. Finally, Tenhiala et. al. suggest that the most sophisticated methods of finite loading with capacity leveling or optimization (which enable planning for shift schedules and setup time reductions as well as jig and tool capacities) are best suited to the least complex environments such as batch processes with bottleneck control where overall rate is determined by a single asset, and production lines, where tasks are completely sequential. (Tenhiali, 2011)
For aerospace parts manufacturing at Pratt and Whitney's North Berwick Parts Center, a static model is built and implemented using the methodology proposed by Ozturk et. al. This model is built for
Tenhiala's capacity requirements planning capability, since the environment is best described as a "batch process". From the static model, a basic capacity planning method is applied using the neighborhood
search methodology studied by Geng et. al. with very basic stochastic modeling used to guide manual scenario testing and analysis. This methodology was selected because of the ease of use of a static model, combined with the existing shop floor planning process, built upon local specialized process knowledge.
This approach also carries the smallest technical hurdles for implementation. Due to the high-mix, low-volume manufacturing environment at the North Berwick Parts Center and the high degree of flexibility inherent in the system for process adjustments, keeping the process of capacity planning primarily manual enables incremental improvement over the existing framework for decision-making. Implementing a fully automated system optimization model would be not only an extremely difficult undertaking owing to the high level of complexity and extremely large number of decision variables; it would also represent a substantial organizational change, significantly increasing the barriers to adoption.
1.2 Static Capacity Modeling
Ozturk et. al. propose a four-phased approach to developing a static capacity model within a manufacturing organization. These phases are as follows:
I. Selection of Modeling Solution II. User Requirements Specification
III. Design of Data Structure and Information Flow
IV. Implementation and Validation (Ozturk, Coburn, & Kitterman, 2003)
This approach is applied through model validation, and tested within a subset of the plant's manufacturing organization.
1.2.1 Phase I - Selection of Modeling Solution
During the modeling solution selection phase, the proper mode of implementation must be selected. For example, in some situations a model can be implemented within existing software, or an off-the-shelf
solution can be purchased. In others, however, situational considerations may dictate that a standalone model should be developed.
If a standalone solution is deemed to be the best option, then a platform must be selected, as well as a mode of deployment. Depending upon the structure of the organization, deployment may need to happen
at a different level, or at multiple levels simultaneously. For example, if deployment is to happen within a production analytics department, then the solution may be able to push more of the analytical design onto the user, opting for a more flexible solution with a higher degree of customization. Alternatively, if day-to-day use is to be left to a capital planning department, or to upper management, the operational analytics may need to be more constrained in order to simplify the user experience.
1.2.2 Phase II - User Requirements Specification
Once a solution and platform have been selected, the target users' specific requirements must be determined. This specification should include not only critical parameters for the model, but also the
degree of simplicity and range of capability required, as well as aspects of the user experience. User requirements can be broken down into two primary sub-tasks, determination of user requirements for functionality, and determination of expectations for user experience. It is of critical importance that any tool be designed based upon a target user experience, and that this step be continuously revisited throughout the course of model development in order to maximize the chances of adoption.
1.2.3 Phase III - Design of Data Structure and Information Flow
Once the user specifications have been determined, they must be distilled into a mathematical model, mapping the process of the conversion of the required inputs to the required outputs. In this phase,
discrepancies between existing data sources and sources required to meet user specifications are identified, and must be addressed either through the inception of tandem projects to create or update the sources available, or by adjustment of the user specifications.
The first three phases encompass the design and specification of a capacity model. This final phase involves the actual creation of the model, validation of its outputs, and the improvement process of using shop-floor feedback to improve the accuracy of the model. Until the model is validated, it cannot
reasonably be used as a decision aid. Additionally, the user interface can be developed here, as well as the format in which data will be presented. The process of validating and updating the model based upon shop-floor feedback can force iteration of all three previous phases of model development. However, with careful execution of the first three phases, this may not be necessary.
1.3 Thesis Overview
The research for this thesis was conducted by applying this four-phased framework to the development of a capacity planning model for Pratt and Whitney's North Berwick Parts Center. Chapter 2 reviews relevant industry, company, and plant background information, and how these factors lead to the current
state of capacity planning in North Berwick. Chapters 3 - 6 walk through the four phases of model development in-depth, and how they were applied through data collection and analysis to the company. Chapter 7 discusses the results obtained through application of the model. Finally, Chapter 8 reviews lessons learned and suggests extensions of this research both in scope within the same plant, and to other plants and industries.
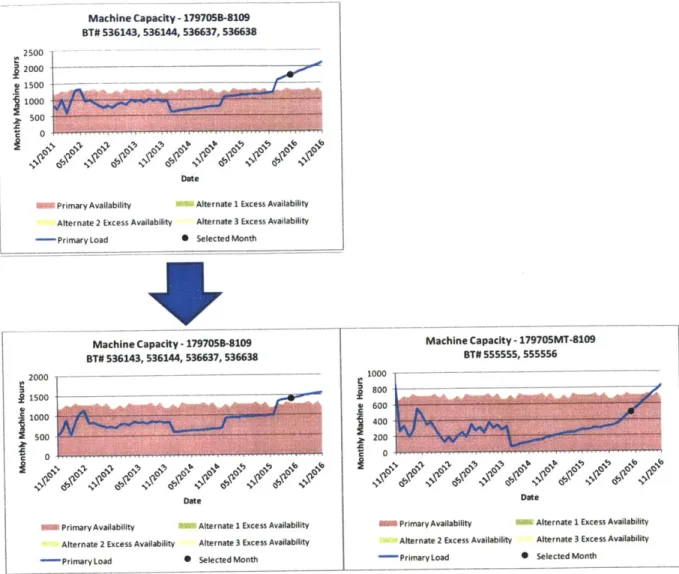
Figue I shows sample output from the prototype model implemented as a decision aid. In these charts, two new machines (1 79705MT-8109) are added to combine operations and remove some of the
constrained load on machine 179705B-8109. A layout of typical raw prototype model output is attached
Machine Capacity - 179705B-8109 BT# 536143, 536144, 536637, 536638 2500 2000 * 1500 1000 L 500 C0 Date
GM Primary Availability Alternate 1 Excess Availability
Alternate 2 Excess Availability Alternate 3 Excess Availability
Primary Load S Selected Month
Machine Capacity - 179705B-8109 BT# 536143, 536144, 536637, 536638 2000 1500 C1000 So: 0 Date
M Primary Availability Alternate 1 Excess Availability Alternate 2 Excess Availability Alternate 3 Excess Availability
" PrimaryLoad Selected Month
Machine Capacity - 179705MT-8109 BT# 555555, 555556 1000 400 200 C 0 Date
Primary Availability Alternate 1 Excess Availability
Alternate 2 Excess Availability Alternate 3 Excess Availability
" PrimaryLoad Selected Month
Figure 1 - Sample Model Decision Aid (179705B-8109)
2
Chapter 2 - State of Capacity Planning at the North Berwick Parts Center
Pratt and Whitney is a leading manufacturer of gas turbine engines, primarily for the propulsion of military and commercial aircraft. The North Berwick Parts Center (NBPC) manufactures over 1,200 different parts from many different sections of Pratt's various engine models. Most of these parts are static within the engine, allowing them to be made of metal rather than composite or ceramic materials. Because of this, most manufacturing processes at NBPC tend to be large-scale computer numeric controlled (CNC) removal machine tools such as mills, lathes, and grinders, with a few other types of processes as well. Almost all of the equipment required, however, is very expensive. As a result, planningfor capital investment has always been a critical process at NBPC. The need for capital investment can be driven by several factors, including equipment end-of-life replacement, new technology investment, and capacity expansion to accommodate anticipated new work. The work of this thesis will focus on the third type of capital investment.
2.1
Relevant Industry Background
2.1.1 Market Forces
The United States domestic aircraft, engine, and parts manufacturing industry has three primary markets. The commercial and private aviation market, accounting for 45.9% of industry revenue in 2011, consists primarily of commercial passenger airlines and private cargo transport operators. The US government is
estimated to have contributed 29.1% of industry revenue in 2011 for military and emergency services aircraft. The remaining 25% of 2011 industry revenue is estimated to have come from exports to global markets. (Samadi, 2011)
The commercial and private aviation market's demand driven by passenger airlines will respond in kind to demand for air travel. Likewise, cargo transport operators' demand for aircraft is driven by demand for cargo shipments. Because aircraft tend to have very long lead times, and require large amounts of capital investment, this sector's demand will respond primarily to long-term trends with regard to the
aforementioned factors. In the short-term, fluctuations in passenger and shipment demand will result in aircraft purchase deferrals or delays. Furthermore, competition in the commercial passenger airline industry demands that players invest in newer aircraft as they become available (Samadi, 2011)
Functionally, for aircraft, engine, and parts manufacturers with a diverse customer base, these dynamics mean that there is fairly good visibility to schedule ramps in the commercial sector as long-term trends and commercialization of new aircraft both tend to be fairly slow-moving and highly visible forces.
The military sector, on the other hand, tends to be subject to a lot more fluctuation. While the government funds development of new aircraft generally based upon a well-planned purchase contract, demand is
subject to rapid and unexpected changes due to political action in response to world events. For example, Lockheed Martin's year-end Securities and Exchange Commission (SEC) filings in 2001 reflect the optimistic uncertainty surrounding the military aviation sector's outlook after the attacks on September
1 ,, and the government's Quadrennial Defense Review (QDR):
"The President's proposed budget for the U.S. Department of Defense (DoD) for fiscal year 2003 and beyond reflects the above-mentioned transformation of national defense policy and responds to increased needs for homeland security and defeating terrorism. Budget increases are projected for operational readiness and personnel needs, as well as for both the procurement and the research and development accounts. While there is no assurance that the proposed increased DoD budget levels will be approved by
Congress, after over a decade of downward trends, the current defense budget outlook is one of growth. [Lockheed Martin]'s experience and capabilities are well aligned with U.S. defense priorities.
Uncertainties remain, however, relative to the level of growth and the amount of the budget that will be allocated to the investment accounts." (Lockheed Martin Corporation, 2002)
Consequently, military demand is subject to substantially more long-term uncertainty than the commercial sector.
2.1.2 Industry Structure
The production of aircraft is a massive undertaking, utilizing resources spread to an increasing degree all around the globe. Air framers such as The Boeing Company and Airbus, a subsidiary of the European
Aeronautic Defense and Space Company perform final assembly of the aircraft, with many of the individual systems, such as propulsion systems, wing, and landing gear manufacturing subcontracted out to various suppliers. These first-tier suppliers assemble the systems for the air framers. However, they often utilize a fabrication supply base for the actual production of their parts, creating a second tier of suppliers.
This succinctly describes the structure of the original equipment manufacturing (OEM) side of the aerospace industry. However, because of the extremely high capital cost of aircraft, there is also an active aftermarket for both individual parts and modular systems for maintenance, repair, and overhaul of the aircraft. This means that, while first and second-tier suppliers may act as such for the OEM market, many of these same companies interact with the end users or maintenance service providers in the aftermarket, often selling spare or replacement parts and systems directly.
The dynamics affecting demand in the aftermarket can be substantially different from those affecting OEM sales. Spare parts and modules (or "spares") sales are affected by the installed base of the
equipment of which the spare is a part, the part's design and purpose, and the end user's utilization of the installed equipment. Per a conversations with engineering staff at Pratt & Whitney, blade outer air seals (BOAS) are designed to be a wear part that requires periodic refurbishment or replacement. They act as a blade seal in the engine's high-pressure turbine (HPT). The seal is created between the rotor blade and a static coating on the BOAS. This coating deteriorates with use, and as a result must be replaced. On the other hand, some parts may rarely if ever require replacement, such as static support structures.
For a parts manufacturer, the aftermarket can act as a buffer against OEM downturns, providing
continuous part volumes based solely on the amount of previously sold equipment. However, aftermarket parts support will be required for the lifetime of that installed base. Consequently, acting in this capacity
can also be a liability to a parts manufacturer, requiring production of legacy parts long after production of newer equipment designs has reshaped the factory's operations.
2.1.3 Implications for Capacity Planning
The variability intrinsic to the military sector subjects demand forecasts to large and sometimes
unexpected swings when inflection points are reached. This makes capacity planning for manufacturers or equipment sets largely dedicated to the production of military parts difficult, and requires continuous updating of investment plans in order to keep investment in-line with expected need.
The spares market also requires a similar approach, necessitating that manufacturers or equipment sets dedicated primarily to spares production frequently update their investment plans. However, the extremely long duration that spares production is required to continue for a mature engine set also requires that smart decisions be made with regard to the extent to which an aging set of spare parts with
trailing demand should continue to be manufactured in-house. Research has shown that planning under demand uncertainty can lead to underinvestment in appropriate capital. (Fuss & Vermeulen, 2008)
2.2 Manufacturing at Pratt & Whitney
Pratt & Whitney's (PW) gas turbine engine manufacturing operation acts as an OEM subcontractor to air framers as well as an aftermarket maintenance, repair, and overhaul (MRO) service provider to end users. PW's operations are spread across various facilities around the world. However, engine final assembly is located primarily in Middletown, CT and as a result, there is a high concentration of facilities located in the northeastern United States and parts of southeastern Canada. The Middletown location performs final assembly of the engine from subsystems, or "modules" that are produced at various other locations, dubbed "mod centers." These mod centers build modules from a combination of internally fabricated parts, and parts purchased from the vendor base.
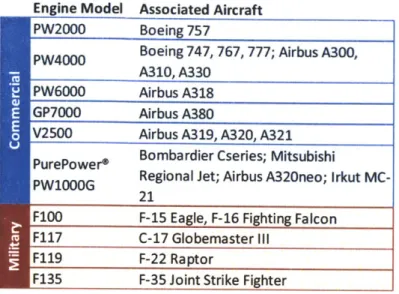
PW produces engines for both the military and commercial sectors of the aerospace market, and also provides MRO services to both of these markets as well. PW's major gas turbine engine products are
shown below in Table 1. PW also produces a number of small and medium-sized engines, as well as rocket engines and ground-based gas turbines. However, for the purposes of this research, the focus will be on commercial and military gas turbine aircraft engines, as these make up the overwhelming majority
Engine Model Associated Aircraft PW2000 Boeing 757
PW4000 Boeing 747, 767, 777; Airbus A300,
A310, A330
PW6000 Airbus A318
GP7000 Airbus A380
V2500 Airbus A319, A320, A321
PurePower* Bombardier Cseries; Mitsubishi
PW1000G Regional Jet; Airbus A320neo; Irkut MC-21
F100 F-15 Eagle, F-16 Fighting Falcon
F117 C-17 Globemaster IlIl
F119 F-22 Raptor
F135 F-35 Joint Strike Fighter
Table 1 - Pratt & Whitney's Major Gas Turbine Engine Products (Pratt and Whitney, 2011)
As shown above, PW has several products in each of the major markets, military and commercial. At the time of this research, the PurePower@ PWlOOOG engine, or geared turbofan (GTF) engine, has recently gone into early-stage production for test engines, and the F 135 engine program has just begin delivering production engines for sold aircraft. These two engine programs are expected to increase in volume of OEM production in the coming years. The other eight engine programs are fairly mature, and continue to sell both into the OEM market and the aftermarket.
2.2.1 Engine Manufacturing
The Middletown engine center's production schedule is built from an aggregate of projected demand from the company's various customers. Because of the extremely high price tag on the fully assembled
engines, customers' demand projections are given several years in advance, and fluctuations in this schedule tend to be relatively small, subject to the aforementioned market conditions. From this baseline engine schedule, PW has an enterprise resource planning (ERP) system that generates module delivery schedules based upon when each module for each engine will be needed at the engine center, backing off the expected lead time for each module. Synchronizing the schedule in this manner serves to reduce in-process inventory, creating a pull system between the mod centers and the engine center. From this module schedule, each component part's schedule is generated by the same process. However, at the
component level, there is a wide variety of different types of parts with different degrees of internal manufacturing content. Many small parts, such as nuts and bolts, rivets, and other standard hardware are purchased and stored on-site. Some of the larger manufactured parts are sourced to the vendor base, causing a manufacturing schedule to be released to each supplier based on the ERP schedule. In addition,
some parts are manufactured internal to PW within the various mod centers. Each of these internally manufactured part schedules is then used to generate a raw material requirements schedule. The raw materials for each component part may be a combination of small parts held in inventory on-site, and make-to-order castings or other more expensive materials conducive to a pull system.
Each ERP-generated schedule is based on a standard lead time associated with each particular part, which incorporates historical order-to-delivery performance data coupled with a buffer against unforeseen local delays. Additionally, each part schedule is built based on an assumed scrap factor, often manually managed by the materials planning organization. While the engine schedule may provide fairly good visibility, these two manual levers can serve to obscure the visibility of the actual engine schedule from module centers such as NBPC.
2.2.2 Spares Manufacturing
In addition to the engine center's assembled engine requirements from the customer, PW also sells spare parts and modules to its customers for maintenance and testing. The sales model for spares is substantially
different from that for engines. While engine schedules are often planned well in advance and based upon pre-determined contracts, spares are offered in an a-la-carte fashion. Each salable spare has a standard
lead time and price that can be quoted to the customer. The spares schedule is then generated as the customer orders parts subject to this lead time. Depending on how the customer decides to place these orders, however, this system can create problems for the manufacturing floor. Many customers have contracts for stable spare parts deliveries based on a make-to-stock system. This, however, is not always the case.
Because lead times are based on an average of demonstrated order-to-delivery turnaround data, there is no case-by-case allowance for what is going through the shop floor at a given time. Standard lead times are updated periodically, and since business is cyclical, this eliminates some of the variability from period-to-period. However, it does not automatically account for changes in the product mix, or, more importantly,
for the size of the order. This is a particularly relevant issue for military spares, as the military tends to order large amounts of parts, very infrequently, in line with its budgeting cycle. These bulk orders then create ERP requirements that may be unreasonable for the shop floor to meet. In order to accommodate these orders, the materials organization will then work to smooth them and pre-build the parts based upon tribal knowledge of what the shop's capability is to produce each part number.
If this manual smoothing process still leads to insufficient capacity, the organization can either work with the customer to extend the lead time, sequester parts previously allocated for engine deliveries (this is particularly common for small fluctuations or "hot" parts with requirements within the quoted lead time), or utilize second source manufacturers to make up any projected shortfall.
2.2.3 Management and Information Systems
United Technologies' operating system, called "Achieving Competitive Excellence" or ACE, governs the factory structure and operations at PW. ACE focuses on principles of lean manufacturing to establish processes and tools for managing operations on and off the shop floor. Additionally, ACE provides a set of metrics upon which departments', manufacturing cells', and plants' assessments and comparisons are based. ACE metrics are posted on boards located in every department throughout the plant, enabling at-a-glance assessment of what is going on in a particular area.
PW uses SAP software as its ERP platform. SAP brings together many of the different data sources scattered throughout the various departments in PW, enabling financial reporting and management to be linked directly with production scheduling and materials planning, as well as the other support
these modules were designed specifically for PW when the ERP system was initially implemented. ERP software platform implementation has been extensively studied ever since it evolved from manufacturing resource planning (MRP) software platforms in the 1970s. However, it has been suggested by previous research that planning modules in these software packages tend to be used less than intended, due in part to their inability to deal with uncertainty. (Halsall, Muhlemann, & Price, 1994)
With PW, as with many companies, this implementation has been largely successful for day-to-day and quarter-to-quarter business. However, several of the support modules, including the one for capacity
analysis, have fallen into disuse. In speaking with a member of the operations staff regarding the reason for this module's abandonment, the latent issues became apparent. "You may be able to build me the best 747, but that doesn't make me a pilot. [The model] isn't worth anything if it takes [an advanced degree] to run it." (Interview of CT Operations Employee, 2011) The capacity module built into SAP was designed to be extremely flexible within the constraints of the data systems and user interface upon which it is based. Unfortunately, this has made for a system that is very difficult and more importantly, time-intensive to use.
2.2.4 Implications for Capacity Planning
Because the spares ordering process is so dynamic, it is necessary for the purposes of long-term planning to maintain an "off-ERP" forecast of projected spares orders. This process is managed by each of the engine program offices. However, because these forecasts exist outside of the ERP system and are
non-standardized, this information can be difficult to obtain and aggregate, and any ERP-based planning systems do not fully take it into account.
For long-term planning, PW's manufacturing structure allows for limited schedule flexibility for parts slated for engine contracts, with slightly more flexibility in the schedules for spare parts. However, for a parts center such as NBPC, the entire delivery schedule is somewhat inflexible as parts schedules are determined explicitly from assembly floor. The exceptions are when schedule can be pulled in to
"pre-build" to projected demand, and the day-to-day activity of scheduling work on machines (such as process batching).
ACE is focused on characterizing and helping to control well-bounded processes, or processes whose procedures and impacts are confined to a well-defined organizational niche. For example, PW's capital
equipment procurement office (CEPO) has well-characterized process maps and controls on the management of capital projects across the various module centers. However, this process is bounded; it begins after capital justifications have already been established, and ends with the delivery of equipment. The reason for this is that these boundaries approximate the extent of the responsibility of CEPO on capital projects. However, the processes leading up to and following this process fall under the responsibility of the myriad module center management teams. This can be attributed as much to the processes being outside of the ACE operating system, as to the highly variable needs of the module centers. In speaking with the CEPO Manager, the scale of this variability became apparent:
"Berwick has done a good job refurbishing machines. [Another mod center] likes to upgrade their best machines... [A different mod center] and Berwick were the top spenders, but [another mod center] used to be.. .[A mod center in] Georgia has the biggest difficulties. They have the most expensive equipment, and the lowest volume of capital projects. They purchased one machine for $3 million with a 14-month lead time. . .The [third mod center] gets a lot less capital, because they have a hard time spending the
money they are allocated." (Interview with CEPO Manager, 2011)
Because of these variable needs, standardization of the capital justification and post-installation processes has been left to the discretion of the module centers, leading to varying degrees of rigor from center to center, and department to department.
2.3
The North Berwick Parts Center
The North Berwick Parts Center is one of PW's primary module centers. However, it is different from all of the other module centers in that it does not produce a module for a specific section of the engine.
Instead, NBPC acts as an OEM parts manufacturer for complex parts required by many of the other module centers for module assembly. In addition, NBPC performs manufacturing process development activities for new hardware, some of which are later transitioned out to the vendor base for full-scale manufacturing, while some are scaled up in-house and added to the shop's production load. Lastly, NBPC also houses a section of PW's aftermarket MRO business, called Global Service Partners (GSP).
2.3.1 Management Structure
NBPC's management is generally geared toward operations. An organizational chart is shown below in Figure 2. The shop floor is divided into six primary OEM business units, with a seventh just beginning to split from the unit of which it was previously a part. Each of these seven business units (BUs) has a business unit manager (BUM) responsible for all of the unit's operations. In addition to the seven OEM BUMs, there is also a manager for machine tool services (MTS), NBPC's in-house tool manufacturing and refurbishment shop, a manager for the entire GSP business on-site, and a manager from the "shared manufacturing services" section of the shop floor, which includes common batch processes such as heat treat furnaces, brazing and plating. Each of these 10 individuals reports to the plant's product manager,
who reports to the general manager. In addition to the product manager, each of the shared services groups including human resources, finance, materials planning, manufacturing engineering, design engineering, maintenance and facilities has a manager that reports to the plant's general manager.
General
Manager
Administrative
Assistant
Functional
Product Director
GSP Manager
Managers (i.e.
Finance, Quality)
GSP Operations
BU Managers
Manager
Figure 2 - NBPC Organizational Chart
However, in spite of the organizational chart, the general manager is heavily involved with the BUMs and operations managers, with each individual present both at the product managers' and the general
managers' staff meetings, while this is often not the case for other functional mid-level managers. This keeps all levels of management well-informed about what is happening on the shop floor, but also incentivizes unit managers to act autonomously, as they are held individually and independently accountable for their own metrics up to the top level of local management.
BUMs typically have a staff of manufacturing cell leaders or shift supervisors, as well as a materials controller and an ACE leader that often act as information shuttles between the shop floor and the BUM. Each cell leader or shift supervisor manages the shop technicians and engineering technicians that run the equipment on the floor.
In addition to the BUM, each BU has a technical supervisor who manages a group of manufacturing engineers (MEs). While the technical supervisors officially report through the functional manufacturing engineering organization, they work very closely with the BUMs. The technical supervisor often acts as a stand-in for the BUM in meetings when the BUM is not available. The MEs provide engineering support for shop floor operations, including new process development, process troubleshooting, and change management.
2.3.2 OEM Parts Manufacturing at NBPC
As previously mentioned, OEM parts manufacturing is divided into seven business units. Each unit manufactures a set of parts, typically differentiated by the parts' function, shape, and location in the engine. Each business unit is divided into several (3-5) manufacturing cells, each of which has a defined footprint with specific manufacturing equipment, geared toward the subset of parts that are allocated to it. Because of the highly diverse product mix, however, each cell must produce a substantial number of different parts, many of which follow similar, but not identical, processes. This results in some parts having very straightforward flow paths through the cell, and others having convoluted paths.
Additionally, some parts must travel between cells, or even between business units for specific operations or sets of operations. Cell layout decisions are made at the business unit level, and are typically designed to create simple flow paths for the part or parts that represent the majority of the volume in the cell. However, equipment is very expensive to move, and as product mix changes and engines enter different life cycle phases, cell layouts become outdated and inefficient.
As a result of this hybrid design of the job shop and the focused factory, and because each part number often requires a different jig or work holder, work is typically run in small batches, with a cell setting up to run a particular part number for a fixed amount of time or number of pieces, and then setting up to run a different part number. Batch sizes are typically determined by the BU's shop floor controller. In some cells, this introduces inefficiency into the system, where setup times are long and process times are short. The trade-offs between this batch size and the utilization of equipment and its effects on capacity is a
topic that has been well-studied. (Li & Meissner, 2011) However, because of the extensive amount of turning and milling operations performed on the parts at NBPC, and the degree of automation present in the equipment, process times for these types of operations tend to be far greater than their corresponding setup times, resulting in efficient machine usage.
Before a new part is allowed to be released to the shop floor, it must have a fully detailed process plan outlined in PW's data system, including specific data on every individual operation required to
manufacture the part. Each operation must be assigned to a primary piece of equipment, designated by a six-digit commodity code (CC) with an optional alphanumeric suffix. These CCs are used to differentiate machines from one another based upon their capability. The six-digit number serves to identify the type of machine, while the suffix is usually used to call out subtle differences, such as manufacturer, or ancillary machine capability not explicated by the CC. Each operation is also assigned a specific cell location for the piece of equipment on which it is to be performed. This designation of CC, suffix, and
location is not necessarily unique, and so individual machines are marked with a brass tag (BT) number for machine-to-machine differentiation, but this number is not specified in a part's operation profile. It is therefore assumed that machines with identical CC, suffix, and location information are considered
interchangeable with respect to a particular operation. In addition to equipment assignment, each operation is also required to have an estimated total process time, batch setup time, and process lot size.
Lot size is different from batch size in that a lot is processed in a single operation, while a batch indicates a quantity of parts to run through a cell before changing it over to another part number, regardless of how many operations this requires. Batch size is typically consistent by part from operation to operation, while lot size can change drastically depending upon the type of operation. Process time estimates are split into machine automatic time, characterized by the time the machine is working on the part, manual time, characterized by the total time the operator is occupied on the particular operation (including lot setup, on- and off-machine gauging), and man-machine time, which is the time that the operator is working on the machine, but the machine cannot be running (such as on-machine gauging and lot setup). In a sense,
man-machine time is time when both the operator and the machine are occupied, manual time is time when the operator is busy, and automatic time is when the machine is in use and the operator is free. Splitting process time into these three categories enables differentiation between machine utilization and manpower utilization, and determination of which, on a particular operation, is the rate determinant.
Before and after an operation is performed, the operator must scan a barcode on the part and on the machine, indicating the beginning and end of the operation, and each workstation contains all the standard procedures for every operation assigned to it. These procedures call out the preceding and proceeding operations to ensure sequence consistency. However, some operations also have alternate operations or alternate machines on which they can be run. It is therefore left to the discretion of the business unit staff which of these operations to utilize; though it is generally accepted that whichever operation is listed as the "primary" is to be used whenever possible.
If an operator notices a defect on a part before or after the operation is performed, it is pulled out of the cell into a separate area for a process called "dispositioning". This process assesses the degree of severity of the defect, and whether or not the material can be salvaged, must be reworked, or must be scrapped. Often, salvaging a particular part requires that the business obtain approval from the customer, or a modification to the customer's accepted standard, which can take a substantial amount of time to process, depending upon the magnitude of the change.
Every part, after all of its necessary manufacturing operations have been performed, goes through a final inspection operation before it is boxed and shipped to the customer (mod center or end user). Some final inspection operations are more detailed than others, based upon the specification on the part, or how established the manufacturing process is.
NBPC's OEM business is treated within PW as a cost center, meaning that the plant does not report revenues. Instead, parts are assigned a "delivered hours" value, a measure of the standard amount of value-added work put into the part at the plant. Delivered hours (Hi) is the metric that determines how
much work a particular business unit (i) did in a given time period (t). Because of the clocking system, wherein employees must scan a barcode to indicate the beginning and end of each operation on a particular part, there is real-time data available for how long each part took. Periodically, this data is aggregated to reevaluate how much each part is "worth" in delivered hours. In order to assign a dollar value to a part, each business unit reports its cost structure, and is assessed an "unburdened" shop rate (Rlit) by taking the total unit costs (Cit) and dividing it by total delivered hours within the same time period. Plant overhead costs (COHt) are then distributed by volume to each business unit, creating a "fully burdened" shop rate (RBit) in dollars per delivered hour. These relationships are explained mathematically below.
hj = Delivered hours for part j
Qjt
= Quantity of partj delivered in time t
HDit j
Qjt
all j
Cit
Ruit -HDt
COHt
RBit = Ruit + Z HDit
This relationship is important because, when project valuation is assessed for capacity expansion, it is determined by the dollar value of the additional delivered hours enabled by the equipment purchase, evaluated at the fully burdened shop rate for the given business unit.
2.3.3 Development at NBPC
North Berwick designs many of the parts that it runs on its shop floor, through its on-site design
engineering organization. These individuals work through the engine program-specific integrated product teams to design parts that fit the required envelope. Being collocated with the manufacturing engineers
and shop floor personnel enables rapid feedback for incremental design changes to accommodate more efficient manufacturing.
Development work is run on the same equipment as production parts, meaning that development learning curves can affect production part deliveries if they are not properly anticipated. Business units doing development work also tend to dedicate to it their most skilled machinists, which can in turn affect the
quality of production work in situations where a skilled operator is required for a particular production operation. Because of the large range of part types produced at NBPC, when a new engine program is in development, a lot of new process development is pushed onto NBPC at once.
2.3.4 Maintenance, Repair, and Overhaul Business at NBPC
NBPC also has on-site operations for PW's maintenance, repair, and overhaul business called Global Service Partners (GSP). Due to independent aftermarket quality standards, GSP work must be kept separate from OEM work. The GSP business operates quite differently from the OEM business. GSP customers will send an engine or module to PW for maintenance, repair, or overhaul. The modules are then disassembled, and assessed regarding the extent and nature of the repair required. Work is then sent to the GSP business unit that specializes in the required type of repair.
While in the OEM business, parts with the same part number are considered interchangeable, and can be shifted to fill different orders for the same part number, this is not the case for GSP. Traceability is required on the specific part, identified by serial number, rather than part number. Because of this, and because every repair is unique, GSP operations do not use the same data systems as OEM operations.
Because of the differences in the nature of the manufacturing process, quality standards, data systems, and business model, GSP and OEM work, although collocated within NBPC, are kept in different areas of the shop floor.
However, OEM and GSP do require many of the same manufacturing processes, which means that they also require much of the same capital equipment. While most GSP cells can perform their operations
without the use of OEM equipment, there are some processes, such as coating, that are shared between the two businesses, and there are some times when, due to GSP loading, parts must utilize OEM fabrication equipment in order to meet the schedule. When this happens, the time is allocated to the GSP business in a process called "charge out".
2.3.5 Implications for Capacity Planning
The fact that BUMs are held accountable up to the plant manager level can incentivize autonomous decision-making from BU to BU. This can lead to inefficient allocation of capital resources, as units act on their own behalf in order to maximize local benefit, rather than optimizing allocations on a plant-wide scale. For example, if a business unit requires additional 4-axis milling capacity based upon its
approximation of demand forecasts' impact on the shop floor, the BU management may elect to purchase a new machine. However, because of the lack of communication between BUs, there may be sufficient available capacity on 4-axis mills elsewhere in the plant. It is often left to the BUs themselves to seek out these cross-utilization opportunities, and since this is neither easy to do, nor are the BUs incentivized to do it, it rarely happens. Exceptional cases include those where there is a shortage on a scarce asset, such as a very specialized piece of equipment, in which case management at both the plant and BU levels are typically aware of the status of each piece of equipment in the shop. Other common exceptions are cases where a shortage is so severe that it is already affecting deliveries, in which case management is forced to search for a short-term fix; in these times, buying a piece of equipment is typically not an option.
The coexistence in the shop of development work with production work has extreme implications for capacity planning as it relates to the engine development cycle. When new engines are in development, development work can significantly affect production capacity. However, as this development work progresses, constraints can quickly change or be eliminated. The uncertainty in the development process, and the progressive reduction of this uncertainty requires that forecasted capacity be continuously monitored as experience is gained in the process, because future demand may be heavily driven by
expected production loads for the parts under development, and a small change in the expected process time, or the process itself can result in huge downstream shifts in expected capacity constraints.
Finally, the charge-out process requires that the GSP side of the business be taken into consideration, as this can amount to a substantial piece of the load on a particular machine, depending upon the machine
type. While this expected load cannot be calculated with the same degree of rigor as the OEM load, it must be accounted for in some respect.
2.4 Capital Procurement and Strategic Capacitation
Pratt and Whitney's scope of operations requires a substantial investment from year to year in
manufacturing equipment. Per United Technologies' 2011 Annual Report, Pratt and Whitney's capital expenditures for fiscal year 2011 were $290 million, or approximately 2.2% of net sales. (United
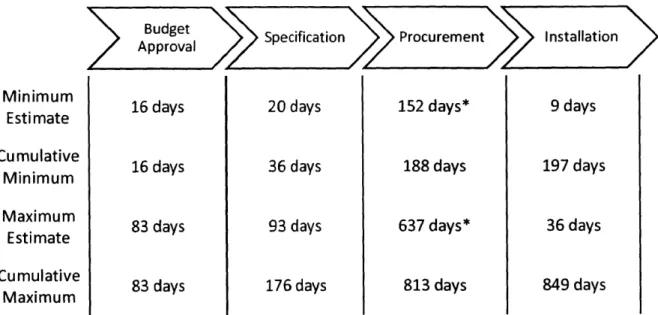
Technologies Corporation, 2012) For mod centers such as NBPC, capital procurement is handled through CEPO. As mentioned before, CEPO's internal process is well-documented, but the parts of the process outside of CEPO's responsibility are not. Through communication with CEPO and participating parties in the capital process at NBPC, a process map was laid out for the full life cycle of a capital project, from inception to release to production. This process can be divided into four phases, as shown below in Figure 3. Estimates for the duration of each phase were determined by dividing the capital procurement process into 76 discrete steps, and conducting a survey of each of the primary stakeholders' estimates of the duration of each step for which he or she is responsible. Minimum and maximum estimates were
determined by aggregating the minimum and maximum estimated durations for each process step, respectively.
udgetSeiic o
Approval Specification Procurement Installation
ApprovalD
Minimum
16days
20days
152days*
Estimate
Cumulative
16 days
36 days
188 days
Minimum
Maximum
83 days
93 days
637 days*
Estimate
Cumulative
83 days
176 days
813 days
Maximum
* Procurement phase variability is driven by variability in equipment build times, which 84 to 420 days, depending on the type of equipment purchased.
9 days
197 days
36 days
849 days
can be anywhere fromFigure 3 - Module Center Capital Procurement Process
The budget approval phase involves the identification of needed equipment, budgetary quoting, and capital plan approval. After a project has been added to the capital plan, a formal capital justification is constructed by the business unit, while CEPO works with both the business unit and the vendor to develop a detailed specification, and request a detailed quote. When the specification phase is finished, a purchase order is issued and approved, and the piece of equipment is built by the vendor. At the end of the procurement phase, CEPO and business unit staff will travel to the vendor's manufacturing site and
conduct a test of the machine before it is shipped to the mod center. After this is finished, the facility must execute its installation plan (developed in the "specification" phase) and make connections to the piece of equipment. When this is complete, and basic on-site testing is done, the piece of equipment can be released to production. This entire process can take anywhere from 6 to 28 months, depending upon the type of equipment and the priority of the project.
2.4.1 Capital Project Planning and Budget Approval
Budget approval is the phase during which a new capacity planning tool has the most value for NBPC, since this is the phase where all of the long-term planning is done. Typically, technical supervisors will,
throughout the course of the year, develop a "wish list" of needed equipment. Ideas may come directly from the shop floor, from home-grown planning tools, or from their own intuition. When an idea is developed, budgetary quotes must then be obtained. A budgetary quote enables rough capital allocation and justification without the need for developing a detailed specification, a process that can take weeks. The budgetary quotes also enable business units to vet their wish lists, in order to remove projects which may not be economically justified, or may not be needed right away. When this is complete, the technical supervisors are responsible for putting together, for each project they wish to add to the capital plan, a
"quad chart" business case. This quad chart describes, at a very high level, what equipment is to be purchased, what the project schedule is, how the money will be repaid, and where responsibility lies.
These quad charts are then presented to plant management prior to the annual capital budget meeting. Plant management aggregates all of the business units' projects into a single list, and prioritizes them. This list is then partitioned by the year the capital is required (business units are to plan capital needs three years in advance). In the late summer or early fall, the annual capital planning meeting involves CEPO and representatives from each of the module centers. Mod center representatives bring their respective capital lists for the upcoming year, and the previously allocated capital budget for all of the module centers is then divided between them. On each module center's list of capital projects, a "water line" is set at a certain priority level, and only projects "above the water line" are added to the capital plan. Mod center representatives then retum and inform their business units which projects have been approved.
This begins the specification phase of the capital projects, which starts with a formal project valuation and capital justification. In some sense, due to the fact that the projects have already been approved by the time a formal justification is completed, this justification becomes more of a formality than an actual decision tool. Projects that do not appear justified are often cited as having "strategic" reasons for
execution. In practice, few approved projects are reconsidered because of an unfavorable valuation model.