HAL Id: inserm-00770870
https://www.hal.inserm.fr/inserm-00770870
Submitted on 7 Jan 2013
HAL is a multi-disciplinary open access
archive for the deposit and dissemination of
sci-entific research documents, whether they are
pub-lished or not. The documents may come from
teaching and research institutions in France or
abroad, or from public or private research centers.
L’archive ouverte pluridisciplinaire HAL, est
destinée au dépôt et à la diffusion de documents
scientifiques de niveau recherche, publiés ou non,
émanant des établissements d’enseignement et de
recherche français ou étrangers, des laboratoires
publics ou privés.
Adherence to healthy dietary guidelines and future
depressive symptoms: evidence for sex differentials in
the Whitehall II study.
Tasnime Akbaraly, Séverine Sabia, Martin Shipley, David Batty, Mika
Kivimaki
To cite this version:
Tasnime Akbaraly, Séverine Sabia, Martin Shipley, David Batty, Mika Kivimaki. Adherence to healthy
dietary guidelines and future depressive symptoms: evidence for sex differentials in the Whitehall II
study.. American Journal of Clinical Nutrition, American Society for Nutrition, 2013, 97 (2),
pp.419-27. �10.3945/ajcn.112.041582�. �inserm-00770870�
On-line supplemental table
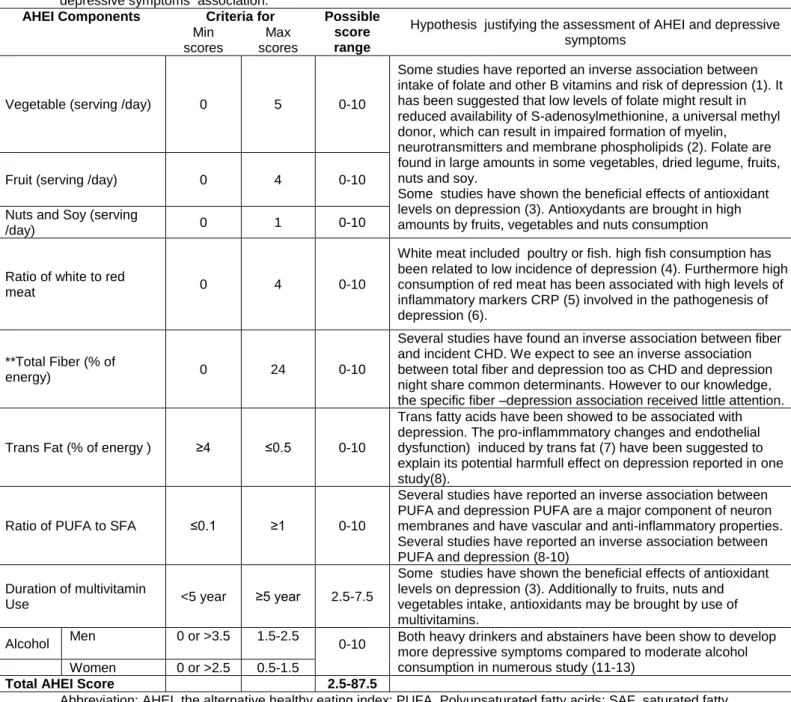
Table S1: Construction of AHEI scores and hypotheses justifying the use of AHEI to assess the overall diet and depressive symptoms association.
AHEI Components Criteria for Possible score range
Hypothesis justifying the assessment of AHEI and depressive symptoms
Min scores
Max scores
Vegetable (serving /day) 0 5 0-10
Some studies have reported an inverse association between intake of folate and other B vitamins and risk of depression (1). It has been suggested that low levels of folate might result in reduced availability of S-adenosylmethionine, a universal methyl donor, which can result in impaired formation of myelin,
neurotransmitters and membrane phospholipids (2). Folate are found in large amounts in some vegetables, dried legume, fruits, nuts and soy.
Some studies have shown the beneficial effects of antioxidant levels on depression (3). Antioxydants are brought in high amounts by fruits, vegetables and nuts consumption
Fruit (serving /day) 0 4 0-10
Nuts and Soy (serving
/day) 0 1 0-10
Ratio of white to red
meat 0 4 0-10
White meat included poultry or fish. high fish consumption has been related to low incidence of depression (4). Furthermore high consumption of red meat has been associated with high levels of inflammatory markers CRP (5) involved in the pathogenesis of depression (6).
**Total Fiber (% of
energy) 0 24 0-10
Several studies have found an inverse association between fiber and incident CHD. We expect to see an inverse association between total fiber and depression too as CHD and depression night share common determinants. However to our knowledge, the specific fiber –depression association received little attention.
Trans Fat (% of energy ) ≥4 ≤0.5 0-10
Trans fatty acids have been showed to be associated with depression. The pro-inflammmatory changes and endothelial dysfunction) induced by trans fat (7) have been suggested to explain its potential harmfull effect on depression reported in one study(8).
Ratio of PUFA to SFA ≤0.1 ≥1 0-10
Several studies have reported an inverse association between PUFA and depression PUFA are a major component of neuron membranes and have vascular and anti-inflammatory properties. Several studies have reported an inverse association between PUFA and depression (8-10)
Duration of multivitamin
Use <5 year ≥5 year 2.5-7.5
Some studies have shown the beneficial effects of antioxidant levels on depression (3). Additionally to fruits, nuts and vegetables intake, antioxidants may be brought by use of multivitamins.
Alcohol Men 0 or >3.5 1.5-2.5 0-10 Both heavy drinkers and abstainers have been show to develop more depressive symptoms compared to moderate alcohol consumption in numerous study (11-13)
Women 0 or >2.5 0.5-1.5
Total AHEI Score 2.5-87.5
Abbreviation: AHEI, the alternative healthy eating index; PUFA, Polyunsaturated fatty acids; SAF, saturated fatty acids.
*Each AHEI component contributed from 0 to 10 points to the total AHEI score, except the multivitamin
component which was dichotomous and contributing either 2.5 points (for non-use) or 7.5 points (foruse) A score of 10 indicates that the recommendationswere fully met, whereas a score of 0 represents the least healthydietary behavior. Intermediate intakes were scored proportionatelybetween 0 and 10.
**The original components of the index include cereal fiber, because cereal fiber was not available in our nutrient data set, we adapted the score by replacing it with total fiber.
† Mean score for men and women combined.
1. Tolmunen T, Hintikka J, Ruusunen A, Voutilainen S, Tanskanen A, Valkonen VP, Viinamaki H, Kaplan GA, Salonen JT. Dietary folate and the risk of depression in Finnish middle-aged men. A prospective follow-up study. Psychother Psychosom 2004;73:334-9.
2. Selhub J, Bagley LC, Miller J, Rosenberg IH. B vitamins, homocysteine, and neurocognitive function in the elderly. Am J Clin Nutr 2000;71:614S-620S.
3. Sarandol A, Sarandol E, Eker SS, Erdinc S, Vatansever E, Kirli S. Major depressive disorder is accompanied with oxidative stress: short-term antidepressant treatment does not alter oxidative-antioxidative systems. Hum Psychopharmacol 2007;22:67-73.
4. Hibbeln JR. Fish consumption and major depression. Lancet 1998;351:1213.
5. Montonen J, Boeing H, Fritsche A, Schleicher E, Joost HG, Schulze MB, Steffen A, Pischon T. Consumption of red meat and whole-grain bread in relation to biomarkers of obesity, inflammation, glucose metabolism and oxidative stress. Eur J Nutr 2012.
6. Tiemeier H, Hofman A, van Tuijl HR, Kiliaan AJ, Meijer J, Breteler MM. Inflammatory proteins and depression in the elderly. Epidemiology 2003;14:103-7.
7. Mozaffarian D, Aro A, Willett WC. Health effects of trans-fatty acids: experimental and observational evidence. Eur J Clin Nutr 2009;63 Suppl 2:S5-21.
8. Sanchez-Villegas A, Verberne L, De Irala J, Ruiz-Canela M, Toledo E, Serra-Majem L, Martinez-Gonzalez MA. Dietary fat intake and the risk of depression: the SUN Project. PLoS One 2011;6:e16268. 9. Sanchez-Villegas A, Henriquez P, Figueiras A, Ortuno F, Lahortiga F, Martinez-Gonzalez MA. Long
chain omega-3 fatty acids intake, fish consumption and mental disorders in the SUN cohort study. Eur J Nutr 2007;46:337-46.
10. Tiemeier H, van Tuijl HR, Hofman A, Kiliaan AJ, Breteler MM. Plasma fatty acid composition and depression are associated in the elderly: the Rotterdam Study. Am J Clin Nutr 2003;78:40-6.
11. Alati R, Lawlor DA, Najman JM, Williams GM, Bor W, O'Callaghan M. Is there really a 'J-shaped' curve in the association between alcohol consumption and symptoms of depression and anxiety? Findings from the Mater-University Study of Pregnancy and its outcomes. Addiction 2005;100:643-51.
12. Caldwell TM, Rodgers B, Jorm AF, Christensen H, Jacomb PA, Korten AE, Lynskey MT. Patterns of association between alcohol consumption and symptoms of depression and anxiety in young adults. Addiction 2002;97:583-94.
13. Rodgers B, Korten AE, Jorm AF, Jacomb PA, Christensen H, Henderson AS. Non-linear relationships in associations of depression and anxiety with alcohol use. Psychol Med 2000;30:421-32.
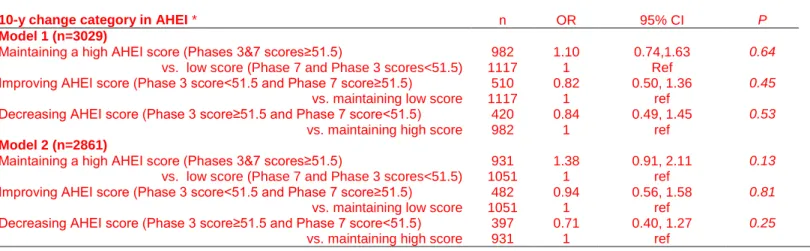
Table S2: Odds ratios (95% CI) for the association between 10-year change in AHEI score between phase 3 and phase 7 and the subsequent recurrent depressive symptoms (DepS) over 5 years of follow-up in men.
AHEI: Alternative Healthy Eating Index; OR: odds ratio; 95% CI: Confident interval at 95 %. SD: standard deviation
Results of logistic regression estimating odds of persistent DepS according to the 10-y change in AHEI score. To analyze the 10-y change in AHEI score, scores of AHEI at phases 3 and 7 were categorized as high or low according to the median value of AHEI score at phase 3 equal to 51.5 points.
*Four categories in 10-y change of AHEI were then defined: participants who maintained a high score (Phase 3 and 7 scores ≥ 51.5), those who maintained a low score over the 10-y exposure period (Phase 3 and 7 scores < 51.5), participants who improved their AHEI score (Phase 3 score < 51.5 and Phase 7 score ≥ 51.5) and those who decreased their score (Phase 3 score ≥ 51.5 points and Phase 7 score< 51.5 points).
Model 1: Adjusted for age, ethnicity and total energy intake at phase 3.
Model 2: Model 1 + additionally adjusted for SES, retirement, marital status, smoking, physical activity, hypertension, HDL-cholesterol and central obesity at phase 3.
10-y change category in AHEI * n OR 95% CI P
Model 1 (n=3029)
Maintaining a high AHEI score (Phases 3&7 scores≥51.5) 982 1.10 0.74,1.63 0.64
vs. low score (Phase 7 and Phase 3 scores<51.5) 1117 1 Ref
Improving AHEI score (Phase 3 score<51.5 and Phase 7 score≥51.5) 510 0.82 0.50, 1.36 0.45
vs. maintaining low score 1117 1 ref
Decreasing AHEI score (Phase 3 score≥51.5 and Phase 7 score<51.5) 420 0.84 0.49, 1.45 0.53
vs. maintaining high score 982 1 ref
Model 2 (n=2861)
Maintaining a high AHEI score (Phases 3&7 scores≥51.5)
vs. low score (Phase 7 and Phase 3 scores<51.5)
931 1.38 0.91, 2.11 0.13
1051 1 ref
Improving AHEI score (Phase 3 score<51.5 and Phase 7 score≥51.5)
vs. maintaining low score
482 0.94 0.56, 1.58 0.81
1051 1 ref
Decreasing AHEI score (Phase 3 score≥51.5 and Phase 7 score<51.5) vs. maintaining high score
397 0.71 0.40, 1.27 0.25