1
Supplement
Projecting the continental accumulation of alien species through to 2050
Hanno Seebens1, Sven Bacher2, Tim M. Blackburn3,4,5, César Capinha6, Wayne Dawson7, Stefan Dullinger8, Piero Genovesi5,9,10, Philip E. Hulme11, Mark van Kleunen12,13, Ingolf Kühn14,15,16, Jonathan M. Jeschke17,18,19, Bernd Lenzner8, Andrew M. Liebhold20,21, Zarah Pattison22, Jan Pergl23, Petr Pyšek23,24, Marten Winter16 & Franz Essl8,5
Affiliations:
1
Senckenberg Biodiversity and Climate Research Centre (BiK-F), Senckenberganlage 25, 60325 Frankfurt am Main, Germany
2
Department of Biology, University of Fribourg, Chemin du Musée 10, 1700 Fribourg, Switzerland
3
Department of Genetics, Evolution and Environment, Centre for Biodiversity and Environment Research, University College London, Gower Street, London WC1E 6BT, UK
4
Institute of Zoology, Zoological Society of London, Regent’s Park, London NW1 4RY, UK
5
Centre for Invasion Biology, Department of Botany and Zoology, Stellenbosch University, Stellenbosch, South Africa
6
Centro de Estudos Geográficos, Instituto de Geografia e Ordenamento do Território - IGOT, Universidade de Lisboa, Rua Branca Edmée Marques, 1600-276 Lisboa, Portugal
7
Department of Biosciences, Durham University, South Road, Durham, DH1 3LE, United Kingdom
8
Department of Botany and Biodiversity Research, University of Vienna, Rennweg 14, 1030 Vienna, Austria
9
Institute for Environmental Protection and Research (ISPRA), Via Vitaliano Brancati 48, 00144 Rome, Italy
10
Chair IUCN Species Survival Commission Invasive Species Specialist Group (ISSG), 00144 Rome, Italy
11
Bio-Protection Research Centre, Lincoln University, Christchurch 7648, New Zealand
12
2
Germany
13
Zhejiang Provincial Key Laboratory of Plant Evolutionary Ecology and Conservation, Taizhou University, Taizhou 318000, China
14
Helmholtz Centre for Environmental Research – UFZ, Department of Community Ecology, Theodor-Lieser-Str. 4, 06120 Halle, Germany
15
Martin Luther University Halle-Wittenberg, Geobotany and Botanical Garden, Am Kirchweg 2, 06108 Halle, Germany
16
German Centre for Integrative Biodiversity Research (iDiv), Halle-Jena-Leipzig, Deutscher Platz 5e, 04103 Leipzig, Germany
17
Leibniz-Institute of Freshwater Ecology and Inland Fisheries (IGB), Müggelseedamm 310, 12587 Berlin, Germany
18
Freie Universität Berlin, Department of Biology, Chemistry, Pharmacy, Institute of Biology, Königin-Luise-Str. 1-3, 14195 Berlin, Germany
19
Berlin-Brandenburg Institute of Advanced Biodiversity Research (BBIB), Königin-Luise-Str. 2-4, 14195 Berlin, Germany
20
USDA Forest Service Northern Research Station, Morgantown, WV 26505, USA
21
Czech University of Life Sciences Prague, Faculty of Forestry and Wood Sciences, CZ 165 21 Praha 6 - Suchdol, Czech Republic
22
School of Natural and Environmental Sciences, Newcastle University, Ridley Building, Claremont Road, Newcastle upon Tyne, NE1 7RU, UK
23
Czech Academy of Sciences, Institute of Botany, Department of Invasion Ecology, CZ-252 43 Průhonice, Czech Republic
24
Department of Ecology, Faculty of Science, Charles University, Viničná 7, CZ-128 44 Prague, Czech Republic
3
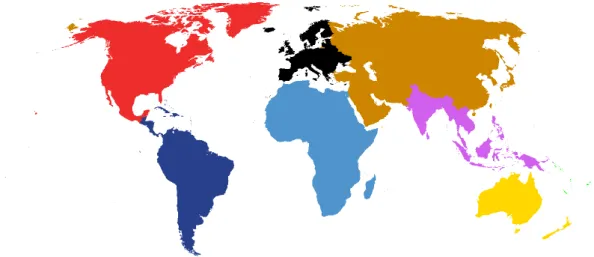
Fig. S1 Delineation of continental regions based on the Taxonomy Database Working Group
(TDWG) World Geographical Scheme for Recording Plant Distributions Version 2.0 (https://www.tdwg.org/standards/wgsrpd/).
4
5
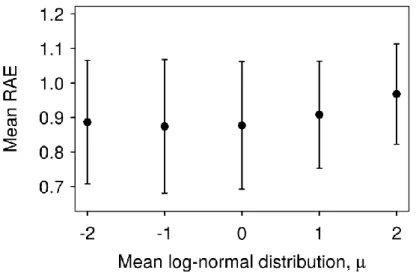
Fig. S3 Mean and standard deviation of relative absolute errors (RAEs) of simulations of all
possible taxon-continent combinations for varying values of the mean log-normal
distribution, µ, which determines the shape of the candidate source pools. Overall, values around -1 and 0 provided best model performance, although the difference to model performances using other values was low.
6
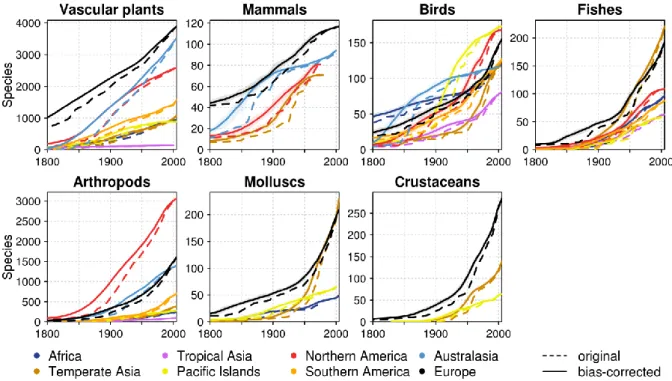
Fig. S4 Changes in emerging alien species numbers for different taxonomic groups and
continental regions until the year 2005. Trajectories are shown for original data (dashed lines) and for mean species numbers after correcting for temporal sampling bias (solid lines). Bias correction was done separately for each of the 100 model runs with the mean shown here.
7
Fig. S5 Examples of single model runs for a random selection of taxon-continent pairs,
showing observed time series of first records until 1950 (black dots), fit and extrapolations of first record rates (blue lines) and model predictions until 2005 (red circles). Top panels show the estimated sizes of the candidate species pools until 1950, which were linearly
extrapolated until 2005. Middle panels highlight the first-record rates of all alien species until 1950, which were extrapolated until 2005 using one out of six functional forms (blue lines), which described the dynamics since 1800 best. Observed first-record rates from 1950-2005 are shown for comparison (black circles). Bottom panels show the observed (black) and predicted (red) accumulations of emerging alien species. The model fit is indicated by the relative absolute error (RAE).
8
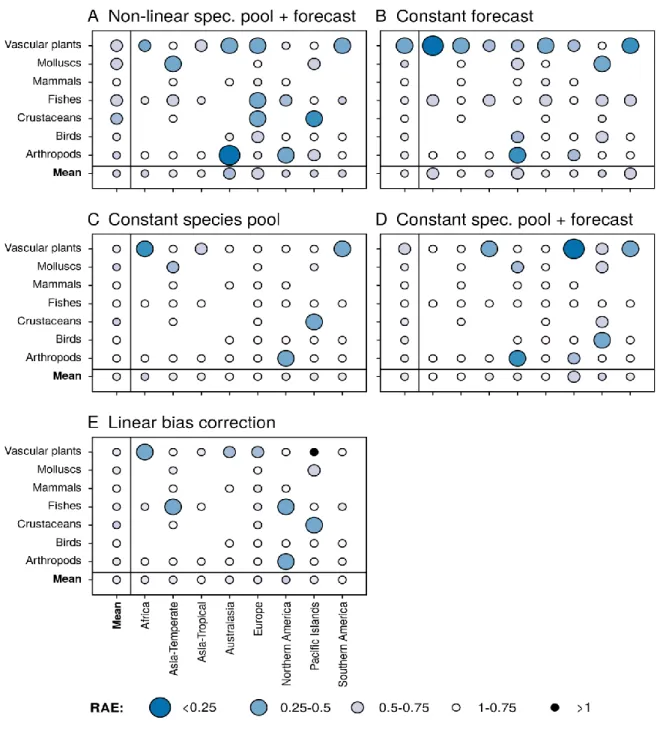
Fig. S6 Model performance of all model versions and all simulation runs (up to 100 runs
each) for each taxonomic group and continent. Performance was tested by applying the model to first records until 1950 to predict dynamics from 1950 to 2005. Model performance was measured using the relative absolute error (RAE) between observed and predicted rates of emerging alien species. Size of bubbles and colours indicate the median RAE averaged over 100 model runs for each combination of taxa and continent. Lower values of RAE denote better model performance. Gaps indicate taxon-continent combinations, where resulting time series of first records did not fulfil our minimum requirements for calculating simulations (step 5 in methods).
9
Fig. S7 Model performance using different bin sizes to aggregate first records from 1 to 15
years. Model performance is shown for all simulation runs (up to 100 runs each) for each taxonomic group and continent. Performance was tested by applying the model to first records until 1950 to predict dynamics from 1950 to 2005. Model performance was
measured using the relative absolute error (RAE) between observed and predicted rates of emerging alien species. Size of bubbles and colours indicate the median RAE averaged over 100 model runs for each combination of taxon and continent. Lower values of RAE denote better model performance. Gaps indicate taxon-continent combinations where resulting time series of first records did not fulfil our minimum requirements for calculating simulations (step 5 in methods).
10
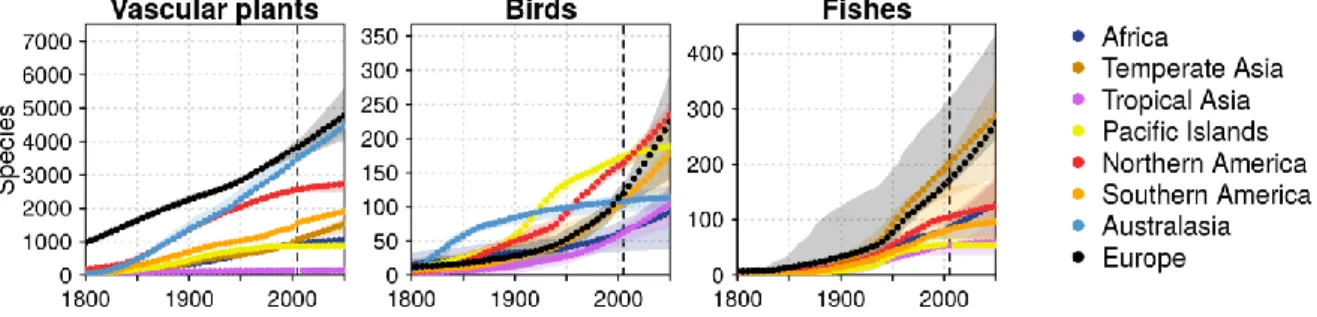
Fig. S8 Uncorrected projections of alien species accumulations on different continents until
2050 for alien vascular plants, birds and fishes. The projections are the same as in Fig. 2, but without correcting for spatial variation in sampling intensity. The dots represent means of up to 100 model runs, while the full range of all predicted trajectories is indicated by shaded areas.
11
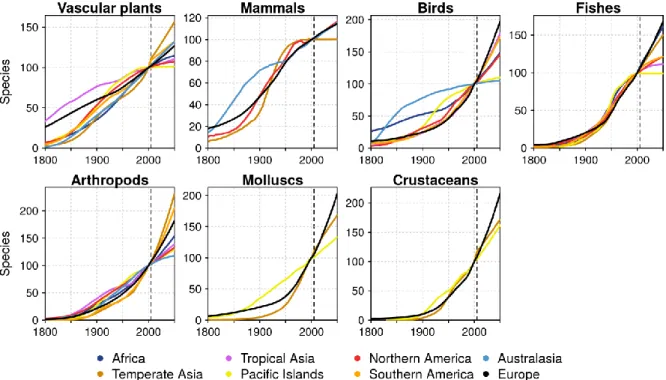
Fig. S9 Projections of relative alien species accumulations on different continents for seven
taxonomic groups. The time series are rescaled to a value of 100 at 2000 to highlight relative increases in alien species numbers per continent and taxon. The lines represent means of 100 model runs.
12
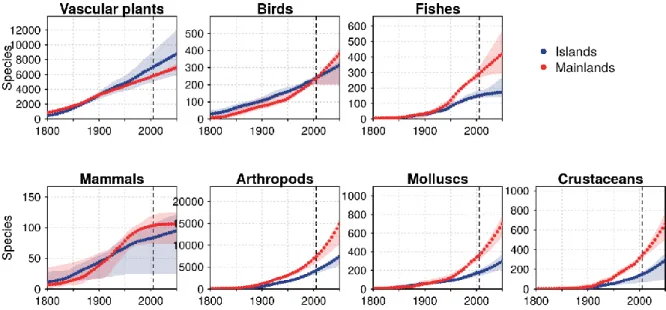
Fig. S10 Predicted developments of alien species numbers on islands and mainlands for
seven taxonomic groups until 2050. The dots represent means of up to 100 model runs, while the full range of all predicted trajectories is indicated by shaded areas.
13
Fig. S11 Predicted developments of aquatic and terrestrial alien species numbers for vascular
plants and insects until 2050 in relative (upper panels) and absolute (lower panels) numbers. The dots represent means of up to 100 model runs, while the full range of all predicted trajectories is indicated by shaded areas. Relative accumulation trends are normalised so that the value of species numbers at 2005 equals 100.
14
Fig. S12 Predicted temporal developments of the sizes of candidate species pools shown separately for each taxon-continent combination. The mean of all simulation runs are shown as lines. Quantiles of simulation runs in 10% steps are indicated by bands.