Publisher’s version / Version de l'éditeur:
ASHRAE Transactions, 105, Pt. 1, pp. 279-288, 1998-04-01
READ THESE TERMS AND CONDITIONS CAREFULLY BEFORE USING THIS WEBSITE. https://nrc-publications.canada.ca/eng/copyright
Vous avez des questions? Nous pouvons vous aider. Pour communiquer directement avec un auteur, consultez la première page de la revue dans laquelle son article a été publié afin de trouver ses coordonnées. Si vous n’arrivez pas à les repérer, communiquez avec nous à PublicationsArchive-ArchivesPublications@nrc-cnrc.gc.ca.
Questions? Contact the NRC Publications Archive team at
PublicationsArchive-ArchivesPublications@nrc-cnrc.gc.ca. If you wish to email the authors directly, please see the first page of the publication for their contact information.
NRC Publications Archive
Archives des publications du CNRC
This publication could be one of several versions: author’s original, accepted manuscript or the publisher’s version. / La version de cette publication peut être l’une des suivantes : la version prépublication de l’auteur, la version acceptée du manuscrit ou la version de l’éditeur.
Access and use of this website and the material on it are subject to the Terms and Conditions set forth at
Measurements of volatile organic compound (VOC) emissions from
wood stains using an electronic balance
Zhang, J. S.; Nong, G.; Shaw, C. Y.; Wang, J. M.
https://publications-cnrc.canada.ca/fra/droits
L’accès à ce site Web et l’utilisation de son contenu sont assujettis aux conditions présentées dans le site
LISEZ CES CONDITIONS ATTENTIVEMENT AVANT D’UTILISER CE SITE WEB.
NRC Publications Record / Notice d'Archives des publications de CNRC:
https://nrc-publications.canada.ca/eng/view/object/?id=c497343b-37c9-4dc8-89ec-9408bfd46e29 https://publications-cnrc.canada.ca/fra/voir/objet/?id=c497343b-37c9-4dc8-89ec-9408bfd46e29http://www.nrc-cnrc.gc.ca/irc
M e a sure m e nt s of vola t ile orga nic c om pound (V OC) e m issions from
w ood st a ins using a n e le c t ronic ba la nc e
N R C C - 4 2 0 3 2
Z h a n g , J . S . ; N o n g , G . ; S h a w , C . Y . ; W a n g , J . M .
A p r i l 1 9 8 8
A version of this document is published in / Une version de ce document se trouve dans:
ASHRAE Transactions,
105, (Pt. 1), pp. 279-288, April 01, 1998
The material in this document is covered by the provisions of the Copyright Act, by Canadian laws, policies, regulations and international agreements. Such provisions serve to identify the information source and, in specific instances, to prohibit reproduction of materials without written permission. For more information visit http://laws.justice.gc.ca/en/showtdm/cs/C-42
Les renseignements dans ce document sont protégés par la Loi sur le droit d'auteur, par les lois, les politiques et les règlements du Canada et des accords internationaux. Ces dispositions permettent d'identifier la source de l'information et, dans certains cas, d'interdire la copie de documents sans permission écrite. Pour obtenir de plus amples renseignements : http://lois.justice.gc.ca/fr/showtdm/cs/C-42
c . .;;i... ',w",
4256
Measurements of Volatile Organic
Compound (VOe) Emissions
from Wood Stains Using an
Electronic Balance
:;::,,, .
Jlanahun S. Zhang, Ph.D. Msmber ASHRAE
Gang Nong Chill-Yu Shaw, Ph.D., P.E. Member ASHRAE
Jiemlng Wang, Ph.D.
ABSTRACT
An emissions test method using an electronic balance is
introduced for measuring the 1VOC emission rates of oil· based wood stains. with a detailed procedure for preparing
test specimens. The emission characteristics of volatile
organic compounds (VOC) from an artificial wood stai"and
an oil-basedcommercial woodstain were determined. Results
showed that. VOC emissiolls from both staills illCluded a suTjace evaporation and an internal diffusion sub-process. With regard to time. the emire emission period could be
divided into three periods: (/) an initial
evaporation-controlled period that was characterized by a high and fast
decaying emission rate" (2)a transition period (following the
initial period) I'n which the emissions transitedjrom an evap-oration-controlled to an intemal diffusion-controlledprocess,
and(3)an internal diffusion.controlled periodthatwas char·
acleril,edbya low and slowly decaying emission rate. For the
commercial wood stain tested the length ofthe initial period was approximately three hours. and about46%ofthe emilla· ble VOC mass was emitted during this shart period The tran-sition period was between3 and 6.5 hours from the start of
testing and only accoUllted/orabout4% ofVOCmass emilled The rest (about 50%) ofthe VOC mass was emilled in the diffu·
sionRcontrolledperiod overalongperiod a/time. Comparison
between the commercial wood stain and an artificial wood stain suggestedthat.the pigments/solids in the wood stain had
significant effect on the time scales and amountofmass・ュゥエセ
ted duringeachemission period. Thepresenceofadditional VOCs in the commercial wood stain might have also affected the emission prof/les. These results are u.sefulfor developing beller modelsfor predicting the emission rates. The electronic balance method was also compared with those determined
from the 1VOC concentrations measured at the chamber exhaust (refemd to as "chamber method"). Results show that the two methods agreed well with each other. co,ljirming the validity of the complete mixing assumption that is often used in environmelltal chamber testing. These results are usefulfor
developing standard test protocols for testing "wet" building
materialssuch as wood stains, varnishes, and paints.
INTRODUCTION
Data on the emissions of volatile organic compounds (VOCs) from building materials are needed to assess the impact of building material off·gassing on the indoor air qual-ity of buildings. This study deals with the emissions of "wet" coaling materials such as wood stains, varnishes, and paints. These materials are wet when they are applied onto asubstrate and graduallydryfrom the surface down. Because "fthe phase change associated with the drying process, the emission char· acteristics of these materials arc affected by both the substrate and the application method. A standardized procedure for preparing the substrate and applying the test specimen is necessary to obtain repeatable results.
Using small environmental chamhers. previous studies
have indicated that the emission process of "wet" materials
appears to consisl o£two periods:(I)an initial periud with a high and fasl decaying emission rale. which is primarily controlled by the evaporative rna." transfer; (2) a second period with a low and slowly decaying emission rale, which is primarily controlled by the internal diffusion of VOC through Ihe substrate surface (see Chang and Guo 1992; Wilkes et a!. 1996; Zhang et al, 1996a). Much progress has also been made in developing mass transfer models for the evaporalion. controlled period. Guo and nchenor (1992) developed an
JianshunS. Zhangisa research officer, Gang Nong is a technical officer, Chia-¥u Shaw is asenior researcher, and Jiemingwセァ is afonner technical officer in the lndoor Environment Program at the Nationalセアウ・。イ」ィ Council Canada, Ottawa, Ontario.
BG⦅NLセMMMMM⦅N⦅ML⦅
..⦅LN⦅LセNMMMMMMMMMMMMMMMMMMMMセ
evaporative mass transfer model for TVoC emission from
interior architectural coatings. Spark et ol. (1996) discussed the application of gas-phase mass IriInsfer models for indoor pollutant sources. Guo et 01. (I998)further developed a mass transfer model for predicting the emission rates of individual VOCs from petroleum-based indoor coalings. However, progress in modeling the internal diffusion-controlled emis-sion period is limited, partly duetothe lack of experimental data. Chang et aI. (1997) found that substrate significantly affected the emission rates and patterns ofVeCs from a latex paint. The substrate effect makes it moredifficultlo model the
internal diffusion-controlled emission period for "wet"
coat-ing materials.
In this study, a test method using an electronic balance was introduced. which enables a more direct measurement of the total vec emission rate than the environmenlal chamber testing method. The objectives of the present study were to (I) provide experimental data for a better understanding of the emission characteristics of wood stains that are applied on a realistic substrate andto(2)develop and evaluate a method for preparing test specimens. The results are useful fordeveloping better mathematical models for predicting emission rates and for developing standard emission testing methods and
proce-dures for "wet" coating materials such as wood stains, paints. varnishes, etc.
EXPERIMENTAL Conslderallon
Both a commercial wood stain and an artificial wood stain (a mixture offive pure VOC compounds containing the major compounds in the commercial wood stain) were tested in this study. Because the artificial wood stain contained no addi-tives, all its mass applied was expected to be emitted from the
substrate. Thus,itwas possible to use the same substrate for
suhsequent tests to eliminate the substrate effect. It also
provided reference data for comparison with the emission
characteristics of the commercial wood stain so that the effect of the pigments in the wood stain on the emission rate could be identified. A total of five tests were conducted on the arti-ficial wood stain, and three pieces of oak boards were used as the substrates, Two of these substrates were each used twice, For the commercialwoodstain, a total of nine repeat tests were conducted. Adifferent piece ofoak board was used as the subotrare for each tesl. The purpose of conducting the repeat tests was to allow quantification of the experimental uncer-taintyas well as the emission characteristics ofthe wood stain.
Testing Facility and Conditions
Experiments were conducted in a full-scale (5 m x 4 m x 2.75 m high, 55
ni
3in volume) environmental chamber (Zhang et aI., 1996b). The chamber was operated under afull exhaust mode (I.e., no recirculated air) with the following, conditions:Supply airflow rate; 2.5 ACH.equivalent10
,2BO
8,23 Us(81 tt'/min)
Return/exhaust air temperature: 23 ±O.5'C Return/exhaustair relative humidity: 50% :t2% RH The supplyair was well mixedwith the air in the chamber
as
verifiedーイ・カゥッオウャケHzィ。ョァセエ aI.,1996b). The tetnperature and relative humidity measured at the returnairduct. were represen-tative ofthe avcrage condition. in the chamber lUld were' used as the reference for controlling the Sonditions in the cbamber.An electronic balance was used to monitor the weight loss due10the VOComissions from the test wood stains. The reso-lulion oftheelectronic balance was 1.0 mg. The weight of the wood stain/subsIrate specimen was measured every 10 seconds during the first 15 minutes. The measurement frequency was reduced to every 30 seconds between the 15th and 60th minute. and every I minute after 60 minutes of the lest. Data were recorded by a microcomputer that was connecled to the clectronic balance via a RS232 communica-tion cable. Figure 1 shows a schematic of the experimental setup.
The electronic balance was located at a corner of the chamber so thaI the supply air would not blow directly on the test specimen. The local air velocity, measured by a hot wire anemomeler at 10 mm above the specimen surface, was approximately 0,03 ± O.ot m/s (about 6 Nmin). For the commercial wood stain tests. in order to compare the results between Ibe electronic balance test method and the conven-tional chamber test method, the TVOC concentrations were also measured by using a gas monitor at severdl locations, including the rctum/exbaust air duct and the center and corner of the full-scale chamber (Figure I) al six-minute intervals. The gas monitor was calibrated by using cyclohexane (C6H
1V
as the reference gas.Tesllng Malerlale
Two material samples were used for this study: an oil-based commercial wood stain and an artificial "wood stain." The commercial wood stain wa.s purchased from a local store.
Ithas four major compounds. identified in a previous study for Ibis product (Zhang et al. I996a): nonane, decane, undecane, and dodecane. To estimate the totol emillable vec content in the wood stain, a small amount of wood stain was applied onto a glass plate and its weight loss was monitored over a period of 454 hours (about 19 days) at 23 ±I'Candapproximately 1 atmospheric pressure. The results of three such teslS are listed in Table I, whicb indicates that the emittable VOC content was approximately 73.25% ±O.54% of the initial wood stain mass, assuming that all the weight loss was due to the vec
emis-sions.
The artificial wood stain was a mixture of five pure
compounds including:ョセッ」エ。ョ・N n-nonane, n"dccane,ョセオョ、・ᆳ
cane, and n-dodecane. The properties of these compounds and their fractions ill the mixture are listed in TobIe 2. Because the
artificial wood stain does not contain any 'additives, it was
expected thaI the total emittable mass of tbe artificial wood ASHRAE TransactIons: Research
°U Oak wood substrate
./r---,..--
-..-
-....
_
..-Formula M.W. VaporPressuno' MoIarFra.:lion Welght Fraction
(mmHill ('llo) C,H" 114 12.07 0.1 8.03
c.H'D
128 3.93 0.2 18.03 . ClOH22 142 1.25 0.4 40.00 CIl H24 156 0.35 0.2 '21.97 C12H" 170 0.12 0.1 11.97 . 281 ElectrQnic balanceTholl Test 2 Thol3
Mean Std.
(WO=0.329 III (WO=0.335 III (WO=0.114III
48.632 49.851 56.140 31.341 4.029 67.477 64.776 69.298 67.184 2.275 72.644 73.134 73.684 73.134 0.520 72.644 73.134 73.684 73.134 0.520 72.644 73.134 73.684 73.154 0.520 72.644 73.433 73.684 73.254 0.343
IIthe lime ofrra.sureme.oL
TABLE 2
the Mixture Compounds and their Molar Fractions In theArtincialWood Stain
ch
the experimental setup. Gas monitor sampling loeatiolls: A-camer, B-center, and C-retuml uct.
TABLE 1
BetweentheWeight Loss and Initial Weight of Wood Stains Applied on Glass Substrate
Figure1 Schematic of exhaust air d Percentage Ratio
<%>
Elapsedtime (hour) 0.33 0..85 120.17 138.33 --162.53 454.02• Weight lossセ JnJtial welahE - weight
Properlles of Compound n-Ocranc n-Nonane n-Decane o-Undecane .... n-Dodecane
RSセc
(fromVOCBAS'S 1996).ASHRAE Transactions: Rasear
·
..
·
·
..."'"
Q 1\111 o All 0.8 •I
11
t •.
J
0••Flgurtl3 Measured weight decay dala for the commercial wood slain. Plotted every 50 measured points.. see Table4for value.• of Woo
Emleslon Rates and Emission Periods
.,L ...J
o 11 1.
, L --: J
o tI 11 1. 21
Assuming that the weighlloss is equal to the amount of volatile organic compound (VOC) mass emitted from the wood stains, the emission "ate can be calculated by
E(t)= - d[w(t)]/dt;' ak1exp(-k1I)+b
k2
exp ("'f0.t). (2)a,
b, k1•f0.
=
constants whose valuesare detennined by themethod of least squares regression analysis. It wiII be seen later thatok}andセ correspond to
theinitial emission rates of the fl1"St and second exponential decay processes, respectively. Tables 3 and 4 list the regression analysis results. The coefficient of determination(R2)was higher than 0.98,
indi-cating that the measured weight decay data can be very well represenled by EquationI.
I ..ll!0 - - - -_ _- - - ,
Figurtl2 Measured weight decay data for the artificial
woodstain. Plotted every 50 measured points: see Table3for values of Woo
stain would be 100% of the initial mass under the test condi-tions (23'C and 50% RH).
Testing Procedure
For each test, the oak wood suhstrate (250 mm " 240 mrn " 10 mm thick) was first conditioned in the full-scale chamber until its temperature and moisture conditions were in equilib-rium with the ambient air as indicated by acon.tant reading of the electronic balance, indicating that therewasno more mois-ture loss or gain (which took at least 72 hours). During this period, itwasfound that the reading of the electronic balance was very sensitive to the relative humidity fluctuation in the chamber. The control system of the chamber was, therefore, improved to reduce humidity fluctuation to less than :1:2% RH (note that tbe precision requirement for most stJIndord
envi-ronmental chamber lests is :1:5% RH).
The commercial or artificial wood stain was then applied onto the suhstrate outside the chamber. Appendix A describes a detailed procedure for preparing test specimens, which was developed after trying several different techniques. The spec-imen was then placed on the electronic balance. The whole process took approximately two to three minutes to complete. The time when the lest specimen was placed on the balance was defined as ''Time Zero."
RESULTS AND DISCUSSIONS
Measured Weight Loss
Figures 2 and 3 .how the measured weight decay for the artificial wood stain and commercial wood stain, respectively. The curves in Figures 2 and 3 indicate that the weight of both artificial and commercial wood stains decreased very fast initially, but the rate of decrellse slowed down with time. The measured weight became relatively stable after a certain period of time.
For tbe artificial wood stain, Test Alb was a duplicate of Test AIa. using the same piece of oak boardasthe substrate, and Test A2b was a duplicate ofTest A2a. Figure 2 shows that tests conducted with the same piece of oakboard(Tests Ala and Alb, Tests A2aand A2b) gaveverysimilar results. This suggests that the procedure used for applying the wood stain was able to provide very consistent results on the normalized weight loss despite the small difference in the amount of mass applied. It also suggests that the variation in the substrate materials may be mainly responsible for the variation in the results shown in Figure 2 (between Tests AI, A2, andA3)and Figure3.
To faciIitJIte further data analysis, the following double exponential equation was used to describe the measured weightdala:
w(t) .. aexp(··k, t)+bexpHセエI (I)
where
w(1)
=
weight of wood stains remaining on the specimen boord. 109;TABLE 3
Regression Results on MllllsurlldャGHセ for Artlficisl Wood Slain Using the Double Exponential Model"
TestID Ala Alb A2a A2b A3 Moan RSD,%'
_.-WO,g 3.931 3.744 4.782 4.392 4.062_
....-
-_
..
4.182_.
9.810 a 2.792 2.607 3.110 3.337 .3.009 2.971 9.516 b 1.135 1.I36 1.640 1.082 1.048 1.208 20.224 k, 0.805 0.845 0.738 0.675 0.791 0.771 8.549 k, 0.024 0.026 0.031 0.032 0.039 0.030 18.920 R' 1.000 1.000 1.000 1.000 0.999 1.000 0.009 (ak,)/(bIe,) 82.456 74.709 44.624 64.910 58.703 65.080 22.449 k,/k, 33.513 32.556 . 23.527 21.039 20.438 26.215 24.191 t1•h 5.65 5.26 5.38 6.49 5.42 5.64 8.79 12'h 1l.54 10.88 11.89 13.65 11.S4 11.90 . 8.76 mLimセE 73.94 72.69 69.13 79.67 77.94 74.67 5.63 mゥmセE 78.01 77.09 75.72 84.72 83.37 79.98 5.02 HmLMmLIOmセ % 4.07 4.40 6.58 5.05 5.42 5.11 19.18 • Emittlng surface area: A.. 0.060 ml foralltests,total emtnable mus:MrmWoot ReJallve SWldard deviation: ratio betweenfbeSlandard deviation lUId the mean value.
TABLE 4
Results of the Regression Analysis on キHセ for Commercial Wood Slain Using the Double Exponential Model'
TestID CI Cl C3 C4 CS C6 C7 C8 C9 Mean RSD,%'
-WO,8 4.360 4.711 3.910 4.846 4.411 3.667 4.046 4.340 4.212 4.278 8.69 a 1.453 1.379 1.759 1.400 1.509 1.255 1.283 1.178 1.219 1.382 12.98セM
2.797 3.210 2.068 3.248 2.853 2.282 2.676 2.997 2.882 2.779 14.12 k, 1.026 1.177 1.661 1.373 1.314 1.574 1.452 1.213 1.464 1.362 14.80 k, 0.009 0.012 0.010 0.013 0,017 O.Oll 0.010 0.008 0.012 0.011 24.99 R' 0.998 0.998 0.998 0.998 0,999 0.999 0.999 0.998 0.999 0.998 0.04 (ak,J/(b k,) 61.214 43.675 134.938 47.081 40.003 82.312 71.594 61.931 51.558 66.034 44.25 k,lk, 117.854 101.688 158.675 109,225 75.602 149.604 149.289 157.523 121.918 126.820 22.74 tl,h 4.04 3.24 2.97 2.83 2.84 2.82 2.96 3.42 2.72 3.09 13.59 1.2,h . 8.57 7.19 5.76 6.21 6.40 5.77 6,15 7.24 5.89 6.58 14.17 mLOmセE 47.79 31.13 46.28 30.64 36,52 35.65 33.17 28.52 30.58 46.64 15.43 mLェmセE 51.77 34.70 48.07 33.92 41.01 37.89 35.56 30.90 33.60 50.60 13.69 (M,-M,)/M'l'% 3.98 4.88 2.45 4.48 6.13 3.06 3.27 3.24 4.11 3.96 28.17• ErnittillJslHface area: A .. 0,(160 mZfor alltut$;((Ita!emitlllble:mass:
Mr ..O.732S4Wo crable I).
t Relative standard deviation:nnobetween the 3lADdard deviation lIld the meanカN「オセN
'""'
Equation 2 is identical to lbe double exponential model proposed by Colombo et al. (1991) for describing the VOC emission rates measurod in small environmental test cham-bers.
Equation 2 assumes lbal VOC emissions from wood
stains may consist of two first-order decay processes. That is,
=
ak,. representing lbe initial emission.rate of the iIrst exponential decay process witll kl being tlle decayconstant;
E(I)= E,(I)+E,(I), (3)
where
E1(0)
EI(I)=EI(O)exp(-kll),
E,(I)'" E,(O)exp (-.I)t),
(4) (5)
...セセMMセN⦅M⦅N⦅MM⦅
_.---.
__
.__
"--'---
. _
-..
10 12 ntne:l,h•
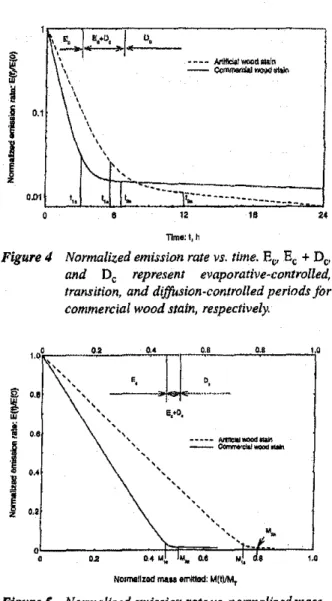
Normalized emission rate vs.tiltle. EcrEe:;+De:;.
and Dc represent evaporative-controlled,
lransilion, and diffusion-controlled periods for
commercial wood stain, respectively.
,
GZGセN
E,'O,I
".
\_.
,
wセ _ _ Mlflclat IWlCtllllRln \ - cHョャャセ woiャヲjセ 1 \ \ \ ,,,
セG
'" 1'"
\. k
---li:---____
1.000'
a. 0.' 0.' 1.0,
,,,
"
"
, li: 0.' ,,
セ ", w ,, セ...
セ 0.' ,", ----. AIIIlI:lU1IIQOCllMl1I
,,, ----,,,
0.' ,J
,,,I
,
,,0.'
,, z ,,, ,".
" , 0 0,.
0,4 l.l,.".
oo No.•
'.0
ODs:
セ
セ
I
o.J
Figure4NOl/na!I:r:Olf mUll emlttod: M(t)JM,.
Figure5 Normalized emission rale vs. Ilormalized rooSs
emitted. EC' Ee + DC' and Dc represent
evaporative-controlled, transition, and
diffusion-colllrolled periods for commercial
wood stain,·respectively.
ASH RAETransactJons: Research
FigureS gives the mean valuesofM! andM2for acurve
show-ing the nonnalized emission rate vs. the amount emitted since
time zero. Both figures indicate that the II and /2 (orMJand
M2)may be used to divide the emission process into three
distinct periods, although their definitions are somewhat
subjective:(I)an initial emission period from 0toIt within
which the VOC emission process is controlled by evaporation,
(2) a transition period from 11to12 within which the emission
is controlled by both the evaporation and internal diffusion,
and(3)a period beyond 12(i.e., I>t2)within which the
emis-sion process is controlled by internal dIffuemis-sion (i.e., the portion of emissions controlled by evaporation becomes insignifi-cant).
The values ofII.and 12 for the connnercialwood stain were
smaller than those ofthe artificial wood stain (Tables3an" 4).
(6)
(8) (7)
(9)
ak,»bk2andkl»k2•
This means thatEI(I) represents an emission process with
a high initial emission rate and a fast decay rale (i.e., large decay constant), while Eil) represents an emission process with a low initial emission rate and a slow decay rate (i.e., small decay constant). As wood stains are supposed to pene-trate the material to which they are applied for protection, it is postulated that as soon as a wood stain is applied on a substrate, some of the wood stain will penetrate into the substrate, carrying with itsome of the VOCs. The VOCs in the wood stain on the surface will evaporate at a high initial emis-sion rate as it dries up. As the amount of VOCs on the surface decreases and as the stain gradually dries up, the emission rate
decreases quickly. This correspondstothe first portion of the
VOCs emitted, whose emission rate is controlled by evapora-tion aod is represented by Etll). The second porevapora-tion of the VOC. include those initially penetrated into the substrate and those absorbed in the pigments (in the case of the commercial
wood stain). The second portion of VOCs need to diffuseto
the surface before they are evaporated into the air, and, there-fore, their emission rate is primarily controlled by internal diffusion through the substrate and/or pigments, resulting in a low and slowlydecaying emission rate as represented by£2(1).
We propose to define two time scales, It ana t2' at which
E2(0) "b k2•representing the initial emission rate of the
second exponential decay process with k2being the
decay constant.
As shown ill Tables 3 and 4, for bo\h the artificial anJ connnercial wood stains. Equation 2 has the following
char-acteristics;
The VOC mass emined from time 0 to timeI Iand trom
time 0 to 12can be calculated by Equations 10 and 11,
respec-tively.
M1"a[1 - exp (-klI,)]+b[I - cxp (-k2It)] (10)
M2 " a[1-exp (-kl(2»)+b[1 - exp (-k2(2)] (II)
and
and
Using Equations 4 and S in Equations 6 and 7. respec-tively, it can be derived that
The values ofI" 12,M I, andM2for each tests are listed in
Tables.3 and 4 for the artificial and commercial wood stains, respectively. I'igure 4 shows the mean values of II and 12for
a nonnalized emission rate, E(I)lE(O), vs. time curve, and
"
"
.1Z TfilllI:t,h...
セMMMMMMセMMMMMMMMNNL 1O,L _•
Figure6 Varialion of the relalive slandard devialioll of
emission' rateキゥエィエゥセN
One of the reaSons may be the presence of pigments/solids in Repeatability of Emission Testing
tbe commercial wood stain, which would affect the vac Experimental measurements ofVOC emissIon rates inev-emission in two ways: (I) they contain some VOCs and these itably involve certain uncertainties that cause variations in VOCs would have to diffuse to the surface before emitting into emission testing results. h.e. nmerepeattests .a eT . ('" bl 4).can eb the air, resulting a reduced amount ofVOC, emitted during the . h b'I' th be . II
initial evaporation-controlled period and, hence, a smaller11; used to evaluate t e repeata IIty at can practlca y
achieved under awell-controlled environmental testing condi-(2) the pigments would also be a barrier for the vacs under tion. Such information is needed for setting quality assurance thcm to diffuse to the surfacc, resulting in a decrease in the criteria in a standard material emission testing method,Itis
emission rate during the diffusion-controlled period. NMMM。ャウッョ・・、・、ヲッQBケ。u、。エゥョセュ。エィ・ュ。エゥ」。ャュッ、・ャウゥッイZーイ・、ゥ」エゥャャァM . . Another reason may be the blend of other vacs (in addi- VOC emission rates,
tion10the five VOCs in the artificial wood stain tested) in the The repeatability of the tests conducted can be assessed
commercial wood stain. Blending of ti,e additional VOCs by the relative standard deviations (i.e., standard deviations might have increased the volatility of the solvent mixture and divided by the mean values) of the characteristic parameters, ledtoa shorter11'Industries often use different "blending" which are listed in Table 4. In the assessment of the impact of
strategies to control the volatility of the solvent mixture and, material emissions on the indoor VOC concentrations, it is hence, the drying rate of architectural coatings such as wood often necessary to know the emission rate as a function of stains and paints. The blending effect would mainly affect the time. Figure 6 shows how the relative standard deviation ofthe first emission period, which is an evaporation-controlled emission rate changes with time based on the res)llts of the process. However, it does not explain the larger percentage of nine repetitive tests. It shows that the relative standard devia-VOe mass that remained after the first emission period of the tion of tile emission rate was approximately 23% at time zero commercial wood stain compared to the artificial wood stain, (conventionally called the initial emission rate). It dropped to which is most likely duetothe presence of pigment'lisolids in a minimum value of about 12% atI= 1hour, increased to the the commercial wood stain. maximum value of about 30% at I
=
3 hours, and then decreased (with asmall fluctuation) with time to 25% att=24 hours. In general. it may be concluded that 25% to 30% rela-tive standard deviation could be expected in the determination of the emission rate with the test procedure used in this study. This amount of uncertainty represents the case when the wood stainisapplied onto an oak substrate as typically used to treat the floor of housos.' Using a board with less grain variation (such as a maple wood board) as the substrate, less variation in the measured ern;'"ion rate may be expected,Using the proposed method for preparing test specimens, the amount of mass applied varied from 3,74 g to 4.39 g with a standard deviation of 9.8% for the artificial wood stain (Table 3) and varied from 3.67 g t04,85 g with a standard devi-ationof 8.69% for the commercial wood stain (Table 4). These As aresult,11and12were shorter for the commercial wood
stain(lIeand12,)than the artificial wood stain(r[,and(20)'as
shown in Figure 4. In addition, Figure 4 indicates that
'2,-1[,>I",,-I,c' suggesting that the transition period for the commercial wood stain was shnrterthan for the artificial wood stain. These results collectively suggest that the effect of pigments and VOC blending on thevoe
emission rates needs to be accounted for in future mathematical modeling of theemission process.
As shown in Figure 5, the vae mass emitted during the evaporation-controlled period was 74.79% and 35.59% of the total emittable vae content for artificial and commercial wood stains, respectively. This means that a signiflcant amount of vae mass was emitted in a relatively short period oftime due to evaporation (on average, 5.64 and 3.09 hours for the artificial and commeteial wood stains, respectively, as shown in Figure 4). The VOC mass emitted during the transi-tion period represents only a small percent of the total emilta-ble mass (4.99% and 3.01% fot the artificial and commercial wood stains, respectively). The remaining vacs emitted slowly during the internal diffusion-controlled period.
It should be noted that11and12are strongly dependent on
the evaporative .tIlass transfer rate, which, in turn, strongly depends on the environmental conditions such as the air veloc-ity over the surface according to fundamental mass transfer theory (e.g., Kays and .crawford 1980). On the contrary,M[
andM2may be less dependent on environmental conditions since they represent the amount of VOCs available for emis-sion during the evaporation-controlled and the evaporation- . controlled-pIus-tranSition periods, respectively, regardless of the length of each period.
NセMMMM⦅N⦅ ....
_._
...,. . ⦅N⦅MMMMMMMセ..
I.'
Emission !'lates Calculated from the Concentrations of the ReturnJExhaust Air
•
M,(I.) =O.SQ!: [C,(t,)+C,(I,>1)](1,> 1-/') (12)
'.0
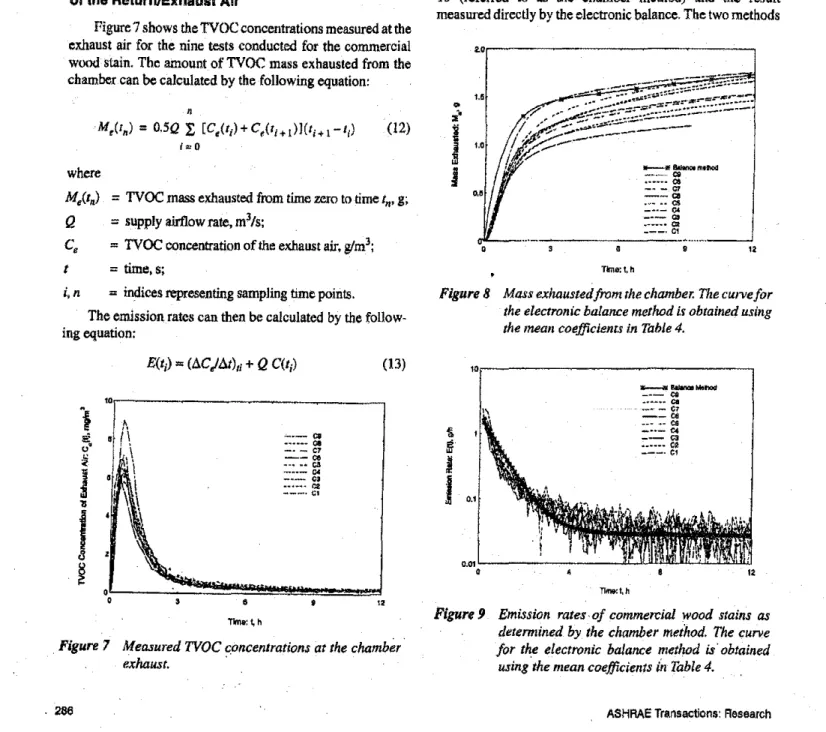
Figure 7 shows the TVOC concentrations measured at the exhaust air for the nine teats conducted for the commercial wood stain. The amount of TVOC mass exhausted from the chamber can be calculated by the following equation:
Time:t,h
.
"
/ __
L[[[[jゥゥゥゥゥャゥヲゥセセ[ᄋ
OゥセセセMMMMMMᆳ
!,f;::---, -..llaiInclImtllod MセN⦅MB ($ •••••• C& _. -.r;, - - Q ."" •• C'l _ •• - 0' ___ C3 .-_••• C2 ___ . Cl 1.'
••
NPイMMMMMMMMMMMMMMMセ (I:.C/I:.t)"=0.5([C(t,)- C(tl.t)]/(ti - 1,.,)+
[C(tl".t) - C(t;)]/(I}>!.- tl)}'Figure 8ウィッキセ the TVOC mass・クィ。オセエ・、 from the air
calculated from Equation 12. The results show that the TVOC mass exhausted during approximately the first one-and-a-half hour was significantly less than that measured by the elec-Ironic balance. This was probably caused by the tinne delay required for the VOCs to build up in the chamber and reach the chamber exhaust. However, the overall difference between the TVOC mass exhausted from the chamber and the weight loss measured by the electronic balance is considered to be within the experimental variation.
Figure 9 shows the emission rates calculated by Equation 13 (referred to as the chamber method) and the result measured directly by the electronic balance, The two methods
where
=TVOC mass exhausted from time zero to time tn' g.
= supply airflow tate. m'/s;
= TVOC concentration oftlle exhaust air.
woo';
::= time, s;
results suggest that the amount of mass applied may be
controlled within,tl0% of a target amount using the
applica-tion procedure proposed in this study. Based on the results of the artificial wood stain tests (Ala and Alb, A2. and A2h in
Figure2),it appears that the amounts of mass applied have
little effoct nn the normalized weight vs, time curve if the amounts ofmass applied can be controlled within 10% ofeach other. However, it is not clear whether a larger than 10% differ-ence in the amount ofmass applied will cause significant vari-ations in the test results. Therefore, as a quality assurance
criterion ina standard test procedure for "wet"coatingュ。エ・セ
rials, it is recommended that a criterion he set for the differ-ence between the actual and larget amount of wood stain applied. where Mit.) Q HNセ t
,
I
iI
I
I
j
,,,
"'
,
1i, n = indices representing sampling time points.
The emission rates can thenbecalculated by the
follow-ing equation:
Figure8 Mass exhaustedfrom Ihe chamber. The cUlvefor the electronic balant:e methodisobtained using the mean coefficients in Table 4.
E(t,)=(I:.C/At)" +QC(t,) (13) QoLMMMMMMMMMMMMMMMセ TIme:セ h _llalInaIh4etlOCl___ 'CC1 •• - ••• CI _"' - (:7 --co _ _ _4 _0& _ •• - C4 .,.._ C3 _.'••- ell --_. el Thrw.1, h 0.01o'---...il.i:CJUwJll'-"'==lffi1W"
Figure9 Emission rates· of commercial wood stains as ele/erminedbythe chamber method. The "urve for the electronic balance melhod is' oblained using Ihe mean coefficients in Table 4.
' - . - CI •••••- CI - . _ C7 - - co .-••• C4 _ •• - C4 - - - C3 •••••• l:l _ _ _ • (;1
"',---l
..
,', • 1\ o'i'\
セJ
•
,
I\
\
"
f
\-\
セ,
'1
セ
'l!
Figure 7 Mea.sured TVOC concentrations at the chamber'
exhaust.
agreed well with each other in general. cnnfInning the validity ofthe "perfect mixing" assumption that is widely used in envi-ronmental chamber testing. The fluctuation of emission rates measured by the cbamber method may be attributed to the experimental uncertainty in measuring the concentration as well as possible concentration fluctuations at the cbamber exhaust of concentration as shown in Figure 9.
SUMMARY AND CONCLUSIONS
A method of testing VOC emissions using an electronic balance has been introduced in this study. A detailed proce-dure for preparing the test specimens of wood stains has also been developed. The method and procedure were used to
determine the emission characteristics of an artificial and
commercial wood stain when they were applied to an oak board. The following conclusions can be made from this study:
I. voe emissions from the wood stains include both
surface-evaporation and internal-diffusion processes. The entire
emission time may be divided intothreeperiods:(I) an initial period in which the emission rate was controlled by evaporation and characterized by a high and fast decaying el11ission rate, (2) a second (transition) period in which the emission. transited from an evaporation-controlled to an internal diffusion.contrnlled process, and(3)athirdperiod in which the emission rate was controlled by internal diffu-sion and was characterized by a Jawandslowly decaying emission rate. For the commercial wood staill tested, the length of the initial period was appruximately three hours. and about 36% of the emittabJe voe mass was emitted during this short period. The transition period was between 3 and 6.5 hours from the slllrt of testing and only accounted for about 3% ofVoe mass emitted. The remaining amount. about 61% of voe mass. was emitted in the diffusion-controlled period.
2. Comparedtothe artificial wood srain (I.e.• a voe mixture containingmajor compounds identified from the commer-cial wood stain). the commercommer-cial wood stain had a shorter inilial emission period. The amount of mass emitted from the commercial wood stain during this initial period was also significantly less Ihan from the artificial wood stain tested. The transition period for the commercial wood stain was also shorter than' the VOC mixture. leaving more VOCs to be emitted during period controlled by intemal diffusion. These differences in emission characterislics between commercial and artificial wood stains mighlbe
atUibuted10the presence of the pigments/solids and the
blending ofadditional VOCs in the commercial wood stain. The results suggest thaI further studies are needed to deter-mine the effect of pigments/solids and VOC blendingon the VOC emission rates of "wet" coaling materials.
3. Emission rates determined using the electronic balance tesl method in this study maybeexpecled10have a relative
ASHRAETransaCtions: Research
standard deviation ofaboul25% to 30% based on the results of nine repetitive tests conducted.
4. Using the concentrations measured at the full-scale cham-ber exhaust to detern,ine the emission rate obtained results similartothose measured directly by the electronic balance method, This "onlim.s the validity of the "perfect mixing" assumption that isキゥセ・ャケ usedinenvironmental ch8lllber testing.
The above results are useful for developing a standard VOC emission test method for "wet" coating materials in general. They are also useful for developing better mathemat-ical models for predicting the VOC emission rales of "wet" coating materials.
ACKNOWLEDGMENT
The authors would like to thank the assistance of Dr. Malgosia Kanabus·Kaminska, Mr. Bob Magee. and Ms. Ewa Lusztyk in conducting the experiments. Thc financial support from the members of Consortium for Material Emissions and IAQ Modeling (CMEIAQ), the Canadian Panel for Energy Researcb and Developmenl(PERD).andNational Research Council of Canada (NRCC) is appreciated.
REFERENCES
Chang. C.S.• andZ. Guo. 1992. Characterization of organic emissions from a wood finishing product-Wood stain.
Indoor Air2: 146-153.
Chang. C.S., B.A. Tichenor. Z. Guo. and K. Kreb. 1997. Substrate effects on VOC emissions from a latex paint.
Indoor Air7: 241-247.
Colombo, A" M.D. Bortoli. E. Peechio,H. Schauenburg. H. Schiltt, and H. Visscrs. 1991. Small chamber lest and headspace analysis of volatile organic compounds
emit-tedfrom household products. Indoor Air 1991,I:13-21. Guo.Z.,aod B.A. Tichenor. 1992. Fundamental mass trans-rer models applied to evaluating the cmissions of vapor-phase organics from interior architectural coatings. EPNAWMA Symposium. Durham. N.C.
Guo, Z., L.E. Sparks. B.A. Tichenor. and J.C.S. Chang. 1998. Predicting the emissions of iudividual VOCs from petroleum-based indoor coatings. Armospheric
Environ-ment,32(2): 231-238,
Kays, W.M.• and M.E, Crawford. 1980. Convective heat and
mass transfer. New York: McGraw-Hill Book Com-pany.
Sparks. L.E., B.A. Tichenor. J. Chang. and Z. Guo. 1996. Gas-phase mass transfer model for predicting volatile organic compound (VOC) emission rates from indoor pollutant sources. Indoor Air 1996.6: 31-40.
VOCBASE. 1996. National Institute of Occnpational Health. Denmark. The Producl Register Dept., Postboc 850. DK·2100 Copenhagen, Denmark. .
Wilkes C., M. Koonl?'. M. Ryan, and C. Cinalli. 1996. Esti-mation of emission profiles for interior latex paints.
1ndoor Air1996, 2: 55-60. The 7th International Confer-ence on rodoor Air Quality and Climate, July 21-26, 1996. Nagoya, Iapan.
Zhang, J,S" C,Y. Shaw, J,M. Kanabus-Kaminska,R.A. Mac-Douald, R.I, Magee, E, Lusztyk, and R.I, Weichert. 1996a. Study ofair velocity and turbulence effects on organic compound emissions from building materials! furnishings using a new 'mall test chamber, Characteriz-ing sources of indoor air pollution and related sink effects, ASTM STP 1287, Bruce A, Tichenor. ed., pp. 184-199, American Society for Testing and Materials. Zhang. I,S" I,M, Kanabus-Kaminska, and C, Y. Shaw.
1996b. A fuJI-scale test chamber for material emission studiesaodindoor air quality modelling. Characterizing sources of indoor air pollution and related sink effects, ASTM SIP 1287, Bruce A, Tichenor, ed" pp. 58-66. American Society for Testing and Materials,
APPENI)IXA
DETAILED PROCEDURES FOR PREPARING THE TEST SPECIMEN'
A1,Preparation of the Substrate
Note: The above procedure was adopted after experimenting with several alternatives (such as application with laboratory tissues. application directly with a wider brush. etc,) and was found to proVide reasonably good control on theamount of wood stain applied while achieving good uniformity. The entire procedure
tookabout2,0:1:1.0minutes.
288
AU Randomly select a piece of oak board and plane the swface(0produceaIO-mm-thickboard,
AI,2 Cut the board into250)( 240piecesaodsand them with grade 100 sandpaper,
AJ.3 Condition the substrate in a space maintained under the test conditions (i,e., 23°C and50%RH)until their weight beoomes constant (whichtakesa minimum of72hours).
Al.4 Cover the hottom face and the four edges ofeach oak hoard with aluminum foil to minimize the adsorption of VOCs or moisture onto these surfaces,
Al.5 Weigh the substrate (i.e" oak hoard with the aluminum foil) using an electronic balance,
A2,Appllcetlon of Wood Stain
A2.1 Place the conditioned oak substrateina laboratory exhausthood,
A2,2 Gently stir the wood stain in its original container using a glass tube to ensure that the pigments and solvent are well mixed,
A2,3 Pour approximately10mLwood stain into a 48-mm-diarneter, 16-mm-highpetridishaodsoaka 15-mm-wide paint brush by dipping it fully into the wood staininthe petri dish.
A2,4 Use a suction tubetospread 4mLof wood stain onto the surface of the substrate, and immediately use the pre-soaked brush to uniformly distribute the wood stain on
the substrate, .
A2.5 Place theprepared specimen on the electronic balance in the chamber for testing,