HAL Id: hal-03221187
https://hal.archives-ouvertes.fr/hal-03221187
Submitted on 7 May 2021HAL is a multi-disciplinary open access archive for the deposit and dissemination of sci-entific research documents, whether they are pub-lished or not. The documents may come from teaching and research institutions in France or abroad, or from public or private research centers.
L’archive ouverte pluridisciplinaire HAL, est destinée au dépôt et à la diffusion de documents scientifiques de niveau recherche, publiés ou non, émanant des établissements d’enseignement et de recherche français ou étrangers, des laboratoires publics ou privés.
Scale electro-thermal model of a lithium-ion battery for
time-accelerated experiments in a hardware in the loop
process
Fabien Lacressonnière, Andy Varais, Xavier Roboam, Eric Bru, Timothé
Mullins
To cite this version:
Fabien Lacressonnière, Andy Varais, Xavier Roboam, Eric Bru, Timothé Mullins. Scale electro-thermal model of a lithium-ion battery for time-accelerated experiments in a hardware in the loop process. Journal of Energy Storage, Elsevier, 2021, 39, pp.102576. �10.1016/j.est.2021.102576�. �hal-03221187�
1
Scale electro-thermal model of a lithium-ion battery
for time-accelerated experiments in a hardware in the
loop process
Fabien Lacressonnière, Andy Varais, Xavier Roboam, Eric Bru, Timothé Mullins
Université de Toulouse, LAPLACE (Laboratoire Plasma et Conversion d’Energie); UMR 5213 ; CNRS-INPT-UPS, 2 rue Charles Camichel, BP 7122, F-31071 Toulouse cedex 7, France.
[email protected], [email protected], [email protected], [email protected] Corresponding author: Fabien Lacressonnière, [email protected], LAPLACE (Laboratoire Plasma et
Conversion d’Energie); 2 rue Charles Camichel, BP 7122, F-31071 Toulouse cedex 7, France. Tel. : +33 534 322 409
ABSTRACT
A scale electro-thermal model has been developed for LiFePO4/graphite lithium-ion battery. Such model is appropriate
in order to develop a physical emulation of a battery in the context of a hardware in the loop process, especially for testing energy management strategies of microgrids under the same conditions (solar irradiation for PV arrays, wind speed for wind turbine, state of health for storage device) and potentially by compressing testing time. Classically, physical emulation allows achieving laboratory size-scaled analysis but one major originality of the proposed approach deals with the “time-compressed experimental analysis”. The electro-thermal model is based on the extended modified shepherd model coupled with a 1D thermal model. The model parameters are estimated through a sequential characterization approach from several input profiles such as the hybrid pulse power characterization protocol and the open circuit voltage measurement. Both the dimensional analysis and the Vaschy-Buckingham theorem are used to obtain the scaling factors (voltage, current, “but also” time) which are applied on the original model parameters. The accuracy of the scale electro-thermal model is validated on a robustness analysis (the battery current profile is based on a specific energy management strategy for a typical microgrid application) with voltage, current and time scaling. The simulation results presented in the paper show that the reduction of the time horizon of experimental tests for HIL process is possible by means of an appropriate dimensional analysis (scaling) on the model parameters.
KEYWORDS
Lithium Iron Phosphate battery, Electro-thermal model, Scaling, Time compressed, Experiments.
1 INTRODUCTION
The integration of a battery energy storage system (BESS) in actual and future electrical applications is becoming a solution in order to offer new “services” especially with lower CO2 emissions. In embedded systems, the
2 BESS are widely used. Indeed, in electric vehicle applications, the market growth rate increases: the global electrical vehicle stock surpassed 2 million units in 2016 and the battery fed electrical vehicles still account for the majority of the electric car stock [1]. In the more-electrical aircraft (MEA) context, the BESS can be used in non propulsive network but also more recently in hybrid propulsion system to improve the overall propulsion system efficiency and to reduce the fuel burn [2]. For the emergency electrical network in aircraft, the hybridization of the ram air turbine with a BESS, associated with an optimized energy management strategy for power sharing has been recognized as an efficient way for reducing the mass of the overall system [3].
For stationary systems and more particularly in large power grids and microgrids, the BESS present also other major advantages in terms of grid services. Energy storage devices can harvest energy excess during periods of low demand and inject the stored energy in the grid during power peak periods [4–6]. The BESS can also be used to manage intermittent renewable energy devices (wind and solar power smoothing) in microgrids and isolated systems [7,8]. This storage device can also help for frequency control in power grids [9,10].
Hardware in the loop (HIL) process, consisting to replace physical devices by real time simulation, allows studying, optimize and verify the effectiveness of the energy management strategies (EMS) implemented in electrical systems. HIL process presents several advantages: on the one hand, compared with experiments on real (scale one) system, it is a low cost technique allowing multiple real time simulation to test EMS performance. On the other hand, this method allows non-destructive and low risk testing even under extreme and fault conditions. HIL process also offers strong experimental reproducibility which is convenient to compare several management strategies [11].
The HIL tests have been extensively used in the automotive industry for component development [12,13]. For instance, to avoid electric and thermal abuse on the BESS used in electrical vehicles (or in other applications), a battery management system (BMS) has to be associated with the actual storage device. In an advanced BMS, in order to maximize battery capacity and to limit aging effects, there are several functions implemented like active or passive balancing, thermal management, charging process and diagnosis (state of charge – SoC and state of health – SoH). To develop a sophisticated BMS, manufacturers may require extensive testing of both software and hardware devices. To test the diagnosis functions of the BMS, some faults (for instance over-charge and over-discharge) have to be provoked. In comparison with tests conducted on a real battery, the HIL tests appear more cost and time effective and more easily reproduce the same electrical and thermal environment conditions for BMS tests [14–17]. The HIL simulations are also built to test power electronics devices [18] for MEA power supply system and to test the automatic flight control system
3 of aircrafts [19]. Likewise, for microgrids applications, the HIL platforms become essential for testing and validating controls and energy management strategies [20]. In [21], some alternative HIL setups are proposed for real-time simulation and testing of microgrids. For the development and testing microgrid control and protection functions, a microgrid model (including diesel generators, BESS, PV plant and wind turbine) in a HIL environment has been developed [22].
The real time physical emulation is one method to provide realistic environments [20]. Physical emulation involves mimicking the behavior of the subsystems to be represented such as sources (PV system, wind turbine), storage (BESS, electrolyzer and fuel cell) and loads (consuming profiles). Hence, to emulate a complete power system (microgrid, electrical vehicle) several emulators, each replacing a physical subsystem, are connected together.
Sometimes, a real subsystem is coupled in the HIL simulator test bench instead of an emulator. This principle is often used to design the storage device implemented in an electrical vehicle. For instance, a real fuel cell can be connected to the HIL system to evaluate its performance during dynamic operating conditions [23]. To evaluate the performance of the battery in a virtual vehicle for different ambient temperatures, a real battery is used in a HIL simulator [24]. In this case, the method is called battery in the loop (BIL) or battery HIL [25]. This method can be used if the electrical characteristics of the battery are adapted to those of the HIL test bench. Otherwise, a battery emulator (or virtual battery) with scaling factors has to be developed [26,27]. To exchange bidirectional power flow between the virtual battery and the real electric test bench, the battery emulator is composed of bidirectional power supply operating in voltage source. The control signal of the voltage source can be created by the voltage response of a battery model [15] or by the voltage measured from a real reduced scale battery (typically the “physical image” for this latter emulator can be one a reduced number of test cells) [11].
The main contribution of this paper is related to the development of a physical battery emulator which allows to accelerate power HIL tests for microgrids applications. Thanks to the similitude process and based on the original idea proposed in [28,29], a “time acceleration” by considering a “virtual compressed time” is possible together with the reduction of physical scales (power, voltage, current). To study the effectiveness of the EMS according to different battery thermal environments, the real time emulated battery is based on a scale electro-thermal battery model. A major aspect detailed in the paper deals with a sequential approach for parameter identification: this approach aims at extracting, firstly all parameters related to the open circuit voltage (OCV), secondly the parameters linked with the voltage drops in the battery and finally other parameters defining the thermal model. The coupling between the electrical and thermal model is also detailed and experimentally validated. The paper is organized as follows. In the first part of
4 study, the electro-thermal battery model is presented and the scaling factors (voltage, current, time) are applied to the parameters of the model. Section 3 describes the experimental setup and the parameter extraction process. The parameters are estimated by minimizing the error between model outputs and experimental data from 18650 format LiFePO4/graphite Li-ion cells. Section 4 deals with the robustness analysis of the scale electro-thermal model; tests are
conducted by using a typical current profile extracted from microgrid application. First, without time accelerating, a comparison of the experimentally measured and simulated battery voltage is presented. Then, in addition of both voltage and current scaling factors, the time scaling factor is applied to the model in order to reduce the total time of experimental test. Finally, section 5 summarizes the main conclusions.
2 ELECTRO-THERMAL MODEL OF LI-ION BATTERY AND ITS SCALING
The scale electro-thermal model presented in this paper is used in order to develop a battery emulator in a HIL system especially for testing energy management strategies for microgrid applications. This model is implemented in a real time simulator and it has to provide for the EMS some macroscopic information of the battery energy storage like as the SoC, the voltage and the temperature. Fig. 1 presents the concept of the battery emulator and the test bench used for power HIL simulation experiments. The scale electro-thermal model is developed with matlab-simulink while EMS are implemented in the dSPACE supervisor in order to manage the HIL simulation experiments. The battery is emulated with a bidirectional DC power supply, which is connected to a common DC bus through a DC/DC chopper. From the battery power profile (Pbat(ref)), provided by the EMS, the DC/DC chopper controls the emulator’s battery current (Ibat).
This current is measured and scaled in order to create the scale battery current (Ibat(S)) for the scaled electro-thermal
model. From Ibat(S) and the thermal environment (Tamb), the real-time behavior of the battery is simulated. The voltage
reference (Vbat(ref)) for the physical battery emulator is built through the simulated scale battery voltage (Vbat(S)). The
EMS receives from the scaled electro-thermal model the SoC, Vbat(ref) and the simulated battery temperature (TS).
According to the evolution of theses quantities, the EMS drives the physical battery emulator for the power HIL simulation experiments. In Fig.1, the experimental test bench used for power HIL simulation experiments is presented. It is composed with several electrical power cabinet and each cabinet represents a physical emulator (battery storage, wind turbine, PV plant and others).
5 Fig. 1 Concept of the battery emulator (left) and test bench for power HIL simulation experiments (right).
Depending on its complexity, a battery model can affect the computation time, especially for electrical HIL systems. Indeed, beyond the accuracy of electrochemical models, their complexities affect computer performance (simulation time) during real time simulation [30]. Therefore, complexity of models must be carefully adapted in HIL real-time process. Furthermore, the real-time simulation of microgrids require long test time (several hours/days/weeks). Hence, a very high accuracy on dynamics response of the battery model is not necessary. In that context, the electro-thermal model presented in this paper is based on an equivalent circuit model (ECM) coupled with a 1D electro-thermal model. These models present lower accuracy compared to electrochemical models but their simplicity are suitable for HIL simulation [15]. They present a good compromise between the number parameters to identify and the accuracy needed for microgrids applications. Moreover, reducing complexity of the battery emulator model allows decreasing the computational power of the computer needed for HIL simulation.
2.1 ELECTRICAL MODEL
The electrical model presented in this study is a simple empiric model based on an extended modified shepherd model [31] in which several modifications have been made [32]. This model is commonly used in the modeling of multi-physical energy systems incorporating a battery storage in particular for studying energy management in hybrid systems [33–35]. Indeed, by its simplicity, this model is easy to implement in multi-physics and multi-scale systems. In this paper, the electrical model is used to develop a physical battery emulator in order to predict, in context of power HIL simulation, the performance of battery storage in microgrid applications according to different EMS and environmental conditions (battery temperature). Moreover, this model has to be suitable for time-accelerated experiments in a HIL process. Hence, as mentioned in previous paragraphs, the model has not to be complex to allow a low computation time
6 of the real time simulator. To reduce the complexity of the model, some electrochemical processes in the battery were neglected, which included:
• The OCV hysteresis phenomenon [36]. For BMS applications, to obtain accurate battery SoC estimation rely on the OCV measurement, the battery hysteresis effect can to be take into account [37]. On the contrary, adding the hysteresis component to the ECM increase the model computational complexity [38]. However, it is possible to minimize the effect of hysteresis on the SoC estimation by using an OCV curve from the average of the discharge OCV and the charge OCV [39]. In this paper, the SoC estimation is based on the ampere hour counting and not on the battery OCV. Then, the hysteresis phenomenon has been neglected in the electrical model.
• The OCV is not parameterized as a function of the temperature. In this study, the parameters of the OCV model are obtained by an incremental OCV measurement at 20°C.
• The internal resistances are not varied with the amplitude of the current. However, in our model, the resistances are coupled with the battery temperature. This ensures that the simulated battery voltage will depend on temperature. • The aging phenomena are not taken into account. In a future work, both the capacity decrease and internal resistance increase with lifetime could be taken into account with an aging model coupled with the electrical model. This aging model can be based on a cycle counting or ampere hour throughput lifetime models.
• The self-discharge of the battery is neglected. This phenomenon occurs when the battery is storage during a long time at elevated temperature [40]. In the paper, the electrical model is not subject at these conditions.
The electrical model is summarized as follow: 𝑉𝑏𝑎𝑡 = 𝑂𝐶𝑉 − 𝑅1𝐼𝑏𝑎𝑡− 𝑅2𝐼𝑏𝑎𝑡𝑓( 𝑏𝑑𝑐ℎ 𝑆𝑜𝐶+ 𝑏𝑐ℎ 1.1 − 𝑆𝑜𝐶) (1) 𝑂𝐶𝑉 = 𝐸0+ 𝐴𝑒𝑥𝑝[−𝐵𝑄20°𝐶(1 − 𝑆𝑜𝐶20°𝐶)] − 𝐾𝑄20°𝐶( 1 𝑆𝑜𝐶20°𝐶 − 1) (2) 𝑑𝑆𝑜𝐶 𝑑𝑡 = − 1 𝑄𝐼𝑏𝑎𝑡 (3) 𝐼𝑏𝑎𝑡= 𝐼𝑏𝑎𝑡𝑓+ 𝑅2𝐶2 𝑑𝐼𝑏𝑎𝑡𝑓 𝑑𝑡 (4)
The battery voltage Vbat is given by Eq. (1) where Ibat is the battery current (defined as positive during discharge
cycle), Ibatf is the filtered battery current calculated from Eq. (4), R1 is the internal resistance whereas R2 is the polarization
resistance. These resistances depend on the battery temperature which is estimated from the thermal model. bdch is the
discharge logic variable (binary digit), equal to 1 in discharging mode whereas in charging mode, it is equal to 0, contrarily to the charge logic variable bch. The OCV is governed by Eq. (2), where E0 is the battery constant voltage, A
7 is the exponential zone amplitude, B is the exponential zone inverse capacity, K is the polarization constant and Q20°C is
the discharge battery capacity measured at 20°C. The SoC has a prime importance in EMS; its estimation must be as accurate as possible over a wide range of temperature. According to the state of the art [41], the SoC estimation can be improved by taking into account the temperature effects on capacity derivation. Hence, Eq. (3) returns the SoC of the battery where parameter Q is the discharge capacity measured for several temperatures (from 0°C to 30°C). The parameter SoC20°C used in Eq. (1) and Eq. (2) is obtained from Eq. (3) with Q20°C. In Eq. (4), R2C2 is the current filter
time constant. In the following, this time constant will be noted Tf. The R2C2 parallel network allows taking into account
the global dynamic behavior and its influence on the battery voltage response. However, with this single RC parallel network, it is not possible to dissociate the activation dynamics (charge transfer process) and the diffusion phenomena [42,43]. Fig. 2 shows the ECM diagram resulting from Eq. (1) to Eq. (4).
Fig. 2 Equivalent model circuit (left) and OCV characteristic (right). In Fig.2, the total battery voltage drop can be expressed as:
𝑣1+ 𝑣2= 𝑅1𝐼𝑏𝑎𝑡+ 𝑅2𝐼𝑏𝑎𝑡𝑓(
𝑏𝑑𝑐ℎ
𝑆𝑜𝐶+ 𝑏𝑐ℎ
1.1 − 𝑆𝑜𝐶) (5)
In Eq. (3), the SoC reflects the residual capacity of the battery. It is calculated by using the common Coulomb counting method. Hence, the parameter SoC can be expressed as the following equation which is appropriate with a coulombic efficiency equal to 1. Indeed, for Li-ion batteries, this value is close to 1 [44]:
𝑆𝑜𝐶 = 𝑆𝑜𝐶𝑖𝑛𝑖𝑡+
∫ 𝐼𝑏𝑎𝑡𝑑𝑡
𝑄 (6)
where SoCinit is the initial state of charge of the battery. In our study, the values of the minimum and maximum SoC,
noted SoCm and SoCM are limited in order to limit the aging effect. Generally, the microgrid EMS limits the battery
8 The OCV characteristic, obtained by Eq. (2), is shown in Fig.2. An exponential potential drop appears when
SoC20°C is close to 1 (the battery is full charged). In our case study (battery emulator for HIL microgrid application),
SoCM has been fixed at 90%. Therefore, in order to limit the parameters of the model, it is possible to remove the exponential expression in Eq. (2) thus to simplify both model and parameter identification. For the rest of the study, the OCV can be formulated as:
𝑂𝐶𝑉 = 𝐸0− 𝐾𝑄20°𝐶(
1 𝑆𝑜𝐶20°𝐶
− 1) (7)
The overall parameters of the electrical model are summarized in the Table 1. Table 1
Parameters of the electrical model.
OCV Total battery voltage drop SoC E0 (V), K (V Ah-1) R1 (), R2 (), Tf (s) Q (Ah)
Electrical parameters are determined from experiments by using a nonlinear least-squares solver. The parameters E0 and K are obtained by the measurement of the OCV characteristic for a battery temperature fixed at 20°C.
R1, R2 and Tf are determined, for different temperatures, from the voltage measurement of the battery when this latter is
excited with a current profile based on the hybrid pulse power characteristic (HPPC) test. The HPPC profile was designed in order to measure the dynamic power capability over a device charge and voltage range [46]. The discharge capacity Q is measured for several battery temperatures (0°C, 10°C, 20°C and 30°C). The relationship between Q and the battery temperature is obtained by a polynomial curve fitting.
2.2 THERMAL MODEL
The goal of the thermal model is to provide an estimation of the battery temperature which is coupled with the electrical model by influencing some parameters. Like as the electrical model, the thermal model used in this study has to be adapted for time-accelerated experiments in a HIL process. It should not slow down the computation time of the real time simulator. Hence, in this study, the thermal model implemented in the real time simulator is a one-dimensional (1D) thermal model. Indeed, more complex thermal models could deteriorate the simulation time [47].
The battery used in this study is composed of 18650 cylindrical format LiFePO4/graphite Li-ion cells (3.2V –
1.6Ah). As shown in Fig. 3, eight cells are assembled, in parallel, in one compact module (3.2V – 12.8Ah) developed by TYVA ENERGY. In the module, there is an air gap between the cylindrical cells and no cooling system is used to manage the temperature in the module (no cooling plates, no fans, no phase change materials). Hence, in this study, the
9 heat dissipation in the module is assumed to be governed by a natural convection. The top and the bottom surfaces of the module are not insulated: the heat transfer between cells and the surround air can only occur through the air flow tubes located at the top and bottom of the module. The eight modules are connected in series in order to obtain the characteristics of the studied battery (25.6V – 12.8Ah). For each module, a thermocouple is attached at half height on the surface of one cell in order to measure the temperature. The battery temperature is obtained from an average of the temperature measurements for all modules.
Fig. 3 LiFePO4/graphite Li-ion cell, module and battery developed by TYVA ENERGY.
By constructing this thermal model, a series of assumptions were made:
• The temperature inside the cylindrical cell is uniform. Some studies show that the difference between the internal temperature and surface temperature of cylindrical cells can be neglected [48,49]. In [50], it was showed that the internal of a cylindrical 18650 Li-ion battery was nearly uniform for several charge and discharge rates when the cell was cooled by natural convection. Hence, the surface temperature could represent the battery temperature. For a forced convection, this assumption is not valid [51].
• The surface temperature of the cell is assumed to be uniform [52] (the lateral temperature is closed to the temperature of the positive and negative electrodes of the cell).
• There is no cell-to-cell temperature variance in each battery modules. In this study, parameters of the thermal model is obtained during experimental tests. An environmental test chamber is used to control the ambient temperature of the battery. The test volume of the test chamber is higher than the volume of the battery (1000L for the test chamber whereas 5,3L for the battery). In the test volume, there is no directional air flow to manage the temperature in each modules of the battery. Therefore, each modules have the same inlet air temperature.
• The predominant heat mode transport in the cell is the conduction (in a Li-ion battery, both convection and radiation modes inside the cell can be neglected [53]).
10 The thermal model of the cell [52] (as shown in Fig.4) is composed by several parameters : a heat source p
(W) coupled with battery losses, a specific heat capacity Cp (J K-1), an internal heat transfer resistance R
thc (K W-1) and
an external heat transfer resistance Rthv (K W-1). Tamb is the ambient temperature of the cell (being also the ambient
temperature of the battery).
Fig. 4 Simplified thermal model of the cylindrical cell (left) and 𝜕𝑂𝐶𝑉 𝜕𝑇⁄ for LiFePO4/graphite cylindrical cell [52]
(right).
The heat source in the cell is governed by the heat generated from resistive dissipation (first term on the right) and reversible entropic heat (second term on the left). It can be expressed as [52] :
Σ𝑝= [𝑣1𝐼𝑏𝑎𝑡+ 𝑣2𝐼𝑏𝑎𝑡𝑓] − 𝐼𝑏𝑎𝑡𝑇𝑠 [
∆𝑆
𝑛𝐹] (8)
The reversible entropic heat is a function of Ibat, the battery temperature Ts, the entropic change S, the number of
electrons exchanged n and F Faraday’s constant. The entropy change depends on the SoC and the electrode materials used in li-ion batteries [56]. In Eq. (8), the term ∆𝑆 𝑛𝐹⁄ can be replaced by the derivative of the OCV with respect to the temperature :
Σ𝑝= [𝑣1𝐼𝑏𝑎𝑡+ 𝑣2𝐼𝑏𝑎𝑡𝑓] − 𝐼𝑏𝑎𝑡𝑇𝑠 [
𝜕𝑂𝐶𝑉
𝜕𝑇 ] (9)
In Eq. (9), to calculate the reversible entropic heat, the knowledge of 𝜕𝑂𝐶𝑉 𝜕𝑇⁄ is necessary. Thus, as shown in Fig. 4, 𝜕𝑂𝐶𝑉 𝜕𝑇⁄ values are extracted from the literature for LiFePO4/graphite Li-ion cylindrical cell. In this study, according
to the SoC calculated with Eq. (6), a linear interpolation method is used to determine 𝜕𝑂𝐶𝑉 𝜕𝑇⁄ values from the plot presented in Fig. 4.
The cell exchanges heat with the surrounding air in the module is governed by convective and radiative heat transfer (the conductive heat transfer is neglected because most of the cell’s surface is in contact with the surrounding air). In [57], it was shown that, for a natural convection, the heat dissipation is mainly governed by the radiation heat transfer.
11 Hence, in Fig. 4, the external heat transfer resistance Rthv takes into account the convective and radiative heat transfer
[52].
The battery temperature can be calculated by: 𝑑𝑇𝑠 𝑑𝑡 = Σ𝑝𝑅𝑡ℎ𝑣 𝐶𝑝(𝑅𝑡ℎ𝑐+ 𝑅𝑡ℎ𝑣) − 𝑇𝑠 − 𝑇𝑎𝑚𝑏 𝐶𝑝(𝑅𝑡ℎ𝑐+ 𝑅𝑡ℎ𝑣) (10)
The parameters of the thermal model (Cp, Rthc and Rthv) can be extracted from experiments based on battery temperature
measurements and by using a nonlinear least-squares solver.
2.3 SCALING OF THE ELECTRO-THERMAL BATTERY MODEL
Reduce scaled experiments are usually required for HIL real time simulation in order to decrease both cost and risks. Indeed, instead of using a real battery for experiments, a physical emulator can be connected to the test bench. This battery emulator is based on a scaled model allowing to simulate the real time behavior of the battery.
The scale model is obtained by applying the dimensional analysis (well established method in fluid and thermal systems) and the Vaschy-Buckingham’s Pi theorem which is not detailed in that paper. Readers are invited to consult specific literature for more details [58]. This scaling methodology based on a dimensional analysis has been used to scale a wind energy conversion system [29].
The SI units of the variables used in the electro-thermal battery model are summarized in Table 2. Five independent fundamental dimensions are found [m], [kg], [s], [A] and [K]. For the dimensional analysis, all variables of the model can be scaled according to the number of independent variables (5 in that case). In this study, three scaling factors are used in order to reduce the power of the battery and to compress the experimental time. These scaling factors are introduced by the following equations:
• voltage scaling factor Sv: Vscaled/Voriginal, • current scaling factor Si : Iscaled/Ioriginal, • time scaling factor St : Tscaled/Toriginal.
The scale model parameters are calculated by applying the Vaschy-Buckingham theorem. Table 2 presents the scale model parameters obtained from the parameters of the original model through the scaling factors.
Table 2
Parameters of the scaling electro-thermal battery model.
Variables Symbol SI Units Scaled model parameters Voltage V (Vbat, E0) m2 Kg s-3 A-1 [Sv]·Vbat , [Sv]·E0
Current I (Ibat, Ibatf) A [Si]·Ibat , [Si]·Ibatf
12
Capacity Q A s [Si·St]·Q
Polarization constant K m2 Kg s-4 A-2 [Sv·Si
-1
·St-1]·K
Resistance R (R1, R2) m2 Kg s-3 A-2 [Sv·Si -1
]·R1 , [Sv·Si-1]·R2
Temperature T (Tamb, TS) K Tamb , TS
Thermal capacity Cp m2 Kg s-2 K-1 [Sv·Si·St]·Cp Heat transfert resistance Rth (Rthc, Rthv) m-2 Kg-1 s3 K [Sv
-1
·Si-1]·Rthc , [Sv-1·Si-1]·Rthv
In the following section, the scaling factors will be applied to the battery case with 8 cells in series with 8 branches in parallel. For instance, from the cell model parameters, the module model parameters are simply obtained by applying a current scaling factor (here Si = 8). For the battery model parameters, the current and voltage scaling factors are Sv=Si=8. The time scaling factor (St) allows compressing time by creating a “virtual compressed time” which can be used to accelerate testing for HIL real time simulation. Note that if the scaling factors are quite simple and linear for both voltage and current respectively by considering series (Sv) and parallel (Si) associations, the time scaling derivation is non trivial because charge and discharge acceleration in electrochemical process is strongly nonlinear.
3 PARAMETER EXTRACTION
The nonlinear least-squares solver of the Matlab optimization toolbox is used to identify parameters of the electro-thermal model. In this study three objective functions are be minimized:
(OCV)𝑒𝑟𝑟𝑜𝑟 = ∑((𝑂𝐶𝑉)𝑚𝑜𝑑𝑒𝑙− (𝑂𝐶𝑉)𝑚𝑒𝑎𝑠𝑢𝑟𝑒𝑑)² (11)
(V𝑏𝑎𝑡)𝑒𝑟𝑟𝑜𝑟 = ∑((V𝑏𝑎𝑡)𝑚𝑜𝑑𝑒𝑙− (V𝑏𝑎𝑡)𝑚𝑒𝑎𝑠𝑢𝑟𝑒𝑑)² (12)
(T𝑆)𝑒𝑟𝑟𝑜𝑟 = ∑((T𝑆)𝑚𝑜𝑑𝑒𝑙− (T𝑆)𝑚𝑒𝑎𝑠𝑢𝑟𝑒𝑑)² (13)
The parameter extraction process is sequential:
Step 1: the relationship between discharge capacity Q and the temperature is determined by using a curve polynomial fitting as detailed in section 3.2;
Step 2: the parameters related to the OCV (see Table 1) are obtained with the minimization of Eq. (11). This estimation process is detailed in section 3.3;
Step 3: the parameters related to the voltage drops are obtained with the minimization of Eq. (12) as detailed in section 3.4;
13 Step 4: finally, the minimization of Eq. (13) allows determining parameters Cp, Rthc and Rthv as detailed in section 3.5.
3.1 EXPERIMENTAL SETUP FOR PARAMETER EXTRACTION
The experimental setup is shown in Fig. 5. It includes a remote controllable bidirectional source of voltage/current (including a Power Source PSI 9200-210 and a Controlled Load ELR 9250-210) which allows emulating adjust charge and discharge profiles. A computer (with DSPACE supervisor) controls the bidirectional source and secures the experimental test bench. A multi-channel recorder (SEFRAM – DAS 240) is used for data acquisition and a thermal chamber (CLIMATS) allows controlling the ambient temperature of the battery.
Fig. 5 Battery test bench.
Batteries used in this study are not equipped neither with a battery management system nor a balancing circuit. Hence, for safety consideration in experiments, both voltage and temperature of the cells are measured. The upper and lower cut-off voltages are set to 3.65V and 2.5V to fulfill the safe operating area.
3.2 DISCHARGE BATTERY CAPACITY PARAMETER
The SoC estimation is based on Eq. (6). In order to take into account the thermal environment and its influence on the SoC, the discharge battery capacity Q has to be linked with the battery temperature: Q = f(Ts). Experimental tests have been carried out for several ambient temperatures (0°C, 10°C, 20°C, 30°C). The battery (rated characteristic: 25.6V – 12.8Ah) being initially fully charged is discharged at constant current (0.5C, where C is the rated capacity of the battery) until the voltage measured across a module reaches the low voltage discharge limit (2.5V). This low discharge rate allows limiting the gap between Ts and Tamb (low exothermic reactions in cells). For each test, the discharge capacity is calculated from both Ibat and discharge time tdis. Table 3 presents the experimental results.
14 Table 3
Discharge battery capacity measurements.
Ts(°C) ibat (A) tdis (h) Q (Ah)
0 6.5 1.48 9.6 10 1.58 10.3 20 1.66 10.8 30 1.67 10.9
The measured discharge capacity Q is lower than the rated capacity given by the manufacturer (i.e. 12.8Ah). This difference is caused by voltage unbalance for one module (the battery is not equipped with a balancing circuit). In the following of the paper, the discharge capacity given in Table 3 will be used for SoC estimation. From Table 3, a polynomial fitting has been made to obtain the relationship between Q and Ts. Eq. (14) presents this polynomial function, which is used to estimate the SoC indicator (Eq. 6).
𝑄 = 9.24 ∙ 10−6∙ 𝑇𝑠4− 6.15 ∙ 10−4∙ 𝑇𝑠3+ 1.15 ∙ 10−2∙ 𝑇𝑠2+ 9.62 (14)
3.3 EXTRACTION OF THE OCV PARAMETERS
The parameters E0 and K related to the Eq. (7) are obtained from the pulsed current profile presented in Fig. 6.
This current profile is applied to the Li-ion cell at the ambient temperature of 20°C regulated by the climatic chamber. According to the scale model parameters presented in Table 2, the discharge cell capacity Qcell used in this section is
calculated from battery discharge capacity : [Si]·Q (with Si = 1/8). Each pulse current allows reducing or increasing the SoC by 10% with a constant rate (0.2Ccell, where Cell is the rated capacity of the cell, i.e 1.6Ah). With this low
discharge/charge rate, the cell temperature shall not deviate from the ambient temperature. Moreover, a rest time (toff)
of one hour between each pulse is imposed to keep the cell temperature at 20°C for each start pulse and to obtain an OCV in equilibrium [59].
First of all, the cell is fully charged with a constant current constant voltage profile (CCCV) with a constant current charge at 0.2Ccell until the voltage reaches the upper limit of 3.65V; then, a constant voltage of 3.65V charge is
applied until the current is below 0.02Ccell. Then, the cell is discharged with constant current (0.2Ccell) until reaching the
desired initial SoC at 90%. The SoC being set at 90%, the current profiles is imposed at the cell to measure the OCV in discharging and charging modes. In order to simplify the model, the OCV hysteresis is not taken into account despite its importance for the SoC estimation accuracy [60]. Then, the OCV characteristic used to extract parameters is based on an average between the two measured OCV curves. This characteristic is reported in dashed line in Fig.6.
15 Fig. 6 Pulse current profile (left) and comparison of OCV obtained by measurement and simulation OCV (right).
The results of the optimization problem with the objective function of Eq. (11) are presented in Table 4. For qualifying the accuracy of the OCV model, a weighted root mean square error (RMSE) is calculated by Eq. (15). A comparison of OCV curves, between average measurements (dashed line) and model (solid line) with parameters in Table 3, is represented by the black solid line in Fig. 6. As shown in Fig. 6, there is a slight difference between the measurement and the simulation. However, in this study, an accuracy simulation on OCV is not necessary because the electrical model is not used to estimate the SoC like as in BMS applications [37]. Despite the simplicity of the OCV relationship in Eq. (7), the simulation of the OCV presents an RMSE lower than 1%.
𝑅𝑀𝑆𝐸(%) = 100 √1 𝑁∑ (𝑂𝐶𝑉𝑚𝑜𝑑𝑒𝑙(𝑗)− 𝑂𝐶𝑉𝑚𝑒𝑎𝑠𝑢𝑟𝑒𝑚𝑒𝑛𝑡(𝑗))² 𝑁 𝑗=1 𝑉𝑐𝑒𝑙𝑙𝑛𝑜𝑚(= 3.2𝑉) (15)
where N is the number of measurement samples. Table 4
Results of OCV parameters for the Li-ion cell.
E0 (V) K (V Ah-1) RMSE
3.32 0.01 0.35%
Voltage and current scaling factors will be applied on these OCV parameters in order to develop the electrical model of the module (Si = 8) and of the battery (Sv = Si = 8).
3.4 EXTRACTION OF VOLTAGE DROP PARAMETERS
The identification method for the voltage drop parameters is based on the HPPC battery curent profile which is widely used for parameter identification [38,61]. The test procedure is conducted on the Li-ion module with 10% of SoC intervals starting from 90% to 10%, each interval being followed by 30min of rest time before applying the next
16 sequence. The HPPC profile (Fig. 7) is composed with symmetrical charge and discharge pulses, which magnitudes are inside the range from 0.1C to 2C (1.28A to 25.6A).
Fig. 7 (top) HPPC battery current profiles; (middle and bottom) measured and simulated module voltages for different ambient temperatures.
In order to study the influence of the temperature on parameters R1, R2 and Tf for each HPPC profile, the module
is placed in the climatic chamber where the ambient temperature is regulated at several levels (0°C, 10°C, 20°C, 30°C). Voltage drop parameters are obtained by solving the optimization problem of Eq. (12). The simulation result and the voltage measurement is presented in Fig.7 for different ambient temperatures. The parameter values, for different ambient temperatures, and the weighted RMSE are reported in Table 5. The model is accurate (RMSE < 1%) inside the operating ranges of both battery SoC (90% to 10%) and temperature (0°C to 30°C). As it can be seen in Fig.7, the maximal error between the measurement and the simulation is located during the relaxation time. The ECM used in this paper is reduced in terms of complexity in order to face the computation time constraints during HIL real time
17 simulation. It is composed with only one RC network which is clearly not sufficient to simulate accurately the relaxation behaviour with accuracy. From parameters R2 and Tf, values of C2 are calculated and added in Table 5.
Table 5
Results of voltage drop parameters for one module.
Tamb (°C) R1 (m) R2 (m) Tf (s) C2 (F) RMSE
0°C 13.4mΩ 4.8mΩ 46s 9583.3 0.84%
10°C 10.5mΩ 2.9mΩ 47s 16 206.9 0.89%
20°C 9.1mΩ 1.3mΩ 51s 39 230.8 0.82%
30°C 7.3mΩ 0.6mΩ 36s 60 000 0.66%
In table 5, R1 and R2 resistances increase when the ambient temperature decrease which is a classical behavior
for electrochemical devices. In the model, in order to take into account the influence of the temperature on both resistances, the following equations are introduced:
𝑅1= 𝐾11𝑒(
𝐾12
𝑅𝑇𝑠) (16)
𝑅2 = K21𝑒(−𝐾22𝑇𝑠) (17)
An Arrhenius law gives the temperature dependence of resistance R1 where R is the gas constant (8.314J mol
-1). For the resistance R
2, the temperature dependence is given by an exponential curve fitting. The fitting parameters
(K11, K12, K21 and K22) of Eq. (16) and Eq. (17) are determined with a nonlinear least-squares solver and presented in
Table 6. To obtain these parameters, we have assumed that the battery temperature Ts is closed to Tamb. This assumption is not exact when the battery current is high (at the end of HPPC sequence). Nevertheless, between each HPPC sequence (during the 30 min of rest time), the battery is maintained in standby mode and Ts tends rapidly towards Tamb while the battery is placed in the climatic chamber with a forced convection mode.
Table 6
Parameters of internal resistances.
K11 (m) K12 (J mol-1) K21 () K22 (K-1)
0.26 8600 4033 0.05
In the electrical model, Tf is considered as constant and is calculated from the average of the values in Table 5
(i.e. 45s). In this paper, the electrical model is used to develop a physical battery emulator for power HIL simulation in order to test several EMS for microgrids applications. The real-time simulation of microgrids require long test time (several hours/days/weeks). Hence, a very high accuracy on dynamics response of the battery model is not necessary.
18
3.5 EXTRACTION OF THERMAL MODEL PARAMETERS
The thermal model is based on cylindrical cells. The parameters Cp, Rthc and Rthv are obtained with the same
method as for the previous parameter extraction. The data measurements used in the optimization problem presented in Eq. (13) are related to Ts. The battery temperature has been measured during the HPPC test detailed in the section 3.4. The simulated battery temperature is calculated by Eq. (10). The parameters of the thermal model are shown in Table 7 for different ambient temperatures. The simulated and measured battery temperature for different ambient temperatures are presented in Fig. 8. It can be seen from Fig. 8 that the thermal model represents the battery temperature fairly accurately in despite of several assumptions were made to build the 1D thermal model.
Fig. 8 Measured and simulated battery temperatures.
Table 7
Parameters of the thermal model.
Tamb(°C) Cp (J K-1) R thc (K W-1) Rthv (K W-1) 0 27 22.6 57.9 10 26 23.3 54.4 20 27 21.3 56.7 30 28 23.5 68.0
Parameters used for
the thermal model 27 22.6 59.2
In Table 7, the parameters are almost independent with Tamb. Thus, the parameters used in the thermal model are considered as independent with the temperature. They are calculated from the average of the four values in Table 7.
Previous studies have estimated the same parameters to develop a thermal model of Li-ion cylindrical cell with other experimental methods. In [54], for 18650 format LiFePO4/graphite Li-ion cell, the specific heat capacity value is
around 36J K-1. In [45], the ratio R
thc/Rthv is closed to 0.36 for cylindrical LiFePO4/graphite Li-ion cell. From the
19 In the following section, from the parameters calculated in previous sections, a robustness analysis of the electro-thermal model is carried out.
4 ROBUSTNESS ANALYSIS AND TIME SCALING
4.1 ROBUSTNESS ANALYSIS OF THE ELECTRO-THERMAL MODEL
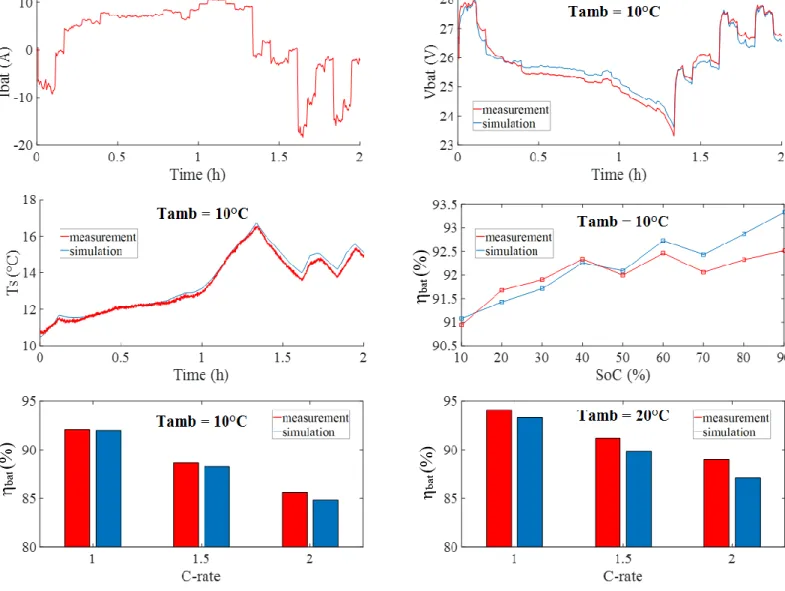
In order to assess the robustness of the model with its identification process, a validation profile dissimilar to the ones previously used for parameter extraction was used to ensure that the electro-thermal battery model works well in realistic operation. The battery current profile (Fig. 9) is based on a typical microgrid application with a specific EMS: this microgid involved wind turbine based power sources coupled with a battery bank in order to face a day ahead power commitment [62]. The battery current magnitude obtained from this application is adapted for the tested Li-ion battery physically tested in the test bench presented in section 3.1. A comparison between the battery voltage measurement and the voltage of the battery model is proposed in this section. This comparison is also conducted for the battery temperature. Initially, the SoC is set to 80% and the battery was placed in the thermal chamber with a regulated temperature. The analysis was conducted with different ambient temperatures from 10°C to 30°C.
The Parameters R1, R2 and Tf are obtained from the Li-ion module while parameters E0 and K are obtained from
the Li-ion cell. Hence, to obtain parameters of the scale electro-thermal battery model, voltage and current scaling factors have to be applied as mentioned in Table 2.
A comparison between the simulation and the measurements at 10°C is shown in Fig. 9. The measurement and simulation of battery voltage and battery temperature are quite similar. The performance of the electro-thermal model was tested for several ambient temperatures (10°, 20°C and 30°C). Table 8 presents the weighted RMSE of the battery voltage and temperature. The weighted RMSE of the battery temperature was calculated by the ratio between the RMSE value and the ambient temperature. These results validate the performance of the electro-thermal model for large SoC variations with different ambient temperatures and for a battery current profile different against the HPPC profile used for parameter identification of the electro-thermal model.
Table 8
Parameters of scale electro-thermal battery model.
Tamb (°C) RMSE (Vbat) RMSE (Ts) RMSE (bat)
10 0.9% 2.8% 0.4%
20 0.6% 1.5% 1%
20 Fig. 9 (top) Battery current profile (left) and the battery voltage (right); (middle) the battery temperature (left) and the energy efficiency of the battery (right); (bottom) energy efficiencies of the battery.
It is also possible to analyze the accuracy of the electro-thermal model from the calculation of the battery energy efficiency. The battery energy efficiency is defined as the ratio of the discharged (dch) energy to the charged (ch) energy. The efficiency can be expressed as:
𝜂𝑏𝑎𝑡=
∫(𝑉𝑏𝑎𝑡∙𝐼𝑏𝑎𝑡)𝑑𝑐ℎ 𝑑𝑡
∫(𝑉𝑏𝑎𝑡∙𝐼𝑏𝑎𝑡)𝑐ℎ 𝑑𝑡 (18)
To measure this efficiency, the battery is discharged and charged at a constant current in order to restore the initial SoC. In this study, the energy efficiency is obtained from the HPPC profile presented in Fig. 7. Indeed, it is composed of several sequences each one being defined by symmetrical charge and discharge pulses. Hence, the energy efficiency can be obtained according to the magnitude of current (during a sequence) and the evolution of SoC (for each sequence). Fig. 9 (middle – right) present the energy efficiency of the battery measured and simulated from the electro-thermal
21 model for 10°C and for a discharge/charge current amplitude equals to 1C. For both the model and the battery, the efficiency decreases with the SoC. Fig. 9 (bottom) show energy efficiencies as a function of current rates. In these figures, the energy efficiencies decrease significantly with increasing current rates. This phenomenon has been shown and described in [63] for LiFePO4/graphite Li-ion batteries. In Table 8, the RMSE of bat is given for several
temperatures.
Based on the presented results on table 8 and Fig.9, the model used allows obtaining a good accuracy for the battery voltage, temperature and energy efficiency. The model presented in this section is convenient in terms of complexity to be implemented in a real time simulator in order to develop a physical battery emulator which allows to accelerate power HIL tests for microgrids applications. Nevertheless, in order to accelerate the physical emulation of the battery and therefore to reduce the development cost and testing efforts, the time scaling is an original concept to reduce the testing time. In order to accelerate the testing time with a real battery, the magnitude of the current profile would have to be increased. However, the internal voltage drop generated by the increased magnitude of the current would cause a capacity reduction and a possible thermal abuse in the battery. So the time scaling is not possible for an actual battery or with a physical emulator based on a real battery (see the “copy of image” concept of emulator in [11]). Thus, the time scaling can only be done with a scalable battery model as presented in the next section.
4.2 TIME ACCELERATED WITH THE SCALE ELECTRO-THERMAL BATTERY MODEL.
The current profile used in the previous section is based on microgrid application and its duration time is equal to 2 hours. For instance, to reduce the test time by 60 (i.e, 2 hours at real time equals to 2 minutes in “virtual compressed time”), a time axis compression (by 60) is applied on the current profile. For the simulation, this current profile is applied to the scale electro-thermal model in which all parameters have to be scaled with a time scaling factor equal to 1/60. The results of the scaled electro-thermal battery model (at 10°C) with St=1/60 are shown in Fig.10. The simulated response of the battery scale model is very close to the experimental measurements for which the total “real time” is 2h. Hence, with the scale electro-thermal model presented in this paper, it is possible to reduce testing times for HIL simulation if other real time constraints are fulfilled (see [29] to detail these constraints). Indeed, some limits can appear on St values linked the bandwidth of the power supply or of the control loops of power electronic converters which can limit the performance of the accelerated tests.
22 Fig. 10 Measured and simulated battery voltage (left) and battery temperature (right).
The scale electro-thermal model presented in this paper has been used to develop a Li-ion battery emulator for HIL simulation experiments [64]. This battery emulator has been hybridized, through DC/DC power converters, with a wind turbine emulator for a microgrid application. Experimental results presented in [64] have shown, for 2 thermal conditions (0°C and 20°C), that the emulator battery voltage are perfectly in accordance even if the time is accelerated by St=1/10 and St=1/60. Hence, the duration time of experimental tests were able to be reduced at 4min (instead of 4h for the original test profile).
CONCLUSION
The main contribution of this paper was related to the development of a scale electro-thermal Li-ion battery model used to develop a battery physical emulator which allows reducing the HIL experimental time through the utilization of a time scaling factor. This model enables rapid testing several EMS for microgrids applications. Based on 18650 cylindrical format LiFePO4/graphite Li-ion cells, this scale model allows reproducing electrical (voltage, energy
efficiency) and thermal behaviour of the battery for different current profiles and several environmental temperatures. Parameters of the scale model were obtained from several experimental tests through a sequential identification process. In order to evaluate the accuracy of the model, a robustness analysis was presented based on a current profile clearly dissimilar to the profiles used for parameter estimation and related to a typical application on a microgrid topology. Finally, a good accuracy was obtained between simulated and experimental results despite of simplifying assumptions.
ACKNOWLEDGEMENTS
23
REFERENCE
[1] Global EV Outlook 2017, 2017. https://doi.org/10.1787/9789264278882-en.
[2] M. Rashed, J.M. Le Peuvedic, S. Bozhko, Conceptual design of battery energy storage for aircraft hybrid propulsion system, in: 2016 Int. Conf. Electr. Syst. Aircraft, Railw. Sh. Propuls. Road Veh. Int. Transp. Electrif. Conf. ESARS-ITEC 2016, 2017. https://doi.org/10.1109/ESARS-ITEC.2016.7841396.
[3] R.R. Mariani, F. Lacressonniere, G. Fontes, X. Roboam, Design of a medium voltage power converter-storage devices embedded in a hybrid emergency network for more electrical aircraft, Math. Comput. Simul. 91 (2013). https://doi.org/10.1016/j.matcom.2012.07.009.
[4] E. Reihani, S. Sepasi, L.R. Roose, M. Matsuura, Energy management at the distribution grid using a Battery Energy Storage System (BESS), Int. J. Electr. Power Energy Syst. (2016).
https://doi.org/10.1016/j.ijepes.2015.11.035.
[5] J. Leadbetter, L. Swan, Battery storage system for residential electricity peak demand shaving, Energy Build. (2012). https://doi.org/10.1016/j.enbuild.2012.09.035.
[6] M. Koller, T. Borsche, A. Ulbig, G. Andersson, Review of grid applications with the Zurich 1 MW battery energy storage system, Electr. Power Syst. Res. (2015). https://doi.org/10.1016/j.epsr.2014.06.023.
[7] H. Branco, R. Castro, A. Setas Lopes, Battery energy storage systems as a way to integrate renewable energy in small isolated power systems, Energy Sustain. Dev. (2018). https://doi.org/10.1016/j.esd.2018.01.003. [8] H. Alharbi, K. Bhattacharya, Optimal sizing of battery energy storage systems for microgrids, in: Proc. - 2014
Electr. Power Energy Conf. EPEC 2014, 2014. https://doi.org/10.1109/EPEC.2014.44.
[9] A. Oudalov, D. Chartouni, C. Ohler, Optimizing a battery energy storage system for primary frequency control, IEEE Trans. Power Syst. (2007). https://doi.org/10.1109/TPWRS.2007.901459.
[10] D. Kucevic, B. Tepe, S. Englberger, A. Parlikar, M. Mühlbauer, O. Bohlen, A. Jossen, H. Hesse, Standard battery energy storage system profiles: Analysis of various applications for stationary energy storage systems using a holistic simulation framework, J. Energy Storage. (2020). https://doi.org/10.1016/j.est.2019.101077. [11] J. Khazaei, L. Piyasinghe, V.R. Disfani, Z. Miao, L. Fan, G. Gurlaskie, Real-time simulation and
hardware-in-the-loop tests of a battery system, in: IEEE Power Energy Soc. Gen. Meet., 2015. https://doi.org/10.1109/PESGM.2015.7285993.
[12] L. Yi, H. He, J. Peng, Hardware-in-loop simulation for the energy management system development of a plug-in hybrid electric bus, plug-in: Energy Procedia, 2016. https://doi.org/10.1016/j.egypro.2016.06.118.
24 [13] A. Taksale, V. Vaidya, P. Shahane, G. Dronamraju, V. Deulkar, Low cost hardware-in-loop for automotive
application, in: 2015 Int. Conf. Ind. Instrum. Control. ICIC 2015, 2015. https://doi.org/10.1109/IIC.2015.7150913.
[14] H. Dai, X. Zhang, X. Wei, Z. Sun, J. Wang, F. Hu, Cell-BMS validation with a hardware-in-the-loop simulation of lithium-ion battery cells for electric vehicles, Int. J. Electr. Power Energy Syst. (2013). https://doi.org/10.1016/j.ijepes.2013.03.037.
[15] J.V. Barreras, C. Fleischer, A.E. Christensen, M. Swierczynski, E. Schaltz, S.J. Andreasen, D.U. Sauer, An Advanced HIL Simulation Battery Model for Battery Management System Testing, IEEE Trans. Ind. Appl. (2016). https://doi.org/10.1109/TIA.2016.2585539.
[16] H. Dai, X. Wei, Z. Sun, J. Wang, A hardware-in-the-loop system for development of automotive battery management system, Lect. Notes Electr. Eng. (2012). https://doi.org/10.1007/978-1-4614-2185-6_4. [17] H. Haupt, M. Plöger, J. Bracker, Hardware-in-the-loop test of battery management systems, in: IFAC Proc.
Vol., 2013. https://doi.org/10.3182/20130904-4-JP-2042.00042.
[18] M. Wang, L. Xu, K. Wang, Z. Zheng, Y. Li, C. Grada, H. Zhang, Hardware-in-the-loop real-time platform for more electric aircraft, J. Eng. (2018). https://doi.org/10.1049/joe.2018.0017.
[19] A. Kaden, B. Boche, R. Luckner, Hardware-in-the-Loop Flight Simulator – An Essential Part in the Development Process for the Automatic Flight Control System of a Utility Aircraft, in: Adv. Aerosp. Guid. Navig. Control, 2013. https://doi.org/10.1007/978-3-642-38253-6_34.
[20] A.S. Vijay, S. Doolla, M.C. Chandorkar, Real-Time Testing Approaches for Microgrids, IEEE J. Emerg. Sel. Top. Power Electron. (2017). https://doi.org/10.1109/JESTPE.2017.2695486.
[21] Y.V.P. Kumar, R. Bhimasingu, Alternative hardware-in-the-loop (HIL) setups for real-time simulation and testing of microgrids, in: 1st IEEE Int. Conf. Power Electron. Intell. Control Energy Syst. ICPEICES 2016, 2017. https://doi.org/10.1109/ICPEICES.2016.7853522.
[22] F. Baccino, A. Brissette, D. Ishchenko, A. Kondabathini, P. Serra, Real-time hardware-in-the-loop modeling for microgrid applications, in: 2017 6th Int. Conf. Clean Electr. Power Renew. Energy Resour. Impact, ICCEP 2017, 2017. https://doi.org/10.1109/ICCEP.2017.8004807.
[23] R.M. Moore, K.H. Hauer, G. Randolf, M. Virji, Fuel cell hardware-in-loop, J. Power Sources. (2006). https://doi.org/10.1016/j.jpowsour.2006.06.066.
25 Battery evaluation in a systems context, in: 2014 IEEE Transp. Electrif. Conf. Expo Components, Syst. Power Electron. - From Technol. to Bus. Public Policy, ITEC 2014, 2014. https://doi.org/10.1109/itec.2014.6861865. [25] Y. He, W. Liu, B.J. Koch, Battery algorithm verification and development using hardware-in-the-loop testing,
J. Power Sources. (2010). https://doi.org/10.1016/j.jpowsour.2009.11.036.
[26] R.S. Razavian, N.L. Azad, J. McPhee, A battery hardware-in-the-loop setup for concurrent design and evaluation of real-time optimal HEV power management controllers, Int. J. Electr. Hybrid Veh. (2013). https://doi.org/10.1504/IJEHV.2013.057604.
[27] C. Seitl, J. Kathan, G. Lauss, F. Lehfuss, Power hardware-in-The-loop implementation and verification of a real time capable battery model, in: IEEE Int. Symp. Ind. Electron., 2014.
https://doi.org/10.1109/ISIE.2014.6864974.
[28] J.M. Cabello, X. Roboam, S. Junco, E. Bru, F. Lacressonniere, Scaling Electrochemical Battery Models for Time-Accelerated and Size-Scaled Experiments on Test-Benches, IEEE Trans. Power Syst. 32 (2017) 4233– 4240. https://doi.org/10.1109/TPWRS.2017.2683398.
[29] A. Varais, X. Roboam, F. Lacressonnière, C. Turpin, J.M. Cabello, E. Bru, J. Pulido, Scaling of wind energy conversion system for time-accelerated and size-scaled experiments, Math. Comput. Simul. 158 (2019) 65–78. https://doi.org/10.1016/j.matcom.2018.05.015.
[30] S. Castano, L. Gauchia, E. Voncila, J. Sanz, Dynamical modeling procedure of a Li-ion battery pack suitable for real-time applications, Energy Convers. Manag. (2015). https://doi.org/10.1016/j.enconman.2014.12.076. [31] O. Tremblay, L.A. Dessaint, A.I. Dekkiche, A generic battery model for the dynamic simulation of hybrid
electric vehicles, in: VPPC 2007 - Proc. 2007 IEEE Veh. Power Propuls. Conf., 2007. https://doi.org/10.1109/VPPC.2007.4544139.
[32] J.M. Cabello, E. Bru, X. Roboam, F. Lacressonniere, S. Junco, Battery dynamic model improvement with parameters estimation and experimental validation, in: 8th Int. Conf. Integr. Model. Anal. Appl. Control Autom. IMAACA 2015, 2015: pp. 63–70.
[33] M.B. Camara, H. Gualous, F. Gustin, A. Berthon, Design and new control of DC/DC converters to share energy between supercapacitors and batteries in hybrid vehicles, IEEE Trans. Veh. Technol. (2008). https://doi.org/10.1109/TVT.2008.915491.
[34] L. Boulon, D. Hissel, A. Bouscayrol, M.C. Péra, P. Delarue, Multi physics modelling and representation of power and energy sources for Hybrid Electric Vehicles, in: 2008 IEEE Veh. Power Propuls. Conf. VPPC 2008,
26 2008. https://doi.org/10.1109/VPPC.2008.4677665.
[35] S. Njoya Motapon, L.A. Dessaint, K. Al-Haddad, A comparative study of energy management schemes for a fuel-cell hybrid emergency power system of more-electric aircraft, IEEE Trans. Ind. Electron. (2014). https://doi.org/10.1109/TIE.2013.2257152.
[36] M.A. Roscher, O. Bohlen, J. Vetter, OCV Hysteresis in Li-Ion Batteries including Two-Phase Transition Materials, Int. J. Electrochem. (2011). https://doi.org/10.4061/2011/984320.
[37] M.A. Roscher, D.U. Sauer, Dynamic electric behavior and open-circuit-voltage modeling of LiFePO 4-based lithium ion secondary batteries, J. Power Sources. (2011). https://doi.org/10.1016/j.jpowsour.2010.06.098. [38] M.K. Tran, A. Mevawala, S. Panchal, K. Raahemifar, M. Fowler, R. Fraser, Effect of integrating the hysteresis
component to the equivalent circuit model of Lithium-ion battery for dynamic and non-dynamic applications, J. Energy Storage. (2020). https://doi.org/10.1016/j.est.2020.101785.
[39] H. He, R. Xiong, H. Guo, Online estimation of model parameters and state-of-charge of LiFePO4 batteries in electric vehicles, Appl. Energy. (2012). https://doi.org/10.1016/j.apenergy.2011.08.005.
[40] E. Redondo-Iglesias, P. Venet, S. Pelissier, Global model for self-discharge and capacity fade in lithium-ion batteries based on the generalized eyring relationship, IEEE Trans. Veh. Technol. (2018).
https://doi.org/10.1109/TVT.2017.2751218.
[41] C. Zhang, K. Li, J. Deng, S. Song, Improved Realtime State-of-Charge Estimation of LiFePO4 Battery Based on a Novel Thermoelectric Model, IEEE Trans. Ind. Electron. (2017).
https://doi.org/10.1109/TIE.2016.2610398.
[42] E. Kuhn, C. Forgez, P. Lagonotte, G. Friedrich, Modelling Ni-mH battery using Cauer and Foster structures, J. Power Sources. (2006). https://doi.org/10.1016/j.jpowsour.2005.10.018.
[43] K.V. Singh, H.O. Bansal, D. Singh, Hardware-in-the-loop Implementation of ANFIS based Adaptive SoC Estimation of Lithium-ion Battery for Hybrid Vehicle Applications, J. Energy Storage. (2020).
https://doi.org/10.1016/j.est.2019.101124.
[44] M.H. Chang, H.P. Huang, S.W. Chang, A new state of charge estimation method for LiFePO4 battery packs used in robots, Energies. (2013). https://doi.org/10.3390/en6042007.
[45] Z. Zhang, J. Wang, X. Wang, An improved charging/discharging strategy of lithium batteries considering depreciation cost in day-ahead microgrid scheduling, Energy Convers. Manag. (2015).
27 [46] J. Shim, K.A. Striebel, Characterization of high-power lithium-ion cells during constant current cycling: Part I.
Cycle performance and electrochemical diagnostics, J. Power Sources. (2003). https://doi.org/10.1016/S0378-7753(03)00351-3.
[47] P. Gambhire, N. Ganesan, S. Basu, K.S. Hariharan, S.M. Kolake, T. Song, D. Oh, T. Yeo, S. Doo, A reduced order electrochemical thermal model for lithium ion cells, J. Power Sources. (2015).
https://doi.org/10.1016/j.jpowsour.2015.04.179.
[48] T. Yuksel, S. Litster, V. Viswanathan, J.J. Michalek, Plug-in hybrid electric vehicle LiFePO4 battery life implications of thermal management, driving conditions, and regional climate, J. Power Sources. (2017). https://doi.org/10.1016/j.jpowsour.2016.10.104.
[49] D.H. Jeon, S.M. Baek, Thermal modeling of cylindrical lithium ion battery during discharge cycle, Energy Convers. Manag. (2011). https://doi.org/10.1016/j.enconman.2011.04.013.
[50] K. Onda, T. Ohshima, M. Nakayama, K. Fukuda, T. Araki, Thermal behavior of small lithium-ion battery during rapid charge and discharge cycles, J. Power Sources. (2006).
https://doi.org/10.1016/j.jpowsour.2005.08.049.
[51] S. Ma, M. Jiang, P. Tao, C. Song, J. Wu, J. Wang, T. Deng, W. Shang, Temperature effect and thermal impact in lithium-ion batteries: A review, Prog. Nat. Sci. Mater. Int. (2018).
https://doi.org/10.1016/j.pnsc.2018.11.002.
[52] C. Forgez, D. Vinh Do, G. Friedrich, M. Morcrette, C. Delacourt, Thermal modeling of a cylindrical LiFePO4/graphite lithium-ion battery, J. Power Sources. (2010).
https://doi.org/10.1016/j.jpowsour.2009.10.105.
[53] S.C. Chen, C.C. Wan, Y.Y. Wang, Thermal analysis of lithium-ion batteries, J. Power Sources. (2005). https://doi.org/10.1016/j.jpowsour.2004.05.064.
[54] L.H. Saw, K. Somasundaram, Y. Ye, A.A.O. Tay, Electro-thermal analysis of Lithium Iron Phosphate battery for electric vehicles, J. Power Sources. (2014). https://doi.org/10.1016/j.jpowsour.2013.10.052.
[55] G. Vertiz, M. Oyarbide, H. Macicior, O. Miguel, I. Cantero, P. Fernandez De Arroiabe, I. Ulacia, Thermal characterization of large size lithium-ion pouch cell based on 1d electro-thermal model, J. Power Sources. (2014). https://doi.org/10.1016/j.jpowsour.2014.08.092.
[56] V. V. Viswanathan, D. Choi, D. Wang, W. Xu, S. Towne, R.E. Williford, J.G. Zhang, J. Liu, Z. Yang, Effect of entropy change of lithium intercalation in cathodes and anodes on Li-ion battery thermal management, J.
28 Power Sources. (2010). https://doi.org/10.1016/j.jpowsour.2009.11.103.
[57] M. Shadman Rad, D.L. Danilov, M. Baghalha, M. Kazemeini, P.H.L. Notten, Adaptive thermal modeling of Li-ion batteries, Electrochim. Acta. (2013). https://doi.org/10.1016/j.electacta.2013.03.167.
[58] B. Zohuri, Shock Wave and High-Pressure Phenomena, in: Dimens. Anal. Beyond Pi Theorem, Springer International Publishing, Cham, 2017: pp. 129–193. https://doi.org/10.1007/978-3-319-45726-0_3. [59] F. Baronti, R. Saletti, W. Zamboni, Open circuit voltage of lithium-ion batteries for energy storage in DC
microgrids, in: 2015 IEEE 1st Int. Conf. Direct Curr. Microgrids, ICDCM 2015, 2015. https://doi.org/10.1109/ICDCM.2015.7152066.
[60] A. Marongiu, N. Nlandi, Y. Rong, D.U. Sauer, On-board capacity estimation of lithium iron phosphate batteries by means of half-cell curves, J. Power Sources. (2016).
https://doi.org/10.1016/j.jpowsour.2016.05.041.
[61] K.S. Hariharan, V.S. Kumar, A nonlinear equivalent circuit model for lithium ion cells, J. Power Sources. (2013). https://doi.org/10.1016/j.jpowsour.2012.08.090.
[62] D. Hernández-Torres, C. Turpin, X. Roboam, B. Sareni, Techno-economical optimization of wind power production including lithium and/or hydrogen sizing in the context of the day ahead market in island grids, Math. Comput. Simul. (2019). https://doi.org/10.1016/j.matcom.2018.07.010.
[63] J. Kang, F. Yan, P. Zhang, C. Du, Comparison of comprehensive properties of Ni-MH (nickel-metal hydride) and Li-ion (lithium-ion) batteries in terms of energy efficiency, Energy. (2014).
https://doi.org/10.1016/j.energy.2014.04.038.
[64] A. Varais, X. Roboam, F. Lacressonniere, E. Bru, N. Roux, Reduced scale PHIL emulation concepts applied to power conversion systems with battery storage, IEEE Trans. Ind. Electron. (2020) 1–1.