Application of Battery Energy Storage in the
Québec Interconnection
Thèse
Ali Moeini
Doctorat en génie électrique
Philosophiae doctor (Ph.D.)
Québec, Canada
Application of Battery Energy Storage in the
Québec Interconnection
Thèse
Ali Moeini
Sous la direction de:
Hoang Le-Huy, directeur de recherche
Innocent Kamwa, codirecteur de recherche
iii
Résumé
Le Système Stockage de l'Énergie par Batterie ou Batterie de Stockage d’Énergie (BSE) offre de formidables atouts dans les domaines de la production, du transport, de la distribution et de la consommation d’énergie électrique. Cette technologie est notamment considérée par plusieurs opérateurs à travers le monde entier, comme un nouveau dispositif permettant d'injecter d’importantes quantités d’énergie renouvelable d’une part et d’autre part, en tant que composante essentielle aux grands réseaux électriques. De plus, d’énormes avantages peuvent être associés au déploiement de la technologie du BSE aussi bien dans les réseaux intelligents que pour la réduction de l’émission des gaz à effet de serre, la réduction des pertes marginales, l’alimentation de certains consommateurs en source d’énergie d’urgence, l’amélioration de la gestion de l’énergie, et l’accroissement de l’efficacité énergétique dans les réseaux.
Cette présente thèse comprend trois étapes à savoir : l’Étape 1 - est relative à l’utilisation de la BSE en guise de réduction des pertes électriques ; l’Étape 2 - utilise la BSE comme élément de réserve tournante en vue de l’atténuation de la vulnérabilité du réseau ; et l’Étape 3 - introduit une nouvelle méthode d’amélioration des oscillations de fréquence par modulation de la puissance réactive, et l’utilisation de la BSE pour satisfaire la réserve primaire de fréquence.
La première Étape, relative à l'utilisation de la BSE en vue de la réduction des pertes, est elle-même subdivisée en deux sous-étapes dont la première est consacrée à l’allocation optimale et le seconde, à l’utilisation optimale. Dans la première sous-étape, l’Algorithme génétique NSGA-II (Non-dominated Sorting Genetic Algorithm II) a été programmé dans CASIR, le Super-Ordinateur de l’IREQ, en tant qu’algorithme évolutionniste multi-objectifs, permettant d’extraire un ensemble de solutions pour un dimensionnement optimal et un emplacement adéquat des multiple unités de BSE, tout en minimisant les pertes de puissance, et en considérant en même temps la capacité totale des puissances des unités de BSE installées comme des fonctions objectives. La première sous-étape donne une réponse satisfaisante à l’allocation et résout aussi la question de la programmation/scheduling dans l’interconnexion du Québec.
iv
Dans le but de réaliser l’objectif de la seconde sous-étape, un certain nombre de solutions ont été retenues et développées/implantées durant un intervalle de temps d’une année, tout en tenant compte des paramètres (heure, capacité, rendement/efficacité, facteur de puissance) associés aux cycles de charge et de décharge de la BSE, alors que la réduction des pertes marginales et l’efficacité énergétique constituent les principaux objectifs.
Quant à la seconde Étape, un nouvel indice de vulnérabilité a été introduit, formalisé et étudié ; indice qui est bien adapté aux réseaux modernes équipés de BES. L’algorithme génétique NSGA-II est de nouveau exécuté (ré-exécuté) alors que la minimisation de l’indice de vulnérabilité proposé et l’efficacité énergétique représentent les principaux objectifs. Les résultats obtenus prouvent que l’utilisation de la BSE peut, dans certains cas, éviter des pannes majeures du réseau.
La troisième Étape expose un nouveau concept d’ajout d’une inertie virtuelle aux réseaux électriques, par le procédé de modulation de la puissance réactive. Il a ensuite été présenté l’utilisation de la BSE en guise de réserve primaire de fréquence. Un modèle générique de BSE, associé à l’interconnexion du Québec, a enfin été proposé dans un environnement MATLAB. Les résultats de simulations confirment la possibilité de l’utilisation des puissances active et réactive du système de la BSE en vue de la régulation de fréquence.
v
Abstract
The Battery Energy Storage (BES) offers significant potential benefits at generation, transmission, distribution, and consumption levels of power systems. More specifically, this technology is considered by various operators around the globe, as a component of incorporating high amounts of renewable energy and as a key tool for large-scale power networks. In addition, other highly valued benefits can be captured by deploying BES technologies in smart grid such as facilitating power management, reducing green house gas emissions, reducing marginal losses, providing emergency power source for some users, and increasing energy efficiency in networks.
This thesis comprises three phases: phase 1) application of BES for loss reduction, phase 2) application of BES as spinning reserve for vulnerability mitigation, phase 3) introducing a new method for improving frequency oscillation using reactive power modulation and application of BES for primary frequency reserve. The phase 1, application of BES for loss reduction is divided itself in two steps: step one: optimal allocation and step two: optimal utilization. In step one, Non-dominated Sorting Genetic Algorithm II (NSGA-II) has been coded on Centre de CAlcul Scientifique de l'IREQ (CASIR), the supercomputer of IREQ, as multi-objective evolutionary algorithm that extracts a set of optimal solution for optimal sizing and siting of multiple BESs while minimization of power losses and the total installed capacity of the BES units are simultaneous objective functions. For the sake of step two, a number of solutions are chosen and developed over one year taking into account the hour/rate/efficiency/power factor of the charge and discharge modes while marginal loss reduction or energy efficiency improvement are set as main goals. Phase 1 provides a complete answer for BES allocation and scheduling problem on Québec interconnection. Concerning the phase 2, a new vulnerability index has been introduced, formulated and studied which is suitable for modern power systems that comprise BESs. The NSGA-II is re-executed while minimization of proposed vulnerability index and total installed capacity are main goals. The results reveal that application of BES may prevent major blackouts in some cases. The phase 3 presents a novel idea for adding virtual inertia to power systems using reactive power modulations. The phase 3 also presents a primary study on application
vi
of BESs for primary frequency reserve. Generic battery model is introduced to simple Quebec interconnection model in MATLAB. Simulation results confirm the applicability of both active and reactive powers of BES architecture for frequency regulation.
vii
Table of Contents
RÉSUMÉ ... III ABSTRACT ... V TABLE OF CONTENTS ... VII LIST OF TABLES ... XII LIST OF FIGURES ... XV ACKNOWLEDGEMENTS ... XXVI FOREWORD ... XXVII PROBLEM STATEMENT ... XXXIII
OBJECTIVES OF THIS WORK ...XXXIV
ORIGINAL CONTRIBUTIONS ... XXXV
LIST OF PUBLICATIONS ...XXXVI
CHAPTER 1
INTRODUCTION ... 1
1.1 INTEGRATING BATTERY ENERGY STORAGE INTO THE ELECTRICITY VALUE CHAIN ... 1
1.2 STUDIED TECHNOLOGIES ... 4
1.2.1 Battery Energy Storages ... 4
1.2.1.1 Sodium-Sulfur Batteries ... 5
1.2.1.2 Nickel Electrode Batteries ... 5
1.2.1.3 Lead–Acid Batteries ... 5
1.2.1.3.1 Flooded Lead-Acid Batteries... 6
1.2.1.3.2 Valve Regulated Lead-Acid (VRLA) Batteries ... 6
1.2.1.4 Zinc-Bromine Batteries ... 7
1.2.1.5 Lithium-ion Batteries ... 7
1.2.1.6 Lithium iron Phosphate (LiFePO4) Battery ... 7
1.2.2 Other Technologies ... 7
viii
1.2.2.2 Compressed Air Energy Storage (CAES) ... 8
1.2.2.3 Pumped Storage Hydroelectric (PSH) ... 8
1.3 TECHNOLOGY STATUS: ... 9
1.4 ECONOMIC ASPECT OF BATTERY EENERGY STORAGE TECHNOLOGY ... 14
1.4.1 Grid Battery System (GBS) ... 14
1.4.2 Power Conversion System (PCS) ... 14
1.4.3 Balance Of Plant (BOP) ... 15
CHAPTER 2 MULTI-OBJECTIVE OPTIMIZATION: BACKGROUND ... 19
2.1 INTRODUCTION ... 19
2.2 GENERAL CONCEPTS OF MULTI-OBJECTIVE OPTIMIZATION ... 20
2.3 MULTI-OBJECTIVE OPTIMIZATION TOOLS ... 23
2.3.1 General Concepts of EA ... 25 2.3.1.1 Search space ... 25 2.3.1.2 Individuals ... 25 2.3.1.3 Population ... 25 2.3.1.4 Initialization ... 25 2.3.1.5 Fitness function ... 26 2.3.1.6 Coding ... 26 2.3.1.7 Selection ... 27 2.3.1.8 Crossover ... 28 2.3.1.9 Mutation... 29 2.3.1.10 Elitism ... 29 2.3.1.11 Fitness assignment ... 29
2.3.2 Speed-constraint Multi-objective Particle Swarm Optimization (SMPSO) ... 31
2.3.3 Non-dominated Sorting Genetic Algorithm II (NSGA-II) ... 34
2.3.4 Multi-objective Genetic Algorithm (MOGA) ... 35
2.4 CENTRE DE CALCUL SCIENTIFIQUE DE L'IREQ(CASIR) ... 36
2.5 SUMMARY ... 37
ix
FIRST STEP: ALLOCATION OF BATTERY STORAGE UNITS USING
EVOLUTIONARY ALGORITHMS ... 39
3.1 ALLOCATION OF BATTERY ENERGY STORAGE FOR POWER LOSS REDUCTION PURPOSE ... 39
3.1.1 Static model for battery energy storage ... 40
3.1.1.1 Constant active power (power model) ... 40
3.1.1.2 Constant active and reactive power (power model) ... 41
3.1.1.3 Uniform periodic state of charge (energy model) ... 41
3.1.1.4 Non-uniform state of charge (energy model) ... 42
3.1.1.5 Applied BES model for optimization ... 44
3.1.2 Objective functions ... 45
3.1.3 Individual coding ... 45
3.1.4 Studied cases ... 46
3.1.4.1 IEEE reliability test system 1996 ... 46
3.1.4.2 Québec interconnection ... 47
3.1.5 Proposed method ... 51
3.1.6 Optimal allocation, results and discussion ... 53
3.1.6.1 RTS96 ... 53
3.1.6.2 Québec Interconnection ... 71
3.1.6.2.1 Optimal Allocation using 230 KV buses ... 77
3.1.6.2.2 Optimal Allocation using 120 KV buses ... 84
3.2 SUMMARY ... 95
CHAPTER 4 SECOND STEP: OPTIMAL SCHEDULING BATTERY ENERGY STORAGES FOR LOSS REDUCTION ... 97
4.1 INTRODUCTION ... 97
4.2 UTILIZATION OF BESS FOR MARGINAL LOSS REDUCTION ... 99
4.2.1 Determination of charge hours and rates ... 99
4.2.2 Determination of discharge hours and rates ... 101
4.2.3 Re-dispatching generating units ... 103
x
4.2.3.2 Under-generation ( P h d w, , 0) ... 105
4.2.4 BES Reactive Power Participation ... 106
4.3 UTILIZATION OF BESS FOR ENERGY EFFICIENCY IMPROVEMENT ... 107
4.3.1 Phase 1: Calculating Sensitivity of Power Loss to BES ( SPLBES ) ... 109
4.3.2 Phase 2: Energy volume assignment to SPLBES ... 109
4.4 STUDY RESULTS AND DISCUSSION: ... 110
4.4.1 IEEE Reliability Test System 1996 (RTS96) ... 110
4.4.1.1.1 Energy Efficiency Improvement ... 126
4.4.1.2 Québec Interconnection ... 130
4.4.1.2.1 Reducing Daily Marginal Losses ... 131
4.4.1.2.2 Energy Efficiency Improvement ... 145
4.5 SUMMARY ... 149
CHAPTER 5 APPLICATION OF BATTERY ENERGY STORAGE FOR NETWORK VULNERABILITY MITIGATION ... 150
5.1 INTRODUCTION ... 150
5.2 DEFINITION OF VULNERABILITY INDICES ... 152
5.2.1 Line Outage Index ( LOI) ... 153
5.2.2 Generator Outage Index ( GOI) ... 157
5.2.3 Network Vulnerability Index (NVI) ... 159
5.3 PROBLEM FORMULATION ... 160
5.4 RESULTS AND DISCUSSIONS ... 162
5.5 PARETO FRONT VALIDATION ... 164
5.6 SUMMARY ... 165
CHAPTER 6 PRIMARY FREQUENCY CONTROL USING REACTIVE POWER SOURCES AND BATTERY ENERGY STORAGE ... 167
6.1 INTRODUCTION ... 171
xi
6.2.1 System Modeling Summary (Kundur, 1994) ... 177
6.2.2 Sensitivity Analysis ... 182
6.3 STUDIED TEST SYSTEMS AND VALIDATION ... 184
6.3.1 Four-machine Two-area System (Kundur) ... 184
6.3.2 New England 10-Machine 39-Bus (NE39bus) ... 185
6.3.3 Australian 14-generators (AU14gen) ... 186
6.3.4 IEEE Reliability Test System 1996 (RTS96) ... 189
6.3.5 Validity of Linearized Model ... 190
6.4 PROPOSED CONTROLLER ... 190
6.5 SMALL SIGNAL ANALYSIS ... 193
6.5.1 NE39bus test system ... 193
6.5.1.1 Modal Analysis ... 193
6.5.1.2 MBPSS and Proposed Controller Impact Assessment ... 194
6.5.2 Kundur test system ... 197
6.6 TIME DOMAIN ANALYSIS ... 199
6.7 MODEL VALIDATION AND RESULTS DISCUSSION ... 211
6.8 FREQUENCY REGULATION USING GENERIC BATTERY MODEL ... 213
6.8.1 Frequency regulation and Battery storage (Kundur test system) ... 218
6.8.2 Frequency regulation and Battery storage (Québec interconnection model) 223 6.9 SUMMARY ... 229
CHAPTER 7 THESIS CONCLUSION AND RECOMMENDATIONS FOR FUTURE WORK ... 231
7.1 THESIS CONCLUSION ... 231
7.2 RECOMMENDATIONS FOR FUTURE WORK ... 235
REFERENCES ... 236
xii
List of Tables
Table 2-1: An example of binary encoding. ... 27
Table 2-2: An example of value encoding. ... 27
Table 2-3: An example of single point crossover. ... 28
Table 2-4: An example of two point crossover. ... 28
Table 2-5: An example of uniform random crossover. ... 28
Table 3-1: Individual coding for applied optimization methods and corresponding real values (pre-specified sizes in RTS96 system) ... 54
Table 3-2: Individual coding for applied optimization methods and corresponding real values (pre-specified places in RTS96 system) ... 55
Table 3-3: The coded values of optimal Pareto front given by SMPSO for RTS96 [3 BES] ... 56
Table 3-4: The real values of optimal Pareto front given by SMPSO for RTS96 [3 BES] ... 57
Table 3-5: The optimal Pareto front given by SMPSO for RTS96 [6BES] ... 58
Table 3-6: The optimal Pareto front given by SMPSO for RTS96 [9 BES] ... 60
Table 3-7: PLR of Pareto front given by SMPSO for RTS96 [ 3BES, 100% loading] .. 62
Table 3-8: PLR of Pareto front given by SMPSO for RTS96 [ 6BES, 100% loading] .. 63
Table 3-9: PLR of Pareto front given by SMPSO for RTS96 [ 9BES, 100% loading] .. 64
Table 3-10: PLR of Pareto front given by SMPSO for RTS96 [ 3BES, 130% loading] .. 66
Table 3-11: PLR of Pareto front given by SMPSO (RTS96) [ 3BES, 160% loading] ... 67
Table 3-12: Generation units with AGC system (Québec interconnection). ... 74
Table 3-13: Individual coding for applied optimization method and corresponding real values (pre-specified sizes in Québec interconnection) ... 75
xiii
Table 3-14: Name, power loss, and ( )i of all cases. ... 76
Table 3-15: Nominated buses for BES installation (230 KV buses) ... 78
Table 3-16: Optimal Pareto front of NSGA-II in coded form [3BES] (230 KV buses) ... 79
Table 3-17: Optimal Pareto front of NSGA-II for Québec interconnection [3BES] (230 KV buses) ... 80
Table 3-18: Results of optimal Pareto front for Québec interconnection [3BES] (230 KV buses) ... 81
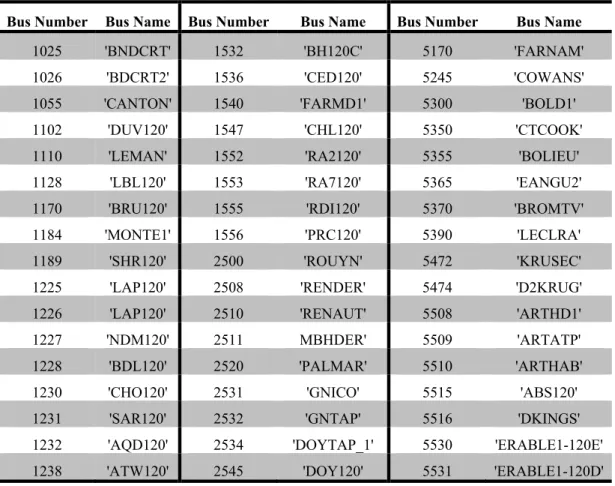
Table 3-19: Nominated buses for BES installation (120 KV buses) ... 85
Table 3-20: Optimal Pareto front of NSGA-II for Québec interconnection [3BES] (120 KV buses) ... 88
Table 3-21: Results of optimal Pareto front for Québec interconnection [3BES] [120 KV buses] ... 89
Table 3-22: Optimal Pareto front of NSGA-II for Québec interconnection [6BES] (120 KV buses) ... 94
Table 4-1: Summary of results under different loading values and power factors ... 125
Table 4-2: Power Loss Reduction with different studied scenarios ... 142
Table 5-1: NLOI (%) with/without 3 BES Units (300 MW) ... 163
Table 5-2: Studied scenarios for validity of 300 MW BES optimal allocation ... 164
Table. 6-1: Comparison of Small Signal Analysis Results [Kundur] ... 189
Table. 6-2: Input/Output Signals for NE39bus ... 193
Table. 6-3: Configuration of Each Studied Case [NE39bus] ... 196
Table. 6-4: Input/Output Signals for Kundur ... 197
Table. 6-5: Input/Output Signals for Kundur ... 198
xiv
Table. 6-7: Frequency Response Characteristic Against the Total Size of Controllable
Loads for ~1.6% Load Increment (Zhao et al., 2014) ... 210
Table. 6-8: Frequency Response Characteristic Under Different Amount of Controllable
Sizes of SC & DL for ~1.9% Load-Shedding [NE39bus] ... 210
xv
List of Figures
Fig. 1-1: Variety of operational uses throughout the electric value chain (Irwin et al.,
2012) ... 4
Fig. 1-2: Operational pumped hydro storage around the world (DOE Global Energy
Storage Database) Jan 2016 ... 9
Fig. 1-3: Operational energy storage projects (DOE Global Energy Storage Database)
Jan 2016 ... 10
Fig. 1-4: Under construction energy storage projects (DOE Global Energy Storage
Database) ... 10
Fig. 1-5: Announced or contracted energy storage projects (DOE Global Energy Storage
Database, Jan 2016) Jan 2016 ... 11
Fig. 1-6: 10 countries by installed capacity (DOE Global Energy Storage Database) Jan
2016 ... 11
Fig. 1-7: Top applications for energy storages (DOE Global Energy Storage Database)
Jan 2016 ... 12
Fig. 1-8: The status of energy storage in Canada (DOE Global Energy Storage
Database) Jan 2016 ... 12
Fig. 1-9: Battery energy storage projects in the world (DOE Global Energy Storage
Database) Jan 2016 ... 13
Fig. 1-10: Most interested applications of battery energy storages (DOE Global Energy
Storage Database) ... 13
Fig. 1-11: NPV of different battery energy storage technologies (Irena, 2015) ... 16
Fig. 1-12: Global forecast of battery energy storage capacity for utility-scale applications
(Irena, 2015) ... 16
Fig. 1-13: Lowest current and projected battery cell price by type for utility-scale
xvi
Fig. 1-14: Estimated installed battery capacity and commissions (MW) in the power
sector by type (Irena, 2015) ... 17
Fig. 1-15: Development cost for recent li-ion battery technology (Irena, 2015) ... 18
Fig. 1-16: Development cost for recent li-ion battery technology [BNEF: Bloomberg New Energy Finance; EIA: U.S Energy Information Administration] (Irena, 2015) ... 18
Fig. 2-1: An example for non-dominated and dominated solutions of a MOP problem . 22 Fig. 2-2: Comparison of 256 points (a) a pseudorandom number source (top) the 2, 3 sobol sequence (red=1,.., 10, blue=11,..,100, green=101,.., 256) ... 26
Fig. 2-3: Crowding distance calculation (Deb et al., 2000) ... 31
Fig. 2-4: NSGA-II procedure (Deb et al. 2000) ... 35
Fig. 2-5: The CASIR supercomputer at IREQ. ... 37
Fig. 3-1: Possible solution within search space (allocation 3 BESs in RTS96) ... 40
Fig. 3-2: An example of uniform periodic state of charge ... 42
Fig. 3-3: An example of uniform periodic state of charge from different energy sources ... 43
Fig. 3-4: An example of non-uniform charge and discharge of BES (NGK Insulators, Ltd 2013) ... 44
Fig. 3-5: Integer coding of any feasible solution ... 46
Fig. 3-6: Simple schematic of RTS96 ... 47
Fig. 3-7: Hydro-Québec’s power grid (Hydro-Québec review, 2014) ... 48
Fig. 3-8: Means of electricity generation (Hydro-Québec review, 2014) ... 49
Fig. 3-9: Hydroelectric projects ‒ 2005-2020 (Hydro-Québec review, 2014) ... 50
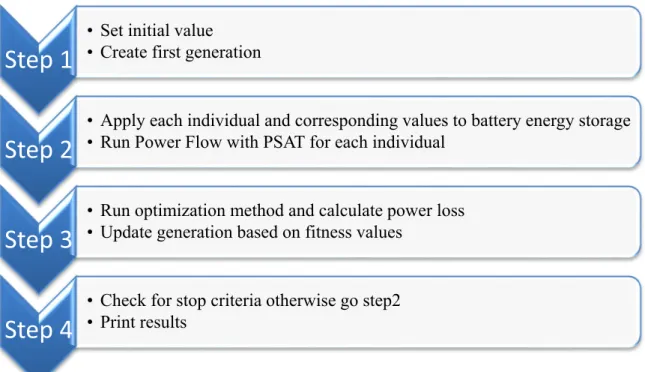
Fig. 3-10: Simple flowchart for optimal allocation of battery energy storages in power system for loss reduction purposes ... 51
xvii
Fig. 3-12: Optimal Pareto front of SMPSO for RTS96 [3BES] ... 56
Fig. 3-13: Optimal Pareto front of SMPSO for RTS96 [6BES] ... 58
Fig. 3-14: Optimal Pareto front of SMPSO for RTS96 [6BES] ... 60
Fig. 3-15: Optimal Pareto front of SMPSO (RTS) [3BES, 130% loading]. ... 65
Fig. 3-16: Optimal Pareto front of SMPSO [3BES, 160% loading]. ... 67
Fig. 3-17: Power loss reduction for optimal Pareto front sets under different loading parameters ... 68
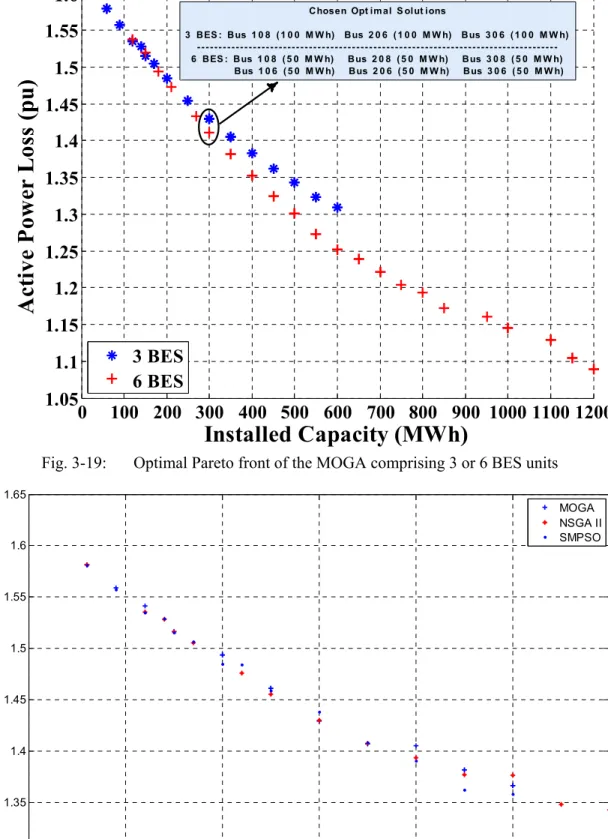
Fig. 3-18: Optimal Pareto front of the MOGA (50 generation, 100 individual), Sbase=100 MVA (Note: Active power loss in normal operation for peak hour is equal to 1.71 pu) ... 69
Fig. 3-19: Optimal Pareto front of the MOGA comprising 3 or 6 BES units ... 70
Fig. 3-20: Optimal Pareto front of MOGA, NSGA II, and SMPSO [3BES]. ... 70
Fig. 3-21: Optimal Pareto front of NSGA-II for Québec interconnection [3BES] (230 KV buses) ... 79
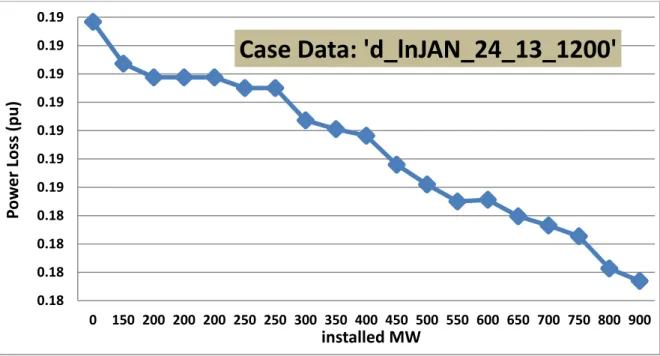
Fig. 3-22: Optimal allocation of different BES sizes on case data: 'd_lnJAN_24_13_1200' ... 83
Fig. 3-23: Optimal allocation of different BES sizes on case data: 'd_lnDEC_17_13_0800' ... 84
Fig. 3-24: Optimal Pareto using different number of individuals for Québec interconnection [3BES] (230 KV buses) ... 85
Fig. 3-25: Optimal Pareto front of NSGA II for Québec interconnection [3BES] (120 KV buses) ... 87
Fig. 3-26: Comparison of Pareto fronts [3BES] (120 KV buses VS 230 KV buses) ... 91
Fig. 3-27: Comparison of optimal allocation of Different BES sizes case data: 'd_lnJAN_24_13_1200 [3BES] (Blue: 120 KV VS Red: 230 KV)'' ... 91
Fig. 3-28: Comparison of optimal allocation of Different BES sizes case data: 'd_lnDEC_17_13_0800 [3BES] (Blue: 120 KV VS Red: 230 KV)' ... 92
xviii
Fig. 3-29: Optimal Pareto front of NSGA II for Québec interconnection [3BES] (230 KV
buses) ... 93
Fig. 3-30: Comparison of optimal allocation of Different BES sizes case data: 'd_lnJAN_24_13_1200 [Red: 3BES VS Blue: 6BES] (120 KV)' ... 95
Fig. 3-31: Comparison of optimal allocation of Different BES sizes case data: 'd_lnDEC_17_13_0800 [Red: 3BES VS Blue: 6BES] (120 KV)' ... 95
Fig. 4-1: Determination of non-uniform charge rates and hours. ... 100
Fig. 4-2: Determination of non-uniform discharge rates and hours. ... 102
Fig. 4-3: Power loss calculation for each incremental step of BES size ... 108
Fig. 4-4: Simple schematic for marginal loss reduction strategy ... 111
Fig. 4-5: Ch/Dch rates and SOC for each BES (Week=51, Day=2) [RTS96] ... 112
Fig. 4-6: The lp for peak day (Week=51, Day=2) with/without BESs ... 112
Fig. 4-7: Maximum loss reduction at peak hour, day by day over a year. ... 113
Fig. 4-8: Maximum loss reduction during each day of a year in percent. ... 114
Fig. 4-9: Peak shaving results for the peak day over the year. ... 114
Fig. 4-10: Total loss reduction for each day during a year (MWh) [RTS96] ... 115
Fig. 4-11: Discharge rate for each day [RTS96]. ... 116
Fig. 4-12: Charging rate for each day [RTS96]. ... 116
Fig. 4-13: Load profile for 1st week (Monday and Sunday) and 20th week (Monday and Sunday) [RTS96] ... 117
Fig. 4-14: Maximum loss reduction at peak hour, day by day over a year. ... 118
Fig. 4-15: Maximum loss reduction during each day of a year in percent. ... 118
Fig. 4-16: Peak shaving results for the peak day over the year. ... 119
xix
Fig. 4-18: Maximum loss reduction at peak hours, day by day with six BES unity power
... 120
Fig. 4-19: Total loss reduction for each day during a year (MWh) [6BES, RTS96] ... 121
Fig. 4-20: Peak shaving results of four studied cases for the peak day (51st week, 2nd day)
... 122
Fig. 4-21: Charge/Discharge power factors of the peak day with three and Six BESs ... 123
Fig. 4-22: Power loss reduction (MWh) over each week of year with/without PF
consideration [Three BESs] ... 123
Fig. 4-23: Power loss reduction (MWh) over each week of year with/without PF
consideration [Six BESs] ... 124
Fig. 4-24: Saved energy (in MWh) day by day and over a year [3BES, RTS96]. ... 127
Fig. 4-25: Saved energy (in percent) day by day and over a year [3BES, RTS96]. ... 127
Fig. 4-26: Energy-saving results for the peak day of the year (Week=51, Day=2) [3BES,
RTS96] ... 128
Fig. 4-27: Ch/Dch rates; SOC%(a): SOC of BESs charged a little from the day before;
SOC%(b): SOC of BESs over a day (Week=51, Day=2) ... 128
Fig. 4-28: Charging rate of BESs for each day of week ... 129
Fig. 4-29: BES discharging rate for each day of the week ... 130
Fig. 4-30: Maximum loss reduction for each day of 2013 [3BES, 230 KV, Québec
interconnection] ... 131
Fig. 4-31: Normalized maximum loss reduction for each day of 2013 [3BES, 230 KV,
Québec interconnection] ... 132
Fig. 4-32: Power loss during the peak day of 2013 with/without battery energy storage
[3BES, 230 KV, Québec interconnection] ... 133
Fig. 4-33: Load percent during the peak day of 2013 with/without battery energy storage.
xx
Fig. 4-34: Charge/discharge rates for each hour of the peak day [3BES, 230 KV,
Québec interconnection] ... 134
Fig. 4-35: Load percent with/without battery energy storage, 24th Dec 2013 [3BES, 230
KV, Québec interconnection] ... 135
Fig. 4-36: Load percent with/without battery energy storage, 14th Oct 2013 [3BES, 230
KV, Québec interconnection] ... 135
Fig. 4-37: Power loss with/without battery energy storage, 24th Dec 2013 [3BES, 230
KV, Québec interconnection] ... 136
Fig. 4-38: Power loss with/without BES, 14th Oct 2013 [3BES, 230 KV, Québec
interconnection] ... 137
Fig. 4-39: Charge/discharge rates 24th Dec 2013 [3BES, 230 KV, Québec
interconnection] ... 138
Fig. 4-40: Charge/discharge rates 14th Oct 2013 [3BES, 230 KV, Québec interconnection]
... 138
Fig. 4-41: Maximum loss reduction for each day of 2013 [3BES, 120 KV, Québec
interconnection] ... 139
Fig. 4-42: Normalized maximum loss reduction for each day of 2013 [3BES, 120 KV,
Québec interconnection] ... 139
Fig. 4-43: Power loss during the peak day of 2013 with/without battery energy storage
[3BES, 230 KV, Québec interconnection] ... 140
Fig. 4-44: Power loss with/without battery energy storage, 24th Dec 2013 [3BES, 120
KV, Québec interconnection] ... 140
Fig. 4-45: Power loss with/without battery energy storage, 14th Oct 2013 [3BES, 120 KV,
Québec interconnection] ... 141
Fig. 4-46: Maximum loss reduction for each day of 2013 [6BES, 120 KV, Québec
xxi
Fig. 4-47: Normalized maximum loss reduction for each day of 2013 [6BES, 120 KV,
Québec interconnection] ... 143
Fig. 4-48: Power loss during the peak day of 2013 with/without battery storage [6BES,
120 KV, Québec interconnection] ... 143
Fig. 4-49: Power loss with/without battery energy storage, 24th Dec 2013 [6BES, 120
KV, Québec interconnection] ... 144
Fig. 4-50: Power loss with/without battery energy storage, 14th Oct 2013 [6BES, 120 KV,
Québec interconnection] ... 144
Fig. 4-51: Additional loss reduction (pu); Blue curve: comparing 3BES allocation using
120 KV buses against 3BES allocation using 230 KV buses; Black curve: comparing 6BES allocation using 120 KV buses against 3BES allocation using 230 KV buses ... 145
Fig. 4-52: Saved energy (pu) during each day of year [3BES, 230 KV, Québec
interconnection] ... 146
Fig. 4-53: Saved energy (percent) during each day of year [3BES, 230 KV, Québec
interconnection] ... 146
Fig. 4-54: Saved energy (MWh) during each day of year [3BES, 230 KV, Québec
interconnection] ... 147
Fig. 4-55: Power loss during the peak day of 2013 with/without BES, energy efficiency
improvement strategy, [3BES, 230 KV, Québec interconnection] ... 148
Fig. 4-56: Maximum loss reduction for each day of 2013, energy efficiency improvement
strategy [3BES, 230 KV, Québec interconnection] ... 148 Fig. 5-1 Graphical example for the characteristics of LOIBusb k, . ... 154
Fig. 5-2 Graphical example for the characteristics of ,
P
g k Gen
LOI . ... 156
Fig. 5-3 Simple block diagram of handling problem with NSGA II. ... 161
xxii
Fig. 5-5 Optimal Pareto front for allocation of 3, 6, and 9 BES units. ... 164
Fig. 5-6 The P-V curve, voltage of bus 324 ... 165
Fig. 6-1 NERC frequency response nomenclature. ... 172
Fig. 6-2 Sample frequency responses recorded in an actual interconnection with AGC
(bottom): loss of 830 MW with 7350 MW pre-contingency demand; (top): loss of 725 MW with 6800 MW pre-contingency demand. ... 173
Fig. 6-3 Operation areas of governors, PSSs, and proposed controller. ... 174
Fig. 6-4 Multifunctional MBPSS consisting of a standard MBPSS with an additional
band for Wide-Area Power System Stabilizer (WAPSS) signal. ... 175
Fig. 6-5 Open-Circuit Curve (OCC) with saturation effects. ... 178
Fig. 6-6 Simplified model for d-axis and q-axis. ... 179
Fig. 6-7 Simple network model for deriving the voltage-speed coupling factor. ... 179
Fig. 6-8 Simple model for Exciter. ... 182
Fig. 6-9 C3 versus P and Q. ... 183
Fig. 6-10 C3 versus XE. ... 185
Fig. 6-11 Four-machine Two-area Kundur’s Test System. ... 186
Fig. 6-12 Schematic of New England 10-Machine 39-Bus. ... 186
Fig. 6-13 Simplified Australian 14-generator with DL and SC. ... 187
Fig. 6-14 RTS96 test system with studied DL and SC. ... 188
Fig. 6-15 Block diagram of proposed controller. ... 191
Fig. 6-16 Frequency responses of MBPSS dedicated to damping of very low frequency
oscillations from 0.005 to 0.06Hz. ... 192
Fig. 6-17 Selected modes from small signal analysis [NE39bus]. ... 194
xxiii
Fig. 6-19 Rotor speed mode shapes for the low frequency common mode (0.077 Hz)
[NE39Bus]. ... 195
Fig. 6-20 Simple Schematic of Closed- Loop system [NE39bus]. ... 196
Fig. 6-21 Low frequency common mode with studied case [NE39bus]. ... 197
Fig. 6-22 Small signal analysis results for Kundur test system ... 198
Fig. 6-23 Low frequency mode with studied configurations [Kundur]. ... 199
Fig. 6-24 Grid frequency response (20% load reduction) [kundur]. ... 200
Fig. 6-25 Grid frequency response (generator trip) [kundur]. ... 201
Fig. 6-26 Terminal voltage of G4 (load variation) [kundur]. ... 201
Fig. 6-27 Terminal voltage of G4 (loss of generation) [kundur]. ... 202
Fig. 6-28 Speed oscillation of G4 (loss of generation) [kundur]. ... 202
Fig. 6-29 Grid frequency response (20% load reduction) [NE39bus]. ... 203
Fig. 6-30 Speed oscillation of G3 (load variation), Gain (DL)= 0.0061 Hz; Gain (SC)=
0.0118 Hz [NE39bus]. ... 203
Fig. 6-31 Grid frequency response (generator trip) [NE39bus]. ... 204
Fig. 6-32 Terminal voltage of G9 (generator trip) [NE39bus]. ... 204
Fig. 6-33 Grid frequency response (20% load reduction) [AU14gen]. ... 205
Fig. 6-34 Speed oscillation of LPS_3 (load variation) [AU14gen]. ... 205
Fig. 6-35 Grid frequency response (generator trip) [AU14gen]. ... 206
Fig. 6-36 Terminal voltage of MPS_2 (load variation) [AU14gen]. ... 206
Fig. 6-37 Grid frequency response (20% load reduction) [RTS96]. ... 207
Fig. 6-38 Grid frequency response (generator trip) [RTS96]. ... 207
Fig. 6-39 Terminal voltage of TPS_4 (generator trip) [AU14gen]. ... 208
Fig. 6-40 Terminal voltage of TPS_4 (load variation) [AU14gen]. ... 208
xxiv
Fig. 6-42 Grid frequency response (phase-to-ground fault) [NE39bus]. ... 211
Fig. 6-43 Controllability of SC rotor speed (two-area four-machine) [Linearized by Pulse
Response Based System Identification and MATLAB Linearization Tool]. 212
Fig. 6-44 for G1 (20% load reduction) [Kundur] (Linearized by MATLAB
Linearization Tool). ... 212
Fig. 6-45 for G1 (20% load reduction) [Kundur] (Linearized by Pulse Response
Based System Identification). ... 213
Fig. 6-46 Generic battery model of SPS ... 214
Fig. 6-47 SPS model for Québec interconnection ... 215
Fig. 6-48 Representation of the load of Montreal in Québec interconnection SPS model
... 215
Fig. 6-49 North-West part of Québec interconnection in SPS model ... 216
Fig. 6-50 Representation of 1% droop (relation between frequency and charge/discharge
rates) ... 217
Fig. 6-51 Frequency oscillation using battery for loss of load scenario [Kundur test
system] ... 219
Fig. 6-52 The SOC of battery for loss of load scenario [Kundur test system] ... 220
Fig. 6-53 Battery voltage for loss of load scenario [Kundur test system] ... 220
Fig. 6-54 Battery current for loss of load scenario [Kundur test system] ... 221
Fig. 6-55 Frequency oscillation using battery for loss of generation scenario [Kundur test
system] ... 221
Fig. 6-56 The SOC of battery for loss of generation scenario [Kundur test system] ... 222
Fig. 6-57 Battery voltage for loss of generation scenario [Kundur test system] ... 222
Fig. 6-58 Battery current for loss of generation scenario [Kundur test system] ... 223
Fig. 6-59 Frequency oscillation using battery, loss of load scenario [Québec
xxv
Fig. 6-60 Current of battery, loss of load scenario [Québec Interconnection model] .... 225
Fig. 6-61 Voltage of battery, loss of load scenario [Québec Interconnection model] .... 225
Fig. 6-62 SOC of battery, loss of load scenario [Québec Interconnection model] ... 226
Fig. 6-63 Frequency oscillation using battery, loss of generation scenario [Québec
Interconnection model] ... 226
Fig. 6-64 Current of battery, loss of generation scenario [Québec Interconnection model]
... 227
Fig. 6-65 Voltage of battery, loss of generation scenario [Québec Interconnection model]
... 227
Fig. 6-66 SOC of battery, loss of generation scenario [Québec Interconnection model]
... 228
Fig. 6-67 Active power of BES, loss of generation scenario [Québec Interconnection
model] ... 228
Fig. 6-68 Reactive power of BES, loss of generation scenario [Québec Interconnection
xxvi
Acknowledgements
I would like to express my deepest appreciation to my Professor Innocent Kamwa for his excellent supervision and priceless guidance during all stages of my work. I never imagined him as my professor, but my second father. I would like to thank him for his endless supports, encouragements, and understanding during these years. Working with him was a great honor and experience for me, and I hope it continues for several years.
I would also like to thank my advisor Hoang Le-Huy for his professional guidance and insightful advice during my Ph.D. study.
I am also very thankful to my great colleagues at IREQ, Patrice Brunelle, Gilbert Sybille, Annissa Heniche, Laurent Lenoir, and specially Martin de Montigny. Working with them is a big oppurtunity in my professional life.
A special thanks to my family and my wife. Words cannot express how grateful I am. Your supports have been invaluable, and I owe you forever.
xxvii
Foreword
This thesis consists of 7 chapters. The first chapter provides a general introduction to energy storages, characteristics, applications, advantages and disadvantages. In Chapter 2, the necessary fundamental arguments to understand and apply multi-objective optimization tools are presented. Chapters 3 to 6 are extended versions of published, submitted or to be submitted articles in international scientific journals and conferences. Finally, chapter 7 contains thesis conclusions and recommendations for future works.
Chapter 2:
This chapter presents the fundamental arguments that are necessary to understand and apply the multi-objective techniques. At First, general concepts of multi-objective optimization comprising several definitions have been given. Then, multi-objective optimization tools have been reviewed, a brief overview is given for different types of optimization tools. At next step, evolutionary algorithms and corresponding fundamentals have been brought along with basic definitions. Finally, three well-known multi-objective optimization tools, which have been used in this thesis, are presented. This section concludes with some information on so-called CASIR, the supercomputer of IREQ which we used to execute the optimization tools.
Chapter 3:
In this chapter, we generally discuss about application of evolutionary algorithms for allocation problem. The static models of battery energy storages, which are suitable for optimization studies, are introduced. The first step of our problem, optimal allocation of battery energy storages, has been studied. Then, general structure of proposed optimization method for power system loss reduction using BESs is presented. The proposed methodology is applied on two power systems: the so-called IEEE Reliability Test System 1996 (RTS96) and the Québec interconnection. Concerning each case, simulation results are presented supporting figures and tables and some discussions.
xxviii
Regarding optimal allocation using RTS96, a part of results has been published in bellow papers:
Moeini, A., Kamwa, I. and de Montigny, M. (2015), Optimal Multi-Objective Allocation and Scheduling of Multiple-Battery Energy Storage for Energy Efficiency Improvement. The Climate Change Technology Conference (CCTC), Paper Number: 1570095445 (Presented in Montreal, CA)
Moeini, A., Kamwa, I. and de Montigny, M. (2015), Optimal multi-objective allocation and scheduling of multiple battery energy storages for reducing daily marginal losses. IEEE Power & Energy Society Innovative Smart Grid
Technologies Conference (ISGT), pp.1-5. (Presented in Washington, USA)
Moeini, A., Kamwa, I. and de Montigny, M. (2015), Power Factor-based Scheduling of distributed Battery Energy Storage Units optimally allocated in Bulk Power Systems for mitigating Marginal Losses. IET Generation, Transmission, and
Distribution, accepted.
In this chapter, we:
reviewed suitable models for the optimal allocation step reviewed IEEE Reliability Test System 1996 (RTS96) reviewed the structure of Québec interconnection
presented the structure of optimization problem, formulation and relevant topics wrote the necessary MATLAB codes
developed optimazation tool on CASIR at IREQ, speeding up the calculation studied optimal allocation using 230 KV buses and 120 KV buses
studied optimal allocation using 3 BES units or 6 BES units compared the results supporting several figures and tables Wrote 3 articles in collaboration with researchers at IREQ Chapter 4:
In chapter 4, the second step of our problem, optimal utilization of battery energy storages, has been studied. Two objective functions, marginal loss reduction and increasing energy efficiency, have been considered as main goals. Following last chapter, a number of optimal allocations are selected and further studies are conducted formulating and generating a chain of charging and discharging actions while taking into account power loss
xxix
reduction as main target. By doing so, we have a complete answer for optimal allocation and optimal utilization of battery energy storages in power system. Similarly, the RTS96 benchmark and the Québec interconnection are studied power systems.
Regarding optimal utilization on RTS96, a part of results has been published in below papers:
Moeini, A., Kamwa, I. and de Montigny, M. (2015), Optimal Multi-Objective Allocation and Scheduling of Multiple-Battery Energy Storage for Energy Efficiency Improvement. The Climate Change Technology Conference (CCTC), Paper Number: 1570095445 (Presented in Montreal, CA)
Moeini, A., Kamwa, I. and de Montigny, M. (2015), Optimal multi-objective allocation and scheduling of multiple battery energy storages for reducing daily marginal losses. IEEE Power & Energy Society Innovative Smart Grid
Technologies Conference (ISGT), pp.1-5. (Presented in Washington, USA)
Moeini, A., Kamwa, I. and de Montigny, M. (2015), Power Factor-based Scheduling of distributed Battery Energy Storage Units optimally allocated in Bulk Power Systems for mitigating Marginal Losses. IET Generation, Transmission, and
Distribution, accepted.
In this chapter, we:
proposed a method for marginal loss reduction
proposed also a method for energy efficiency improvement extended the proposed algorithm including optimal power factor wrote the necessary MATLAB codes
analyzed and discussed the results on RTS96
studied the proposed methods on Québec interconnection Wrote 3 articles in collaboration with researchers at IREQ compared the results supporting several figures and tables Chapter 5:
This chapter consists of two fundamental parts. The first part discusses about the proposed novel vulnerability index. The index gives more precise information about how vulnerable is an element following a contingency. Simulated contingencies are transmission line
xxx
outages and generator outages while vulnerability assessment is performed for all generating units, transmission lines, and buses. The power system parameters are calculated for both base case and post contingency case. Fro generating units, active and reactive powers, limits, and post contingency operation point distance from those limits are taken into account. For any buses, voltage limits and distances from those limits are used while apparent powers and limits, at the transmission level, are set as targeted points. The second part describes application of Non-dominated Sorting Genetic Algorithm II (NSGA-II) to optimally allocate the BESs and to provide a flexible set of solution for vulnerability mitigation objective function.
A major part of this chapter will be published in:
Moeini, A., Kamwa, I., de Montigny, M. and Lenoir, L. (2016), Application of Battery Energy Storage for Network Vulnerability Mitigation. IEEE/PES
Transmission and Distribution Conference and Exposition (T&D), Accepted.
In this chapter, we:
introduced a new index for vulnerability assessment including the role of battery energy storages
described step-by-step how to compute the proposed index
developed a code in MATLAB using CASIR to speed up the calculations
optimized the multi-objective problem of allocation while vulnerability mitigation is set as a goal
analyzed and discussed the results of vulnerability assessment
It should be noted that the results of this chapter were extracted taking RTS96 benchmark as studied system.
Chapter 6:
Chapter six comprises dynamic simulation on frequency regulation issue. This chapter introduces a novel idea for adding virtual inertia in power systems by controlling the frequency swing dynamics through voltage channel. The purposed idea is to develop a frequency-based supplementary VAR modulation to assist governor action during power imbalance events. In this aim, we propose a two-band power system stabilizer, tuned for
xxxi
very low-frequency common swing mode, to adaptively adjust reference voltage of a Synchronous Condenser (SC) and modulate its reactive power on a second-by-second basis. The feasibility of this idea is supported by theoretical and simulation evidences. From theoretical side, we formulate a computational procedure to measure the degree of control impact, accompanied by sensitivity analyses around varying operating points. On the simulation side, we perform extensive studies on four well-known IEEE multi-machine test systems. The results show that VAR modulation by SC has a considerable impact on the minimum post-contingency frequency (frequency nadir), even more than so-called load modulation methods in some cases, which in fact has not been given enough attention in the past. In addition, we show that the proposed method can aid governors to improve primary frequency response particularly in low inertia power systems by reducing post-event frequency settling time and bias.
This chapter is mostly published or will be published in:
Moeini, A. and Kamwa, I. (2015), Analytical Concepts for Reactive Power Based Primary Frequency Control in Power Systems. IEEE Trans. Power Syst. (accepted)
Moeini, A., Kamwa, I. and Le-Huy, H. (2015), Reactive Power Control for Improving Primary Frequency Response in Power Systems. North American Power Symposium, pp. 1-6. (presented at Charlotte, USA)
The proposed idea can be implemented using power conversion system of battery energy storage. However, due to the complexity, software issues and time-constraint, we have performed instead a simple study on simplified Hydro-Québec model in SimPowerSystem tool (SPS) using 1% droop for battery model. The 1% droop for control systems has been approved before by authorities at Hydro-Québec on the so-called “charge intelligent” project. We have been suggested to start our work using this value in order to convince business units.
At the end of this section, generic battery model at SPS environment, introduced and modeled by IREQ researchers, has been modified to control injected active and reactive powers of battery energy storage. Using this model, loss of load and loss of generation
xxxii
scenarios were simulated on Kundur test system and simplified Hydro-Québec model in MATLAB. The results confirm the possibility of utilization BES as primary frequency reserve. In addition, the reactive power of BES may provide additional gain for frequency regulation, if tuned properly.
In this chapter, we
Proposed the novel idea for adding virtual inertia by controlling the frequency swing dynamics through voltage
Carried out the mathematical formulation demonstrating the degree of impact supported with sensitivity analysises and an example.
Constructed a new control tuned tackling low frequency common mode
Performed several simulations in time domain and in frequency domain using benchmarked models from previous chapter.
Evaluated the validity of results analyzed and discussed the results
Constructed SPS models for three well-known test systems, NE39bus, AU14gen and RTS96 with the SPS team
wrote the necessary MATLAB codes for data files
Published the models in MATLAB central (will be included in next version of MATLAB)
Studied frequency regulation using BES
Presented the additional gain for frequency regulation using reactive power of BES
xxxiii Problem Statement
Application of battery energy storages in electric power systems is growing rapidly. The battery energy storage offers many advantages in the terms of energy efficiency, durability and safety for humans. A number of demonstration and commercial projects, studied in the U.S and Japan in particular, have confirmed the technical and economic potentials of battery energy storages. Many researchers around the world try to identify and to utilize this technology in their power networks. However to our knowledge, this type of study has not been done in Québec province yet. Moreover, studies published abroad (EPRI, KEMA, MISO, CEC, IEA, etc.) show significant gaps between the realistic representation of battery energy storages and poorly adaption of these technologies in Québec network particularly in the term of technical benefits. Extensive technical assessments are required to measure potential benefits of battery energy storage on corporate level and to extend its avaiability across the Québec province.
The next significant phenomenon is the emergence of recent technological Lithium-Iron-Phosphate (LiFePO4) in which IREQ is a world leader. This kind of battery is characterized by high level of safety, overall efficiency up to 95% on the prototype, and a great number of cycles of charge/discharge which may exceed 30,000 times over lifetime. The project will not only provide a better understanding of scopes of the most profitable battery LiFePo4, but also it will provide Hydro-Québec with optimization tools to facilitate technical analysis of different scenarios for the network to reduce losses.
In this context, various scopes of LiFePO4 battery storage have been questioned. For transmission owner, it can be a solution to reduce losses, and to postpone investment in network expansion required by the demand growth in peak power. For generating units, it can provide additional services or relieve congestion on interconnection with neighboring systems.
The purpose of this study is setting a pilot of study at IREQ in order to provide technical formulation and tools for some specified applications of battery energy storages such as peak shaving, energy efficiency improvement and frequency regulation. The study also comprises optimized scenarios for each application.
xxxiv Objectives of this Work
As discussed in the problem statement section, there are several issues associated with the development, implementation, and application of battery energy storages in practice. To address these points, the aims of this study are:
The state of art for identifying different types of battery energy storages A review on multi-objective optimization tools
Suitable model for behavioral studies of battery energy storage to optimize transmission losses
Formulating a step-by-step approach for allocation of battery energy storages in test power systems and in Québec interconnection
Optimal Allocation of multiple battery energy storages for minimizing active power losses
Proposing an optimal utilization strategy of battery energy storages for maximizing 1): benefits from loss reduction 2): energy efficiency
Formulating a vulnerability index which is suitable for power systems when included battery energy storages
Optimal Allocation of multiple battery energy storages for vulnerability mitigation in power systems
Developing IEEE test systems in MATLAB SimPowerSystem environment as a pilot for studies in future
Proposing, developing, and simulating the idea of frequency behavior improvement using reactive power modulation on modeled test systems
xxxv Original Contributions
Briefly, the main contributions of this thesis are:
Multi-objective optimal allocation of multiple battery energy storages using evolutionary algorithms for 1): minimizing total installed capacity of battery energy storages, 2):minimizing active power losses of power system 2) vulnerability mitigation
A step-by-step approach for allocation of battery energy storages in power systems and minimizing, for each generating unit, distance of current operation point from optimal operation point
Optimal utilization of battery energy storages in power system for maximizing 1): marginal losses 2): energy efficiency
Developing IEEE test systems in MATLAB SimPowerSystem environment as a pilot for studies in future
Reactive power modulation for frequency behavior improvement and damping low frequency common mode
Frequency regulation using battery energy storages in a simulation-based framework
xxxvi List of Publications
A list of published articles in journals and conferences that are written based on results of this research is given in follows:
Moeini, A., Kamwa, I. and de Montigny, M. (2015). Optimal Multi-Objective Allocation and Scheduling of Multiple-Battery Energy Storage for Energy Efficiency Improvement. The Climate Change Technology Conference (CCTC), Paper Number: 1570095445 (Presented in Montreal, CA)
Moeini, A., Kamwa, I. and de Montigny, M. (2015). Optimal multi-objective allocation and scheduling of multiple battery energy storages for reducing daily marginal losses. IEEE Power & Energy Society Innovative Smart Grid
Technologies Conference (ISGT), pp.1-5. (Presented in Washington, USA)
Moeini, A., Kamwa, I. and de Montigny, M. (2015). Power Factor-based Scheduling of distributed Battery Energy Storage Units optimally allocated in Bulk Power Systems for mitigating Marginal Losses. IET Generation, Transmission, and
Distribution, (accepted).
Moeini, A. and Kamwa, I. (2015). Analytical Concepts for Reactive Power Based Primary Frequency Control in Power Systems. IEEE Trans. Power Syst. (accepted) Moeini, A., Kamwa, I. and Le-Huy, H. (2015). Reactive Power Control for
Improving Primary Frequency Response in Power Systems. North American Power
Symposium, pp. 1-6. (presented at Charlotte, USA)
Moeini, A., Kamwa, I, Brunelle, P. and Sybille, G. (2015). Open Data IEEE Test Systems Implemented in SimpowerSystems for Education and Research in Power Grid Dynamics and Control. Power Engineering Conference (UPEC), 50th
International universities, pp. 1-6 (presented at Stoke-on-Trent, United kingdom)
Ali Moeini, Innocent Kamwa, Martin de Montigny, and Laurent Lenoir (2016) Application of Battery Energy Storage for Network Vulnerability Mitigation.
IEEE/PES Transmission and Distribution Conference and Exposition (T&D),
1
Chapter 1
Introduction
The main aim of the first step is to study state of art and to identify different types of storage units. Step one includes a review on some energy storage technologies with a description of development status, sizing for the pertinent stationary energy storage applications, technical characteristics, economic considerations and relevant references. More details were brought in appendix.
1.1 Integrating Battery energy Storage into the Electricity Value Chain
Power system owners and utilities encounter numerous challenges in modern power systems providing customers with reliable, resilient and uninterruptable energy. Load demand growth, increasing adoption of unpredictable renewable energy sources and global warming dilemma pushed the power grids toward technical and economic boundaries. The need for a broadest range of viable solutions is sensed more than ever. Due to recent advancement in chemical engineering, constructing battery energy storages in large scales is technically feasible which are safe, reliable and has a long life span. Battery energy storage for power system application has gained significant attention. It is called sometimes a game changer in the structure of power systems and is likely to become an essential contributor to power grid modernization. Several applications using battery energy storages are possible as:
2 Grid stabilization
Battery energy storage has almost instantaneous response time which is highly appreciated for grid stabilization issues such as damping oscillation.
Power quality improvement
Due to the valuable characteristic of battery energy storages, power quality improvement is feasible by reacting in millisecond scale.
Load shifting (energy arbitrage)
Literally, the battery energy storage can shift the load demand by providing the current load demand, discharge mode, and add a virtual load later, charge mode.
Peak shaving
Energy storage may charge during off-peak hours, i.e. midnight and early morning, and discharge during on-peak hours to cut the escalated demand.
Electric bill management
Energy storage is utilized by end-use power system customers in different ways to reduce electric bills.
Electric energy time shift
Time shift using energy storage means charging energy during low price hours, and discharging during high price hours.
Renewables capacity firming (Forecast hedging)
Battery energy storage has the ability to mitigate rapid output changes from renewable generation, caused due to wind speed variability.
Transmission support
Energy storage can be used for transmission support by compensating for electrical anomalies and disturbances such as unstable voltage, voltage sag, and sub-synchronous resonance.
3
Transmission and Distribution (T&D) upgrade deferral
The T&D upgrade deferral benefit is mostly related to the use of energy storage to defer the need of replacing or upgrading the existing T&D equipment and to extend the service life of existing equipment by reducing loading level.
Transmission congestion relief
Transmission may become congested during peak demand period, pushing the grid toward limits and driving the need and cost for more transmission capacity and increased transmission access charges. In this application, battery energy storage systems are allocated at locations that are electrically downstream from the congested part of the transmission line and discharged, during peak hours to release transmission capacity.
Frequency excursion suppression
Frequency excursion suppression offers the power system the ability to maintain frequency within a nominal acceptable range following a severe disturbance. The capability to quickly restore balance between generation and load, by absorbing or injecting power, may avoid load shedding or tripping of generating units.
Voltage stability
According to fundamental relationship between load and voltage, maintaining adequate reactive power in power system is critical to ensuring voltage stability. Heavily loaded high voltage transmission lines serving the critical areas, on-load tap changers, and increasing reactive power demand may lead to voltage instability issues. The battery energy storages have capability of working in lead or lag modes to follow and damp voltage instabilities.
Regulation
Battery energy storage is an online power source that has automatic generation control. It can respond promptly to track the minute-to-minute power fluctuations in system load and to correct unplanned fluctuations in generator output
4
Battery energy storage may also operate as synchronized generating uint in the grid that can increase or decrease its output immediately in response to major disturbances.
Black start
Battery energy storage has the ability of a power source to move from a shutdown condition to an operating condition without assistance from connected electrical grid. This feature assists to restore the grid and to help other generating units producing power after blackouts.
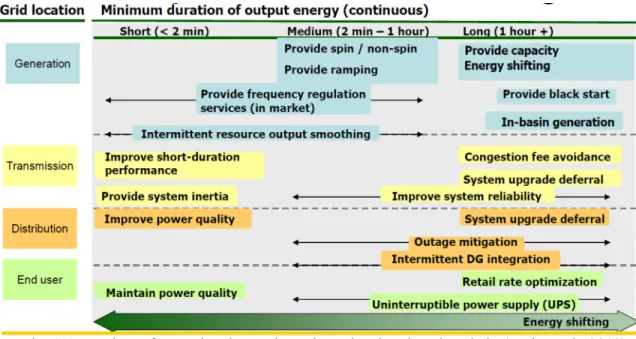
Fig. 1-1 shows operational benefits of energy storages in different sections of a grid.
Fig. 1-1: Variety of operational uses throughout the electric value chain (Irwin et al., 2012)
1.2 Studied Technologies
The studied technologies are categorized in two groups. A number of well-known battery energy storage technologies are included in first group. The second group comprises other technologies such as pumped-storage hydroelectricity.
1.2.1 Battery Energy Storages
Several storage technologies have demonstrated and utilized in power systems. Each technology has its own advantages and disadvantages. In this chpter, five well-known stationary batteries have been studied.
5
1.2.1.1 Sodium-Sulfur Batteries
Sodium/Sulfur battery is one of rechargeable sodium-based high-temperature battery technologies which provide attractive solutions for energy storage applications. It has been the subject of various researches development in several countries. A number of sodium-based batteries have been offered during the past decades. But sodium-beta batteries are the most attractive variants. This development is used because of two significant features:
Liquid sodium is the active material in negative electrode. Ceramic beta-alumina functions as the electrolyte.
1.2.1.2 Nickel Electrode Batteries
Rechargeable nickel-electrode batteries have been introduced by Thomas Edison. He presented the first nickel-iron battery a century ago. Several materials have been used with nickel to build nickel based battery technologies. There are five mature battery technologies that apply the nickel-electrode: nickel-cadmium (NiCd), nickel-metal hydride (NiMH), nickel-iron (NiFe), nickel-hydrogen (NiH2), and nickel-zinc (NiZn). Of these, NiCd and
NiMH are the most common and well-known batteries. All these batteries have potential to be integrated in power system.
1.2.1.3 Lead–Acid Batteries
Lead–acid battery has been a successful technology among battery technologies for decades. They have a commercial history of success, and are utilized in every area such as telecommunication, portable electronics, power tools, transportation, mining and materials handling equipments, automotive applications, and auxiliary power in stationary power plants. The technology of lead-acid battery continues to grow in battery market to the present day. Its application in power system area also grows because of new utilizations in commercial uninterrupted power supplies, emergency power, energy storage units, and electric and hybrid vehicles. By the 20th century, significant lead-acid battery manufacturing infrastructures were in Place. At present, a number of lead-acid battery facilities in various countries are at operation stage.
6
Although all forms of lead-acid batteries follow the same basic chemical reaction, but they categorized in several types, each suited for specific applications. They can vary widely in terms of performance, cost, and method of manufacturing. There are two main categories of lead-acid batteries, flooded lead-acid or vented lead-acid (VLA) battery and valve-regulated lead-acid battery.
1.2.1.3.1 Flooded Lead-Acid Batteries
Flooded lead-acid batteries are the traditional form of lead-acid batteries in which the electrodes are immersed in reservoirs of excess liquid electrolyte. VLA continues to grow in battery market, due to their application in most industrial applications. There are three general types of VLA batteries:
1. Starting, Lighting and Ignition (SLI) batteries which are the most common use in auxiliary power for internal combustion engine systems, and short-term utility power quality applications.
2. cycle or traction batteries designed for deep discharge applications. Deep-cycle batteries are most commonly used in electrically powered vehicles.
3. Stationary batteries which are usually utilized to provide dc power for switching and control operation, such as telecommunications systems, standby emergency power, power generation plants, and in utility substations.
1.2.1.3.2 Valve Regulated Lead-Acid (VRLA) Batteries
Valve Regulated Lead-Acid (VRLA) batteries have been utilized in a large number of small applications, including power tools, portable electronics, and uninterrupted power supplies (UPS), and in a few large applications such as forklift batteries. The VRLA batteries are also divided into two Gel and Absorbed Glass Mat (AGM) categories. The different titles show different methods of containing the electrolyte. In Gel type, a thickening agent is added to turn the electrolyte from liquid to gel. In AGM type, a glass matrix is utilized to comprise the liquid electrolyte.
7
1.2.1.4 Zinc-Bromine Batteries
An attractive solution for large-scale energy storage systems suggested by researchers is rechargeable zinc battery. It is because of relatively low cost of zinc and high energy density. Flow batteries are also well-known as a solution for large systems, because they are highly scalable and provide the system design with flexibility. The zinc-bromine flow battery takes advantage of these two technologies which results in very attractive technology for both utility-energy storage and electric-vehicle applications.
1.2.1.5 Lithium-ion Batteries
Lithium-ion battery, Li-ion battery or LIB, is a rechargeable battery. During discharge lithium ions move from the negative electrode to the positive electrode and during charge come back. Compared to the metallic lithium in a non-rechargeable lithium battery, lithium-ion batteries take benefit of an intercalated lithium compound as one electrode material. The three consistent functional components of a lithium-ion battery are the positive, negative electrodes, and electrolyte. Applications now addressed with Li-ion batteries almost include every area of technology. An interesting characteristic of Li-ion batteries is their extensive cycle life and capability to cycle continuously at low, high, or ambient temperature.
1.2.1.6 Lithium iron Phosphate (LiFePO4) Battery
The lithium iron phosphate (LiFePO4) battery is a type of lithium-ion battery that uses iron phosphate as a cathode material. It also called LFP battery with "LFP" standing for "Lithium FerroPhosphate". LiFePO4 batteries are inherently safer and offer longer lifetimes and better power density.
1.2.2 Other Technologies
A review has been performed on three other mature energy storage technologies which are brought in follows:
8
1.2.2.1 Flywheel Energy Storage (FES) System
Flywheels are one of the earliest mechanical energy storage mechanisms. The principle of the flywheel was found in the Neolithic spindle and the potter's wheel, a device applied to produce symmetrical ceramic containers. Flywheel is a rotating mechanical device applied to store rotational energy. Flywheels have a significant moment of inertia and consequently resist any variations in rotational speed. From the beginning of industrial revolution, traditional steel-made flywheels have been utilized in various areas such as propulsion, road vehicle, and smooth delivered mechanical power. One of the pioneer utilization of FES to electric power systems was for smoothing the output of low speed steam piston engines which was driving flywheel generators.
1.2.2.2 Compressed Air Energy Storage (CAES)
A method to store energy is Compressed Air Energy Storage (CAES). CAES applies electricity to store energy at one time for use at another time. During the phases of excess availability CEAS uses off-peak electricity to drive compressors compress air into either an above ground utility – tanks, pipes- or any underground structures - a cavern, aquifer, or abandoned mine-. For discharge stage of CEAS, the compressed air is conducted via an air turbine to drive an electricity generator.
1.2.2.3 Pumped Storage Hydroelectric (PSH)
Currently one of the most widespread energy storage technologies used in power networks are Pumped Storage Hydroelectric (PSH) systems. PSH development in the US and European countries is related to base load. PSH systems have been used to supply energy at times of high load demand and to allow base generators such as nuclear units to maintain operation in their base load mode during low load demand period. PSH systems also have ability to enhance the efficiency and operation of large scale hydro power plants. In addition, PHS systems have capability of power system management such as balancing, frequency stability and black starts.
9 1.3 Technology Status:
The number of energy storage projects around the world is rapidly increasing. A very useful source for tracking the latest status of projects is the website of Department of Energy (DOE) global energy storage database (http://www.energystorageexchange.org). The DOE global energy storage database provides free, up-to-date information on grid-connected energy storage projects and relevant state and federal policies. Note that all figures exclude information regarding pumped hydro storage. Only the Fig. 1-2 shows the status of operational pumped hydro storage. More than 142 GW pumped hydro power has been installed so far.
Fig. 1-2: Operational pumped hydro storage around the world (DOE Global Energy Storage Database) Jan 2016
Considering the other types of energy storages we have:
10
Fig. 1-3: Operational energy storage projects (DOE Global Energy Storage Database) Jan 2016
More than 2GW, 172 projects are under construction worldwide (Fig. 1-4).
11
About 1.6 GW, 152 projects, are announced or contracted worldwide (Fig. 1-5).
Fig. 1-5: Announced or contracted energy storage projects (DOE Global Energy Storage Database, Jan 2016) Jan 2016
Fig. 1-6 shows top 10 countries by installed capacity of energy storage. The US has largest capacity in the world.
12
Top use cases for energy storages have been depicted in Fig. 1-7. As shown, coupling with renewable energy sources, energy time shift, and bill management are the most attractive cases.
Fig. 1-7: Top applications for energy storages (DOE Global Energy Storage Database) Jan 2016
Several projects are also ongoing in Canada. Fig. 1-8 shows that 18 projects are active, operational, and under construction or contracted.
Fig. 1-8: The status of energy storage in Canada (DOE Global Energy Storage Database) Jan 2016
13
Finally, it is worth to say that more than 713 projects, about 1.6 GW, battery energy projects are active as of 2015 around the world (Fig. 1-9). These projects are mostly used for forecast hedging energy time shift, and frequency regulation applications respectively (Fig. 1-10).
Fig. 1-9: Battery energy storage projects in the world (DOE Global Energy Storage Database) Jan 2016
Fig. 1-10: Most interested applications of battery energy storages (DOE Global Energy Storage Database)
![Table 3-6: The optimal Pareto front given by SMPSO for RTS96 [9 BES]](https://thumb-eu.123doks.com/thumbv2/123doknet/6458113.171860/96.918.141.822.714.1051/table-optimal-pareto-given-smpso-rts-bes.webp)
![Table 3-8: PLR of Pareto front given by SMPSO for RTS96 [ 6BES, 100% loading]](https://thumb-eu.123doks.com/thumbv2/123doknet/6458113.171860/99.918.332.629.150.630/table-plr-pareto-given-smpso-rts-bes-loading.webp)
![Table 3-10: PLR of Pareto front given by SMPSO for RTS96 [ 3BES, 130% loading]](https://thumb-eu.123doks.com/thumbv2/123doknet/6458113.171860/102.918.332.633.323.1010/table-plr-pareto-given-smpso-rts-bes-loading.webp)
![Fig. 3-21: Optimal Pareto front of NSGA-II for Québec interconnection [3BES] (230 KV buses) Table 3-16: Optimal Pareto front of NSGA-II in coded form [3BES] (230 KV buses)](https://thumb-eu.123doks.com/thumbv2/123doknet/6458113.171860/115.918.166.797.109.611/optimal-pareto-nsga-québec-interconnection-table-optimal-pareto.webp)