HAL Id: hal-02989463
https://hal.archives-ouvertes.fr/hal-02989463
Submitted on 12 Nov 2020
HAL is a multi-disciplinary open access archive for the deposit and dissemination of sci-entific research documents, whether they are pub-lished or not. The documents may come from teaching and research institutions in France or abroad, or from public or private research centers.
L’archive ouverte pluridisciplinaire HAL, est destinée au dépôt et à la diffusion de documents scientifiques de niveau recherche, publiés ou non, émanant des établissements d’enseignement et de recherche français ou étrangers, des laboratoires publics ou privés.
connectivity of silica fiber preforms
Maria Cicconi, Wilfried Blanc, Dominique de Ligny, Daniel Neuville
To cite this version:
Maria Cicconi, Wilfried Blanc, Dominique de Ligny, Daniel Neuville. The influence of codoping on optical properties and glass connectivity of silica fiber preforms. Ceramics International, Elsevier, 2020, 46 (16), pp.26251-26259. �10.1016/j.ceramint.2020.05.233�. �hal-02989463�
1
The influence of codoping on optical properties and glass
1
connectivity of silica fiber preforms.
23
M.R. Cicconi1,2*, W. Blanc3, D. de Ligny1, D.R. Neuville2
4 5
1 – Department Werkstoffwissenschaften, Lehrstuhl für Glas und Keramik, Universität 6
Erlangen-Nürnberg. Martensstrasse 5, D-91058 Erlangen, Germany 7
2 – Institut de Physique du Globe de Paris, 1, rue Jussieu, F- 75005 Paris, France 8
3 – Université Côte d'Azur, CNRS, Institut de Physique de Nice, UMR 7010, Parc Valrose, 9
Nice, Cedex 2, France 10
11 12
Keywords: REE, Raman, Photoluminescence, glass structure, cations structural role 13
14
*Corresponding author: Dr. Maria Rita Cicconi 15
e-mail: [email protected]
16
phone: +49 9131 85-27567 17
Friedrich-Alexander-Universität Erlangen-Nürnberg, Martensstrasse 5, D-91058, Erlangen 18
(Germany) 19
20 21
The authors declare that they have no known competing financial interests or personal 22
relationships that could have appeared to influence the work reported in this paper. 23
24
Confirmation of Authorship 25
As corresponding author, I Maria Rita Cicconi, hereby confirm on behalf of all authors that this 26
manuscript is original and unpublished, and is not being or having been submitted for 27
publication to any other journal, and that all the authors have read the manuscript and agree 28
with its submission to Ceramics International. 29
Dr. Maria Rita Cicconi 30
2
The influence of codoping on optical properties and glass connectivity of
32
silica fiber preforms.
33 34
M.R. Cicconi1,2*, W. Blanc3, D. de Ligny1, D.R. Neuville2
35 36
1 – Department Werkstoffwissenschaften, Lehrstuhl für Glas und Keramik, Universität 37
Erlangen-Nürnberg. Martensstrasse 5, D-91058 Erlangen, Germany 38
2 – Institut de Physique du Globe de Paris, 1, rue Jussieu, F- 75005 Paris, France 39
3 – Université Côte d'Azur, CNRS, Institut de Physique de Nice, UMR 7010, Parc Valrose, 40
Nice, Cedex 2, France 41
42 43
Abstract 44
REE-doped glasses have applications in many fields, and for example, Al and Ce 45
codoping in SiO2 fiber preforms is usually done to attenuate the optical degradation
46
(photodarkening) of e.g. Yb and Tm doped silica optical fibers. In this study, we investigated a 47
SiO2 fiber preform having a gradual increase of the CeO2 + Al2O3 content from 1.5 to 6.3 mol%
48
and a CeO2/Al2O3 molar ratio varying from 0.04 to 1.4. Raman and photoluminescence
49
spectroscopies have been used to evaluate changes in the short- and medium-range order both 50
in the cladding and in the core portions, and the evolution of the glass optical properties, 51
respectively. The variations of the excitation and emission bands have been linked to 52
modifications in the vibration bands of the Raman spectra, and in turn, the relationship between 53
optical properties and glass connectivity has been carefully considered. Our results show that 54
there is a strong positive linear relationship between the increase of the Raman bands in the 55
high-frequency range and the red-shift of the excitation maxima. Therefore, the change of <Ce-56
O> distances and covalency character influences, in the same way, both the photoluminescence 57
behavior of the core, and the connectivity of the amorphous network. 58
59
Keywords: REE, Raman, Photoluminescence, glass structure, cations structural role 60
61
Introduction
62
Since the 1960s, when the first commercially available silica-based optical fiber was 63
developed, the applications of this material have greatly widened from telecommunication to 64
sensors, to biomedical applications [1,2]. In a recent review, Ballato and coauthors[1] report 65
an overview of the main characteristics of optical fibers, and about the development of new 66
3 materials and processes that will enable the design of advanced optical fibers suited to further 67
uses. Above and beyond the development of new bulk chemistries or of composite materials 68
(e.g. nanoparticles), researcher have first tried to enhance our understanding of SiO2-based
69
optical fibers by studying the occurrence of defects under various conditions, or by investigating 70
the effect of doping on the formation or suppression of defects e.g. [3–5]. Many other studies 71
were focused on the core composition, in order to avoid the clustering of Rare Earth Elements 72
(REE), and enhance REE solubility, e.g. [6,7]. Al and/or P and/or Ce codoping, besides 73
increasing REE solubility, has been recognized as a very effective way to mitigate Yb- or Tm- 74
based fibers optical degradation (aka photodarkening) [8,9]. For instance, a combination of Al 75
or P, or the codoping of Al, P and Ce is able to reduce the photodarkening of Si-based fibers. 76
This mitigation, in Ce-codoped fibers have been attributed to the coexistence of cerium with 77
two stable oxidation state (trivalent and tetravalent), and the occurrence of two processes: either 78
Ce3+ that by trapping a hole may lose the 4f electron to form Ce4+ species or Ce4+ trapping an
79
electron to form Ce3+ species [8–12]. Significantly fewer studies have been devoted to the
80
understanding of how elements enter into the silica network, and how the different properties 81
of the SiO2 optical fibers are modified e.g. [6,13]. Because of the strong link between glass
82
structure and properties, an understanding of the cations speciation would lead not only to the 83
understanding of the mitigation of the photodarkening, but also to the understanding of the glass 84
fibers properties on a broader scale. Indeed, this lack of knowledge hampers the development 85
of new materials and applications. Consequently, we started an investigation of silica optical 86
fiber preforms codoped with cerium and/or aluminum, focusing on the element structural role 87
and glass connectivity. In a recent study, we assessed the role of aluminum in influencing Ce 88
speciation (valence, coordination, bond character) in aluminosilicate glasses and Ce-doped or 89
Ce/Al codoped silica fiber preforms, collapsed under different conditions [14]. The addition of 90
aluminum prompts the stabilization of reduced Ce species, and induces variations of the Ce 91
local environment, causing a blue shift of the photoluminescence emission band. Furthermore, 92
it was established a Ce redox ratio limit (Ce3+/Cetot > 0.85 ± 0.07) that marks the clear
93
occurrence of additional bands in the UV region. Based on the results, it was evaluated that the 94
photodarkening attenuation is most probably due to to the ability of trivalent Ce to trap hole 95
centers. Since Ce redox ratio and bond covalency change depending on Al 96
concentration/structural role, cerium photoluminescence properties were correlated by 97
considering the glass bulk composition (in terms of optical basicity), and Al average 98
coordination [14]. Despite the remarkable results obtained, codoping at the dilute scale may 99
influence differently the response of the properties. 100
4 In the present study, by using a SiO2 fiber preform having a gradual change of the
101
Al2O3/CeO2 molar ratio codoping, we correlate cerium photoluminescence properties to the
102
variations occurring in the glass connectivity, and in turn on the codopant structural role 103
(valence, bond distances, and coordination). Raman spectroscopy was used to identify changes 104
in the short- and medium-range order of cladding and codoped cores, and these results were 105
associated to the variations observed in the luminescence properties, and in turn, to the Ce 106
species structural environment. 107
In addition to photodarkening attenuation, the luminescence properties of cerium (and 108
REE in general) are quite important in many other fields, including phosphors, scintillators and 109
generation of fiber gratings [15–19]. Hence, understanding the evolution of cerium (REE) 110
valence and local environment and the effects on the host structure has a key role in the 111
development of new materials and technical applications. 112
113
Experimental Methods
114
Preform was prepared by the conventional modified chemical vapor deposition 115
(MCVD) technique. In order to obtain a gradual change of the codopant molar ratio along the 116
preform, aluminum and cerium were incorporated with the gradual solution doping technique 117
[20]. Two doping solutions were prepared: solution A contains 1 mol/l of AlCl3:6H2O; in
118
solution B, CeCl3:6H2O and AlCl3:6H2O concentrations were 1 and 1 mol/l, respectively. The
119
pure silica core porous layer was soaked first with solution A. Then, solution A is removed and 120
the solution B is injected in the preform and slowly drained until the bottom (draining time: 20 121
minutes) to induce a change in cerium concentration. After drying of the solvent, the core layer 122
was sintered down to a dense glass layer in O2 flux. Then, the tube was collapsed under the
123
same flux into a solid rod, referred to as preform, at an elevated temperature higher than 1800 124
°C. 125
Small disks (1 mm thickness) of the solid rod (9 mm diameter) have been cut at different 126
positions along the preform. Each disk represents a different CeO2/Al2O3 molar ratio in the
127
codoped core, starting from the sample cut at 4 cm (CeO2/Al2O3 = 0.04), up to the sample cut
128
at 32 cm (CeO2/Al2O3 = 1.4) as well as a variation of the CeO2 + Al2O3 content from 1.5 to 6.3
129
mol% (see Table 1). The surrounding cladding is composed almost exclusively by SiO2 (99.98
130
- 99.89 mol%), with small impurities of Al2O3. Disks are labeled according to the distance, and
131
then to the increasing CeO2/Al2O3 molar ratio. A schematic drawing (Figure 1) reports sample
132
labels, and codopant molar ratios, whereas the core composition is reported in Table 1. Images 133
and chemical analyses have been obtained by Energy dispersive X-ray (EDX) and scanning 134
5 electron microscope (SEM) analysis at the Institute de Physique du Globe de Paris (France). 135
The SEM-EDX mapping allowed checking the homogeneous distribution of the dopants in the 136
core portions. Photoluminescence spectra of each disk core have been collected with a 137
spectrofluorometer equipped with double monochromators (Czerny-Turner) in excitation and 138
emission (Fluorolog3, Horiba Jobin Yvon), using a 450 W Xe-lamp as the excitation source 139
(excitation and emission spectral resolution ≤ 1.5 nm). Spectra have been normalized to the 140
maximum intensity. Raman spectra have been collected both with laser excitations at 488 nm 141
and 532 nm at the Department of Materials Science and Engineering (WW3, FAU Erlangen- 142
Nürnberg, Germany). The Thermo Scientific NicoletTM Almega Raman spectrometer (532nm)
143
coupled with a quality Olympus visible microscope (objective 100x), and a high-144
resolution grating (2400 lines/mm) provides a very good spatial and frequency resolution, 145
respectively of ~1 µm and 1 cm−1. All spectra have been normalized to the total area, after
146
removal of a polynomial background. Moreover, Raman spectra were also collected with a 147
different excitation line (488nm) in order to check the presence of any contribution arising from 148
luminescence centres. 149
150
Figure 1: Schematic drawing of the core portion of the SiO2 preform (silica cladding not represented).
151
Each bold number indicates the position where the disks have been cut (cm) along the preform, which also 152
represents samples labeling. Darker color indicates a higher CeO2 content. On top is reported the
153
CeO2/Al2O3 molar ratio in the codoped core.
154 155
Results and discussion
156
Ce3+, contrary to the oxidized Ce4+ species, is optically active and has fluorescence
157
emission that originates from a transition from one (or more) of the 5d levels, to the 2F ground 158
state [7,21,22]. Trivalent cerium has a [Xe] 4f1 ground electronic state, which is split into two
159
sublevels (doublet 2F5/2 and 2F7/2), separated by about 2200 cm-1, and the excited levels 5d lie
160
about 40000 cm-1 above the ground state [22,23]. Despite the well-shielded inner electronic
161
shell, the f-d transitions are strongly dependent on the chemical and structural environment. 162
Hence, both Ce3+ excitation (Ex) and emission (Em) spectra might shift depending on Ce
163
content, temperature, glass polymerization and connectivity [7,14,22,24,25]. For example, in a 164
previous study on Na aluminosilicate glasses we observed that both Ce3+ excitation and
165
emission bands shift depending on the Al/Na molar ratio, and drastically change for 166
peraluminous compositions [14]. 167
Figure 2 shows the photoluminescence spectra for all codoped core samples. Excitation 168
spectra were collected at the maximum of the emission, and vice versa. By increasing Ce 169
content, and in turn, the CeO2/Al2O3 molar ratio, there is a gradual shift of both Ex and Em
6 bands toward lower frequencies. The excitation band is an asymmetric broad band that can be 171
deconvoluted in three contributions, with the first two, respectively at ~ 35000 cm-1 (~ 285 nm;
172
G3Ex), and ~ 32300 cm-1 (~ 310 nm; G2Ex), remaining nearly at the same frequency, despite the
173
different compositions (Table 2). On the contrary, the third band is a very small feature centered 174
at ~ 30900 cm-1 (~ 324 nm; G1Ex) in Ce-poor preform (sample 4), which represents only 11%
175
of the whole excitation band area (Figure 2). By increasing the CeO2 content, this feature
176
gradually shifts toward lower frequencies and increases its intensity, becoming the stronger 177
contribution in sample 32 (representing ~ 50% of the whole excitation band). The Ce-rich 178
preform (sample 32) has this contribution centered at ~ 29600 cm-1 (~ 339 nm) (Table 2).
179
The asymmetric luminescence is related to the allowed electronic transition 5d → 4f, 180
and two sublevels of Ce3+ transitions from the 5d to 2F
7/2 and 2F5/2 states are clearly discernible
181
(Figure 2). The emission bands have been analyzed and deconvoluted in two Gaussians that are 182
split by ~2300 cm-1 apart, in agreement with the L-S splitting of Ce3+ ions [22,23]. Sample 9
183
presents the minimum split of ~2180 cm-1 (see Table 2), and has the lowest Stokes shift (~ 5100
184
cm-1). By increasing the Ce content, there is a general decrease of the Em asymmetricity, and
185
an increase of both Stokes shifts and ground level splitting. Additionally, the emission shows a 186
red shift, with the Em maximum moving from 27400 cm-1 to 24000 cm-1 (~ 366 and 416 nm,
187
respectively), by increasing Ce content (Figure 2). Band position and results from the bands’ 188
deconvolution of both excitation and emission spectra are reported in Table 2. 189
190
Figure 2: Normalised excitation (Ex) and emission (Em) spectra for the different samples, and 191
deconvoluted Gaussian bands. By increasing the CeO2 molar content both Ex and Em bands show a red
192
shift, and an increase of Stokes shifts and of the ground level splitting. The luminescence properties of 193
sample 4 are different. See text for details. 194
195
Absorption bands of Ce ions in glasses, attributed to the 4f1 → 5d1 transition, have been 196
reported in the wide-ranging region 28500 – 50000 cm-1, depending on the bulk chemistry. In
197
this region, two broad contributions related to charge transfer (CT) transition of Ce4+ overlap
198
with the Ce3+ ions 4f1 → 5d1 bands [7,22,26–28]. The position and the intensity of Ce4+ CT
199
absorption bands change remarkably depending on glass (host) composition [24,29,30]. Ce3+
200
emission band as well may cover a wide range of frequencies, depending on glass composition, 201
and in particular, the presence of aluminum causes a marked blue shift of the luminescence 202
band in Ce-doped glasses (e.g. [7]), along with a change in the cerium average oxidation state 203
[14]. Based on the previous investigations on the influence of bulk chemistry (optical basicity) 204
and Al content on Ce redox state [14,31,32], we do not expect a very high amount of oxidized 205
species in the preform cores. Because of the low basicity of the glass (very high amount of 206
7 SiO2) and a CeO2/Al2O3 molar ratio > 0.1, we estimate a Ce3+/Cetot ratio ≤ 0.8 for all glasses,
207
except for the Ce-poor one (sample 4). The latter has > 98 mol% of SiO2, and a CeO2/Al2O3
208
ratio of 0.04, and an expected Ce3+/Cetot ratio ≥ 0.9. In addition, since the excitation bands of
209
samples 32 to 9 are very similar to those previously reported for aluminosilicate and (Ce, Al) 210
codoped silica fiber preforms [14], we are confident that they should have a similar average 211
estimated Ce3+/Cetot ratio. In contrast, sample 4 excitation has the two strongest contributions
212
at higher frequencies: In particular, the contribution at ~ 35700 cm-1 (~ 280 nm), has a frequency
213
compatible with the occurrence of band(s) related to charge transfer transitions. In 214
peraluminous silicate glasses and (Ce, Al) codoped silica fibers this band has been observed to 215
become predominant for high amount of reduced Ce species [14]. Since sample 4 has an 216
expected Ce3+/Ce
tot ratio ≥ 0.9, following optical basicity considerations, we might associate as
217
well the high-frequency band in the excitation signal to trapped hole centers, and in turn, to 218
trivalent cerium that may lose the 4f electron: Ce3+ + h+ = Ce3++ + e-.
219
In order to exclude any possible contribution from the silica glass, the 220
photoluminescence signals of some of the cladding portions have been measured as well, by 221
using the same experimental conditions used for the codoped cores. It was observed the 222
occurrence of some bands in the outer silica claddings, with visible intensity variations across 223
the portion analyzed. The broad contributions observed have maxima centered at ~ 27000 and 224
~ 22700 cm-1 (excitation and emission maxima, respectively). These bands may be related to
225
some impurities, and most likely to the occurrence of Si defects in the cladding. The most 226
intense bands observed have been compared to the signals collected in the core (Figure 3). 227
Photoluminescence spectra of the codoped cores have been collected at the maximum of the 228
excitation or of the emission signals, indicated by the vertical black arrows in Figure 3. The 229
signal intensity increases by increasing the Ce molar content, both in the excitation and in the 230
emission. The strongest excitation signal observed in the different cladding (grey solid line) 231
consists of a broad asymmetric band centred at ~ 370 nm and a minor contribution at ~ 300 nm 232
(orange vertical arrow). Two emission spectra are reported for the cladding, one collected with 233
an excitation wavelength of 300 nm (orange solid line, a position almost overlapping the 234
maximum of sample 4) and one collected at 350 nm (grey solid line). Even if the emission of 235
Ce-doped samples (9 to 32) overlaps the one of the cladding, the contribution that the cladding 236
might provide is at least 6 times smaller and shifted at lower frequencies. The Ex signal of the 237
cladding is partially overlapping the cores Ex bands, and may contribute to the signal only on 238
the tail at lower frequencies, thus without influencing the three main contributions (Figure 2). 239
Therefore, the influence of the silica cladding on Ce bands is very limited. 240
8 241
Figure 3: Photoluminescence spectra collected in the codoped cores are compared to the most intense 242
signals observed in the cladding (grey solid lines). Black vertical arrows indicate the Ex and Em 243
wavelength used to collect the signals in the codoped core samples. For the cladding, two emission bands 244
are reported, one collected with an excitation wavelength (lEm) of 300 nm (close to the Ex maximum of
245
sample 4 – orange vertical arrow), and the other one collected at 350 nm (grey vertical arrow). 246
247
In order to better understand the frequency shifts and the photoluminescence evolution 248
depending on the Ce content, we have taken into account the possible occurrence of different 249
cerium populations. Figure 4 shows the excitation spectra of samples 4 and 32 (black solid 250
lines), and the three Gaussian functions used for signal deconvolution (dotted lines). Emission 251
spectra have been collected for different excitation wavelengths (vertical arrows) for both 252
samples. When the excitation increases from 280 to 335 nm (~ 35700 to ~ 29900 cm-1,
253
respectively) the emission of sample 32 barely shifts (~ 620 cm-1), and the two Emission bands
254
have a very similar shape. Therefore, it is reasonable to consider that we are exciting the same 255
electronic level. On the contrary, in the Ce-poor glass (sample 4) the Em maximum drastically 256
shifts (up to ~3900 cm-1) for the same excitation wavelengths reported above. Furthermore,
257
besides the change of the Em maximum depending on the excitation wavelength, there is also 258
a variation of band symmetry (Figure 4). In the case of crystalline materials, it has been reported 259
that the distortion of Ce3+ sites affects the crystal field splitting of the 5d configuration, and that
260
the occurrence of vacancies might contribute in changing Ce charge distribution. Consequently, 261
both would lead to red shift emission and changes in band symmetry [33–35]. In case of 262
amorphous materials, stronger crystal field splitting would lower the energy level of the 5d 263
configuration. Moreover, the increase of bond covalency character as well might affect the 5d 264
orbital. Hence, both covalency and crystal field increases induce a red shift. Following these 265
considerations, we might expect that the different emission signals of sample 4 derive from the 266
distribution of Ce in different sites, and in turn, to the different chemical environments 267
surrounding Ce3+ ions (i.e. <Ce-O> distances and bond covalency). In particular, we could
268
consider that the shorter wavelength emitting site is less covalent in nature, whereas the longer 269
wavelength emitting site is less ionic. The increase of Ce content induces a red shift of the 270
excitation because the longer wavelength emitting site becomes predominant. 271
Because of the very low doping level of Ce in sample 4, it is required to consider the 272
combination of other effects, such as the occurrence of i) trapped hole centers-related 273
transitions, with Ce3++ ions having different energy states, and ii) the presence of part of the
274
Ce3+ ions localized around point defects. The latter hypothesis might explain why the observed
275
photoluminescence signals are so different. 276
9 277
Figure 4: (a) Normalized excitation spectra for samples 4 and 32 (black solid lines) and Gaussian bands 278
used for signal deconvolution (dotted lines). The Emission spectra (colored solid lines) were collected at 279
different excitation wavelengths marked by the vertical arrows. 280
281
The Raman spectra of silicate glasses can be divided in different major regions, and we 282
will consider two of them: the high and the low-frequency regions. The low-wavenumber region 283
from ~ 350 to 650 cm-1, gives information on the T-O-T rocking, bending mode and ring
284
distributions (see [36] and references therein). The high-wavenumber portion extending from 285
~ 860 to 1300 cm-1 (also referred as Q-range) contains stretching motions of tetrahedral cations
286
T (e.g. T = Si4+, Al3+) [36]. The short-range order of silicate glasses can be described through
287
the abundance of the Qn species, where n is the number of bridging oxygen atoms (BO) and Q 288
represents the four-fold coordinated cation (i.e. fully polymerized = Q4). A fully polymerized 289
SiO2 glass network has only weak bands in the frequency range ~ 950 - 1300 cm-1, whereas it
290
has a strong asymmetric band in the low-frequency region (350 - 500 cm-1). Moreover, highly
291
polymerized glasses have two well-pronounced peaks, usually referred to as defect lines, D1 (~ 292
490 cm-1) and D2 (~ 600 cm-1), associated, respectively, with the breathing modes of (SiO)4-
293
and (SiO)3-rings [37,38]. In general, by increasing the number of non-bridging oxygen (NBO),
294
the main band in the low-frequency region decreases in intensity and shifts to higher 295
wavenumbers, whilst the Q-range shifts toward lower frequencies and increases its intensity 296
because other bands (related to other Q species, such as Q3, Q2) appear in the 850-1300 cm-1
297
portion ([36] and references therein). SiO2 glass vibrations in the Q-range can be deconvoluted
298
with three main contributions that represent different types of stretching vibration of the SiO4
299
tetrahedra [39–42], and here we use the same terminology adopted in our previous work (see 300
[14] and reference therein). Indeed, to describe the vibration of the SiO4 tetrahedra in silica
301
glass we use Q4,I, and Q4,II species (at frequencies higher than 1100 cm-1), and the T2 stretching
302
mode at ~1050 cm-1 (the latter related to two oxygen atoms that move closer to the central T
303
atom, while the other two oxygens of TO4 tetrahedra move away) [43].
304 305
The cladding portion of all samples is nearly completely composed of SiO2 (Al2O3
306
impurities ≤ 0.13 mol%), thus the Raman spectrum of a pure SiO2 glass (QSIL®), collected
307
with the same experimental conditions, has been used as reference (dashed line in Figure 5A). 308
In the cladding portions analyzed, Raman spectra show some small variations compared to the 309
reference SiO2, mainly on the intensity of the defect lines, and on the relative intensity of the
310
bands in the Q-range. In SiO2-rich amorphous materials having less than 4 mol% Al2O3, NMR
10 data indicates the occurrence of Al3+ mostly 4-fold coordinated ([4]Al3+) with small
312
contributions from distorted [6]Al3+ (6-fold coordinated) [44]. Al, as network former, mainly
313
enters the more distorted Q4,II sites causing an intensity increase and a small negative shift of 314
this band [14,45]. These considerations fit well with the signal collected in the cladding, and 315
thus, we can relate the small variations observed among the different claddings to the inclusion 316
of Al3+ in the tetrahedral sites, which induces different average <T-O> distances and small
317
changes in the ring statistic (insets in Figure 5A). The mathematical average of the seven 318
different claddings (hereafter called 𝐶𝑙𝑎𝑑%%%%%%) was done in order to have a reference spectrum that 319
takes into account the chemical variability found in the outer cladding. The 𝐶𝑙𝑎𝑑%%%%%% spectrum is 320
reported in Figure 5B (solid black line) and compared to the spectra collected in the core areas. 321
In the core portions analyzed, the (Ce, Al) codoping induces much more visible changes 322
in the glass network, both in the short-and medium-range order. At low frequencies, the main 323
T-O-T band and the defect bands decrease in intensity and the latter become broader, compared 324
to SiO2 and 𝐶𝑙𝑎𝑑%%%%%% (Figure 5B). Moreover, there is a small shift (~ 2-3 cm-1) toward higher
325
frequencies of the maximum of the low-frequency region. These changes indicate a lower 326
quantity of smaller (SiO)4- and (SiO)3-rings with the increase of the doping, and the shift to
327
higher wavenumbers of the Main Band suggests a small decrease of the ring intertetrahedral 328
angles T-O-T. The strongest variations observed in the cores are in the 860 - 1300 cm-1
329
frequency region, where new contributions systematically rises (between ~ 860 and 1050 cm-1)
330
by increasing the CeO2 content (inset Figure 5B).
331 332
Figure 5: Raman spectra collected in the cladding (A), and in the codoped core (B) of the different disks. 333
A) The Raman spectrum of pure SiO2 glass (dashed black line) is compared to signals from the cladding
334
portions .B) An average spectra of all claddings (𝑪𝒍𝒂𝒅%%%%%%%, black solid line) is reported as reference and 335
compared to the core signals. Insets provide a magnification of the D2 defect line, and of the Q-range.
336 337
In order to evaluate the modifications occurring in the glass structure upon incorporation 338
of Ce and Al oxides, and the influence of the different Ce contents, we studied in detail the 339
high-frequency region by means of two approaches. The first one is a subtractive method where 340
the signal of the cladding has been subtracted to the signal collected in the core, and the 341
difference spectrum has been deconvoluted by mathematical functions. The second approach 342
involves the more classical deconvolution of the whole high-frequency portion. 343
In order to separate the contributions to the Raman spectra due only to the Al/Ce 344
codoping, the signal collected into the cladding has been subtracted to the one collected in the 345
core region, for each sample. The resulting difference spectra highlights the distinct portions 346
11 where the vibrational bands are affected by the incorporation of Al2O3 and CeO2 (Figure 6A).
347
In the low-frequency region, the relative intensity of the defect lines changes depending on the 348
amount of codoping. Furthermore, the shift of the main band at ~ 434 cm-1 is evident (Figure
349
6B). In the high-frequency portion, the contribution in the Q-range, 860-1050 cm-1, strongly
350
increases by increasing the Ce and Al content (Figure 6C). The modifications observed in the 351
asymmetric band centred at ~ 800 cm-1 will not be discussed here, preferring to focus on
352
changes in the Q-range. Figure 6D reports an example of the subtractive method used here. The 353
cladding and core spectra collected for sample 32 are shown in Figure 6D, along with the 354
difference spectrum obtained (symbols). The latter has been fitted, and four contributions can 355
be distinguished for high codoping: two well defined bands that are related to the two main 356
peaks (named P2 and P3), and two smaller side bands associated with the shoulder observed for
357
each of the main peaks (P1 and P4, respectively at lower and higher frequencies in Figure 6D).
358
The difference spectrum of sample 4 presents a single contribution centred at 1120.2(2) cm-1
359
(Figure 6E). The difference spectrum is well fit with a Lorentzian function with a full-width 360
half-maximum FWHM = 45.5(3) cm-1 (the use of a Gaussian for this sample would imply the
361
use of other two side bands, and we prefer to use the minimum number of bands to achieve a 362
satisfactory fit). The difference spectrum obtained between pure SiO2 and a reference glass
363
having 98.8 mol% SiO2 and 1.2mol% Al2O3 indicates a residual contribution with a nearly
364
identical shape and position (1120.9(10) cm-1; unpublished data). Since sample 4 core has 1.5
365
mol% of Al2O3, and only 0.05mol% of CeO2 we can affirm with confidence that this
366
contribution is only due to the Al3+ cations entering the tetrahedral sites. By increasing the Ce
367
content to ~1 mol%, another main contribution appears, which represents 50% of the whole 368
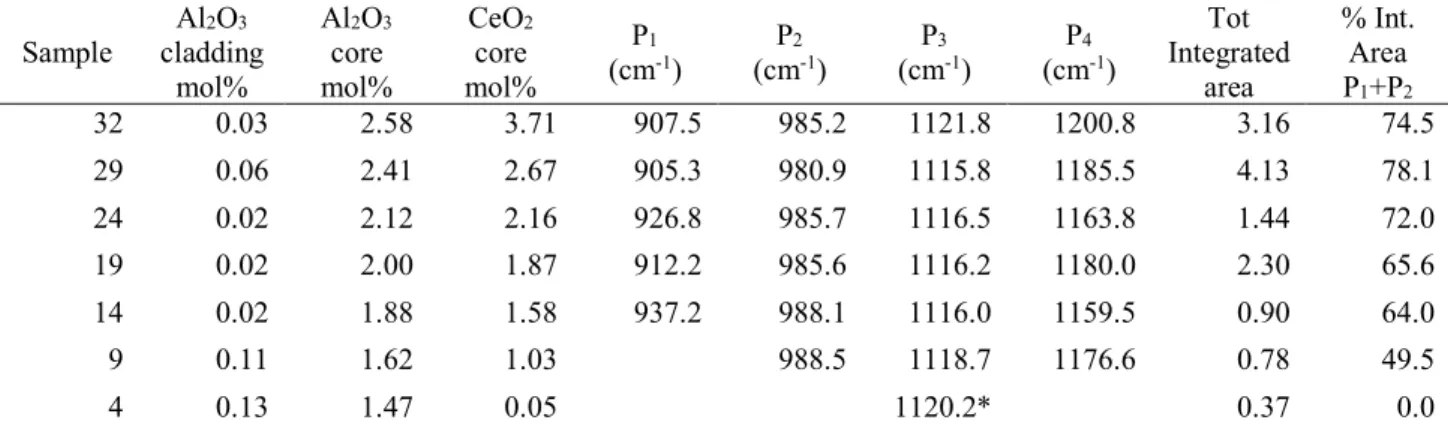
area. Indeed, sample 9 difference spectrum requires two Gaussian bands, named P2 and P3,
369
respectively centered at 988.5(2) cm-1 and 1118.7(4) cm-1 to fit the two dominant contributions
370
(see Figure 6E). Additionally, a small shoulder is visible in the high-frequency portion (P4
371
band). Further addition of CeO2 induces the increase of the P2 band, and the appearance of the
372
shoulder at lower frequencies (P1). Thus, these two bands (P1+P2) contribute to more than 60%
373
of the total difference spectra (see Table 3). 374
The subtractive method here used allows underlining that the main variations in the Q-375
range are related to the appearance of the P1 and P2 contributions (respectively at ~ 917 and ~
376
985 cm-1) and their rise by increasing the CeO
2 and Al2O3 content. Based on this data analysis,
377
we propose the following assignment for the two main contributions: P3 to Al-O stretching
378
modes and P2 to the presence of cerium ions.
379 380
12
Figure 6: A-C) Raman spectra collected in the core region and the subtracted spectra obtained by the 381
difference between core and cladding of the same sample. Magnifications of the defect lines and of the Q-382
range are reported, respectively, in panel B and C. In A, a Cladding spectrum is reported as reference in 383
black. D) Example of the subtractive method used. The Raman signal of each cladding has been 384
subtracted to the one collected into the core region. The difference spectrum obtained has been 385
deconvoluted with mathematical functions, and based on their positions we use the labels P1, P2, P3 and P4.
386
E) Stacked difference spectra and position of the mathematical functions for some of the samples. 387
388
The second method used to study the variations occurring in the Raman signals involves 389
the more classical fit of the whole high-frequency region. The deconvolution has been done for 390
all samples, both in the cladding and codoped core portions. As a reference, the analysis of the 391
Raman signals of the SiO2 glass and of the average cladding 𝐶𝑙𝑎𝑑%%%%%% was done as well in the range
392
950-1300 cm-1. As reported above, pure SiO
2 glass weak bands in the Q-range can be
393
deconvoluted with three main contributions related to Q species with four bridging oxygens. In 394
the cladding portions, these three bands are assigned to Q4,I, Q4,II and T2 stretching modes (see 395
Figure 7). A small negative frequency shifts of the Q4,II species is probably due to Al3+ cations
396
entering the tetrahedral sites. The results of the fit of SiO2 and of the average cladding (𝐶𝑙𝑎𝑑%%%%%%)
397
Q-range Raman signals are reported in Table 4. In the codoped core, besides these three main 398
contributions, other two bands appear in the lower part of the Q envelope (< 1050 cm-1), and
399
increase in intensity by increasing the (Ce, Al) doping (see Figure 7). These two contributions 400
below 1050 cm-1 are not related to electronic transitions (luminescence) because they have the
401
same intensities and Raman shift position even when collected with a different excitation line. 402
In order to give stable fits, the full-width half maximum (FWHM) of the Gaussian functions 403
should be constrained below 60 cm-1[46], thus, a further contribution between 1090 - 1110 cm
-404
1 should be added. This supplementary band would take into account the occurrence of Q3 405
species possibly due to both Ce ions and higher coordinated Al3+ species acting as network
406
modifiers. However, due to pure fit stability, we decided to avoid including this further 407
contribution. Therefore, only five Gaussian functions were used to deconvoluting core Raman 408
spectra: the three related to TO4 tetrahedra (hereafter called G1 to G3) and two additional
409
contributions at lower frequencies (hereafter called G4 and G5).
410
By increasing the codoping, the bands G1 to G3 show a minor increased intensity
411
compared to the cladding, and a shift of the component at ~ 1150 cm-1 (G
2). On the other hand,
412
the two additional bands at lower frequencies (G4, G5) strongly increase by increasing the
413
cerium content. Thus, particular attention will be given to the frequency and intensity evolution 414
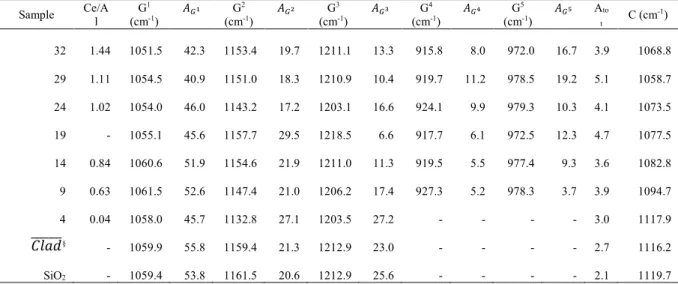
of the bands at ~ 925 cm-1 (G4) and ~ 980 cm-1(G5). This increase in G4 and G5 intensities leads
415
the whole Q envelope to move toward lower frequencies. To represent this tendency we used 416
the center of mass C (or centroid) of the analyzed range, calculated as (see Table 4): 417
13 418
𝐶 = (𝐺. ∗ 𝐴12) + (𝐺5∗ 𝐴16) + (𝐺7∗ 𝐴18) + (𝐺9∗ 𝐴1:) + (𝐺;∗ 𝐴1<) 𝐴=>=
419
(where Atot is the total area of the Q-range; see Table 4) resulting in ~ -60 cm-1 shift of the
high-420
frequency band by increasing the Ce, Al codoping from 1.5 to 6.3 mol%. As reference, the 421
center of mass of pure SiO2 has been estimated at ~ 1119.7 cm-1, whereas the one related to the
422
average cladding signal is ~ 1116 cm-1 (see Table 4). Sample 32 core has a very high amount
423
of CeO2 (~3.7 mol%) and does not follow the trend observed for the other codoped cores. A
424
possible explanation takes account of the clustering taking place because of the high Ce content. 425
This deconvolution method, as the subtractive one, highlights that the higher doping 426
induces strong changes in the glass topology, and the rise of the bands in the lower frequency 427
of the Q-range is associated to the higher content of Ce ions. Despite the increase of codopant 428
amount in the core (and in turn, the decrease of silica), it seems that there is not a strong 429
depolymerization since the Raman Main Band was only slightly affected. A decrease of Q4 430
species is anyway restricted since Al3+ ions tend to enter preferentially the Q4,II site. The main 431
role of cerium ions is then uncertain. It could be charge-compensator of Al3+ ions, and/or
432
directly connected to the tetrahedral network. Then, the contributions G4 and G5 could be
433
associated to a weakening of the stretching of the bond Si-O when Ce is nearby, by analogy of 434
recent assignments done by Nesbitt et al. [47]. 435
436
Figure 7: Details of the Raman spectra and deconvolution of the high-frequency regions of some of the 437
samples investigated. In the codoped core, for CeO2 contents ≥ 1 mol%, two additional vibrations rise,
438
respectively at ~ 916 cm-1 and ~ 970 cm-1. The chemical compositions of both cladding and core are
439
reported for sake of clarity (as mol% oxide). 440
441
In order to assess and link structural changes to macroscopic properties in the codoped 442
cores, we correlated the variations observed in the glass connectivity to the cerium 443
photoluminescence properties, by taking into account the center of mass and the integrated areas 444
of the deconvoluted bands in the Q-range, and the frequency position of Excitation and 445
Emission signals. 446
By changing the codopant amount in the core portions, it is possible to observe a 447
common trend for all the parameters taken into account, related both to the glass structure and 448
to the optical properties. The decrease of the Q-range center of mass is very well correlated 449
with the red shift of both Excitation and Emission maxima. Indeed, by increasing the codoping, 450
the center of mass of the Q-range drop, similar to the drop observed in the photoluminescence 451
maxima (Figure 8A). Furthermore, we can observe that sample 4 has the highest value of the 452
14
Q-range center of mass, which in turn corresponds to the highest values of Ex and Em. Sample
453
4 presents the most different photoluminescence properties and its C value is very close to the 454
one calculated for the average cladding. A plausible explanation could be that a very low doping 455
level of Ce3+ ions induces these species to associate not to the aluminosilicate network but to
456
dangling point defects. Instead, when in higher amounts Ce ions tend to associate to the 457
aluminosilicate network before reaching the limit of cerium clusters formation. This could be 458
appreciated by looking at the increase of the integrated area of the bands in the lower portion 459
of the Q-range (Figure 8B), and especially to the practically linear correlation between the sum 460
of the integrated area of the P1 and P2 bands and the frequency of the excitation maxima
461
(Adjusted Coefficient of Determination R2 = 99.92):
462
y(x) = (-34.5±2.6)*x + 32772±202 463
This positive relationship means that the change of <Ce-O> species covalency character 464
influences, in the same way, both the photoluminescence behavior of the core, and the 465
connectivity of the amorphous network. 466
The correlation observed between glass short-range order and optical properties 467
endorses that Ce species are strongly connected to the glass network, and the small changes in 468
the medium-range order supports the conclusion that Ce3+ ions partially act as
charge-469
compensator to neighboring Al polyhedral (AlO4-, AlO53-). Consequently, ⟨Ce-O⟩ connectivity
470
changes depending on Al coordination/content, in agreement with previous experimental and 471
molecular dynamic studies [14,48] and references therein. 472
473
Figure 8: Correlations between parameters from Raman data analysis and Photoluminescence studies of 474
the codoped cores. A) the Raman center of mass C vs. the Emission (Em) and Excitation (Ex) maxima. B) 475
the frequency Excitation maxima are related to the sum of the integrated areas of the contributions P1 and
476
P2, obtainedfollowing the subtractive method. The latter shows a nearly perfect linear correlation
477 (Adjusted R2 = 99.92). 478 479
Conclusions
480We investigated a series of silica preforms having different codopant contents in the 481
core, and variations of the CeO2/Al2O3 molar ratios from 0.04 to 1.4. Raman spectroscopy has
482
been used to evaluate changes in glass connectivity and modifications in the short- and medium-483
range order both in the cladding and in the core portions. Photoluminescence studies of the 484
codoped cores allowed evaluating the evolution of the glass optical properties. 485
This work allowed determining a correlation between glass topology and optical 486
properties and to better understand the short-range order variations depending on the silica fiber 487
preform codopant ratios. In particular, we observed that: 488
15 - by increasing the CeO2-Al2O3 content, there is a red shift of both excitation and emission
489
spectra, and at the same time, a clear shift toward lower frequencies of the Raman Q-490
range; 491
- very low doping level of Ce3+ ions (0.05 mol%) probably induces these species to
492
associate not to the tetrahedra network but to point defects; 493
- when in higher amounts Ce ions behave differently, and the positive correlation between 494
glass short-range order and optical properties endorses that Ce species are strongly 495
associated to the aluminosilicate glass network; 496
- the change of <Ce-O> bonding character influences, in the same way, both the 497
photoluminescence behavior of the core, and the connectivity of the amorphous network. 498
499
The combined use of photoluminescence and Raman spectroscopy enabled 500
discriminating the distinct influence of the two codopants depending on the CeO2-Al2O3
501
content. These results will allow to better design the codopant ratios needed to avoid 502
photodarkening of silica fiber, but also to shed some light on the mechanisms involved in the 503
attenuation of this unwanted optical degradation. Besides application in optical fibers, the 504
understanding of the relationship between macro and micro-scale properties is a necessary step 505
in the way of developing material with ad hoc properties. 506
507
Acknowledgment: 508
SEM-EDS analyses were supported by IPGP multidisciplinary program PARI, and by Region 509
île-de-France SESAME Grant no. 12015908. 510
16
References
512
[1] J. Ballato, H. Ebendorff-Heidepriem, J. Zhao, L. Petit, J. Troles, Glass and Process 513
Development for the Next Generation of Optical Fibers: A Review, Fibers. 5 (2017) 514
11. https://doi.org/10.3390/fib5010011. 515
[2] P.D. Dragic, M. Cavillon, J. Ballato, Materials for optical fiber lasers: A review, Appl. 516
Phys. Rev. 5 (2018). https://doi.org/10.1063/1.5048410. 517
[3] D.L. Griscom, Nature Of Defects And Defect Generation In Optical Glasses, in: 518
Radiat. Eff. Opt. Mater., SPIE, 1985: p. 38. https://doi.org/10.1117/12.975358. 519
[4] S. Girard, A. Alessi, N. Richard, L. Martin-Samos, V. De Michele, L. Giacomazzi, S. 520
Agnello, D. Di Francesca, A. Morana, B. Winkler, I. Reghioua, P. Paillet, M. Cannas, 521
T. Robin, A. Boukenter, Y. Ouerdane, Overview of radiation induced point defects in 522
silica-based optical fibers, Rev. Phys. 4 (2019) 100032. 523
https://doi.org/10.1016/j.revip.2019.100032. 524
[5] D.L. Griscom, A Minireview of the Natures of Radiation-Induced Point Defects in 525
Pure and Doped Silica Glasses and Their Visible/Near-IR Absorption Bands, with 526
Emphasis on Self-Trapped Holes and How They Can Be Controlled, Phys. Res. Int. 527
2013 (2013) 379041. https://doi.org/10.1155/2013/379041. 528
[6] K. Arai, H. Namikawa, K. Kumata, T. Honda, Y. Ishii, T. Handa, Aluminum or 529
phosphorus co-doping effects on the fluorescence and structural properties of 530
neodymium-doped silica glass, J. Appl. Phys. 59 (1986) 3430–3436. 531
https://doi.org/10.1063/1.336810. 532
[7] Y. Ishii, K. Arai, H. Namikawa, M. Tanaka, A. Negishi, T. Handa, Preparation of 533
Cerium-Activated Silica Glasses: Phosphorus and Aluminum Codoping Effects on 534
Absorption and Fluorescence Properties, J. Am. Ceram. Soc. 70 (1987) 72–77. 535
[8] C. Shao, W. Xu, N. Ollier, M. Guzik, G. Boulon, Suppression mechanism of radiation-536
induced darkening by Ce doping in Al/Yb/Ce-doped silica glasses: Evidence from 537
optical spectroscopy, EPR and XPS analyses, J. Appl. Phys. 120 (2016) 153101. 538
https://doi.org/10.1063/1.4964878. 539
[9] J.-F. Lupi, M. Vermillac, W. Blanc, F. Mady, M. Benabdesselam, B. Dussardier, D.R. 540
Neuville, Steady photodarkening of thulium alumino-silicate fibers pumped at 107 µm: 541
quantitative effect of lanthanum, cerium, and thulium, Opt. Lett. 41 (2016) 2771. 542
https://doi.org/10.1364/OL.41.002771. 543
[10] M. Engholm, P. Jelger, F. Laurell, L. Norin, Improved photodarkening resistivity in 544
ytterbium-doped fiber lasers by cerium codoping., Opt. Lett. 34 (2009) 1285–1287. 545
https://doi.org/10.1364/OL.34.001285. 546
[11] S. Jetschke, S. Unger, A. Schwuchow, M. Leich, J. Kirchhof, Efficient Yb laser fibers 547
with low photodarkening by optimization of the core composition, Opt. Express. 16 548
(2008) 15540. https://doi.org/10.1364/OE.16.015540. 549
[12] S. Jetschke, S. Unger, M. Leich, J. Kirchhof, Photodarkening kinetics as a function of 550
Yb concentration and the role of Al codoping, Appl. Opt. 51 (2012) 7758. 551
https://doi.org/10.1364/ao.51.007758. 552
[13] S. Sen, J.F. Stebbins, Structural role of Nd3+ and Al3+ cations in SiO2 glass: a 29Si 553
MAS-NMR spin-lattice relaxation, 27Al NMR and EPR study, J. Non. Cryst. Solids. 554
188 (1995) 54–62. https://doi.org/10.1016/0022-3093(95)00099-2. 555
[14] M.R. Cicconi, D.R. Neuville, W. Blanc, J.-F. Lupi, M. Vermillac, D. de Ligny, 556
Cerium/aluminum correlation in aluminosilicate glasses and optical silica fiber 557
preforms, J. Non. Cryst. Solids. 475 (2017) 85–95. 558
https://doi.org/10.1016/j.jnoncrysol.2017.08.035. 559
[15] N. Chiodini, G. Brambilla, A. Vedda, D. Di Martino, M. Fasoli, A. Lauria, M. Redaelli, 560
E. Rosetta, SiO2-based scintillating fibers for x-ray detection, in: Hard X-Ray Gamma-561
Ray Detect. Phys. V, 2004: pp. 298–305. 562
17 [16] M. Bettinelli, G. Ingletto, P. Polato, G. Pozza, G. Zanella, Optical spectroscopy of 563
Ce3+, Tb3+ and Eu3+ in new scintillating glasses, Phys. Chem. Glas. 37 (1996) 4–8. 564
[17] L. Dong, P.J. Wells, D.P. Hand, D.N. Payne, Photosensitivity in Ce^3+-doped optical 565
fibers, J. Opt. Soc. Am. B. 10 (1993) 89. https://doi.org/10.1364/josab.10.000089. 566
[18] W.W. Morey, G.A. Ball, G. Meltz, Photoinduced Bragg Gratings in Optical Fibers, 567
Opt. Photonics News. 5 (1994) 8. https://doi.org/10.1364/OPN.5.2.000008. 568
[19] G. Blasse, a. Bril, Investigation of Some Ce3+-Activated Phosphors, J. Chem. Phys. 569
47 (1967) 5139–5145. https://doi.org/doi:10.1063/1.1701771. 570
[20] J.-F. Lupi, M. Vermillac, S. Trzesien, M. Ude, W. Blanc, B. Dussardier, Gradual-Time 571
Solution Doping for the Fabrication of Longitudinally Varying Optical Fibres, J. Light. 572
Technol. Vol. 36, Issue 10, Pp. 1786-1791. 36 (2018) 1786–1791. 573
[21] G.K. Das Mohapatra, A spectroscopic study of cerium in lithium–alumino–borate 574
glass, Mater. Lett. 35 (1998) 120–125. https://doi.org/10.1016/S0167-577X(97)00232-575
2. 576
[22] R. Reisfeld, H. Minti, a. Patra, D. Ganguli, M. Gaft, Spectroscopic properties of 577
cerium in glasses and their comparison with crystals, Spectrochim. Acta Part A Mol. 578
Biomol. Spectrosc. 54 (1998) 2143–2150. https://doi.org/10.1016/S1386-579
1425(98)00131-0. 580
[23] M. Fasoli, A. Vedda, A. Lauria, F. Moretti, E. Rizzelli, N. Chiodini, F. Meinardi, M. 581
Nikl, Effect of reducing sintering atmosphere on Ce-doped sol-gel silica glasses, J. 582
Non. Cryst. Solids. 355 (2009) 1140–1144. 583
https://doi.org/10.1016/j.jnoncrysol.2009.01.043. 584
[24] A. Paul, M. Mulholland, M.S. Zaman, Ultraviolet absorption of cerium(III) and 585
cerium(IV) in some simple glasses, J. Mater. Sci. 11 (1976) 2082–2086. 586
https://doi.org/10.1007/PL00020336. 587
[25] A. Herrmann, H.A. Othman, A.A. Assadi, M. Tiegel, S. Kuhn, C. Rüssel, 588
Spectroscopic properties of cerium-doped aluminosilicate glasses, Opt. Mater. Express. 589
5 (2015) 720. https://doi.org/10.1364/OME.5.000720. 590
[26] R. Reisfeld, A. Patra, G. Panczer, M. Gaft, Spectroscopic properties of cerium in sol-591
gel glasses, Opt. Mater. (Amst). 13 (1999) 81–88. https://doi.org/10.1016/S0925-592
3467(99)00015-4. 593
[27] M.L. Brandily-Anne, J. Lumeau, L. Glebova, L.B. Glebov, Specific absorption spectra 594
of cerium in multicomponent silicate glasses, in: J. Non. Cryst. Solids, 2010: pp. 2337– 595
2343. https://doi.org/10.1016/j.jnoncrysol.2010.02.020. 596
[28] H. Ebendorff-Heidepriem, D. Ehrt, Formation and UV absorption of cerium, europium 597
and terbium ions in different valencies in glasses, Opt. Mater. (Amst). 15 (2000) 7–25. 598
https://doi.org/10.1016/S0925-3467(00)00018-5. 599
[29] J.A. Duffy, G.O. Kyd, Ultraviolet absorption and fluorescence spectra of cerium and 600
the effect of glass composition, Phys. Chem. Glas. 37 (1996) 45–48. 601
[30] J. Bei, G. Qian, X. Liang, S. Yuan, Y. Yang, Optical properties of Ce 3+-doped oxide 602
glasses and correlations with optical basicity, Mater. Res. Bull. (2007). 603
[31] F.G.K. Baucke, J.A. Duffy, Redox reactions between cations of different polyvalent 604
elements in glass melts. An optical basicity study, Phys. Chem. Glas. 34 (1993) 158– 605
163. 606
[32] A. Paul, R.W. Douglas, Cerous-ceric equilibrium in binary alkali borate and alkali 607
silicate glasses, Phys. Chem. Glas. 6 (1965) 212–215. 608
[33] P. Dorenbos, 5d-level energies of Ce 3+ and the crystalline environment., Phys. Rev. 609
B. 62 (2000) 640–649. https://doi.org/10.1103/PhysRevB.62.15640. 610
[34] F. Wang, W. Wang, L. Zhang, J. Zheng, Y. Jin, J. Zhang, Luminescence properties and 611
its red shift of blue-emitting phosphor Na3YSi3O9 :Ce3+ for UV LED, RSC Adv. 7 612
(2017) 27422–27430. https://doi.org/10.1039/C7RA03813E. 613
18 [35] P. Dorenbos, Ce3+ 5d-centroid shift and vacuum referred 4f-electron binding energies 614
of all lanthanide impurities in 150 different compounds, J. Lumin. 135 (2013) 93–104. 615
https://doi.org/10.1016/j.jlumin.2012.09.034. 616
[36] D.R. Neuville, D. de Ligny, G.S. Henderson, Advances in Raman Spectroscopy 617
Applied to Earth and Material Sciences, 2014. https://doi.org/10.2138/rmg.2013.78.13. 618
[37] S.K. Sharma, J.F. Mammone, M.F. Nicol, Raman investigation of ring configurations 619
in vitreous silica, Nature. 292 (1981) 140–141. https://doi.org/10.1038/292140a0. 620
[38] A. Pasquarello, R. Car, Identification of Raman Defect Lines as Signatures of Ring 621
Structures in Vitreous Silica, Phys. Rev. Lett. 80 (1998) 5145–5147. 622
https://doi.org/10.1103/PhysRevLett.80.5145. 623
[39] P. McMillan, B. Piriou, The structures and vibrational spectra of crystals and glasses in 624
the silica-alumina system, J. Non. Cryst. Solids. 53 (1982) 279–298. 625
https://doi.org/10.1016/0022-3093(82)90086-2. 626
[40] P.F. McMillan, B.T. Poe, P.H. Gillet, B. Reynard, A study of SiO2 glass and 627
supercooled liquid to 1950 K via high-temperature Raman spectroscopy, Geochim. 628
Cosmochim. Acta. 58 (1994) 3653–3664. https://doi.org/10.1016/0016-629
7037(94)90156-2. 630
[41] F.L. Galeener, A.J. Leadbetter, M.W. Stringfellow, Comparison of the neutron, Raman, 631
and infrared vibrational spectra of vitreous SiO2, GeO2, and BeF2, Phys. Rev. B. 27 632
(1983) 1052–1078. https://doi.org/10.1103/PhysRevB.27.1052. 633
[42] F.A. Seifert, B.O. Mysen, D. Virgo, Three-dimensional network structure of quenched 634
melts (glass) in the systems SiO2--NaAlO2, SiO2--CaAl2O4 and SiO2--MgAl2O4, 635
Am. Mineral. 67 (1982) 696–717. 636
[43] A. Pasquarello, J. Sarnthein, R. Car, Dynamic structure factor of vitreous silica from 637
first principles: Comparison to neutron-inelastic-scattering experiments, Phys. Rev. B. 638
57 (1998) 14133–14140. https://doi.org/10.1103/PhysRevB.57.14133. 639
[44] S. Sen, R.E. Youngman, High-resolution multinuclear NMR structural study of binary 640
aluminosilicate and other related glasses, J. Phys. Chem. B. 108 (2004) 7557–7564. 641
[45] A. Navrotsky, K.L. Geisinger, G. V Gibbs, The Tetrahedral Framework in Glasses and 642
M e l t s - Inferences from Molecular Orbital Calculations and Implications for 643
Structure , Thermodynamics , and Physical Properties, Phys. Chem. (1985) 284–298. 644
[46] G.M. Bancroft, H.W. Nesbitt, G.S. Henderson, C. O’Shaughnessy, A.C. Withers, D.R. 645
Neuville, Lorentzian dominated lineshapes and linewidths for Raman symmetric 646
stretch peaks (800–1200 cm−1) in Qn (n = 1–3) species of alkali silicate glasses/melts, 647
J. Non. Cryst. Solids. 484 (2018) 72–83. 648
https://doi.org/10.1016/j.jnoncrysol.2018.01.018. 649
[47] H.W. Nesbitt, C. O’Shaughnessy, G.S. Henderson, G. Michael Bancroft, D.R. 650
Neuville, Factors affecting line shapes and intensities of Q3 and Q4 Raman bands of 651
Cs silicate glasses, Chem. Geol. 505 (2019) 1–11. 652
https://doi.org/10.1016/j.chemgeo.2018.12.009. 653
[48] J. Du, L. Kokou, J.L. Rygel, Y. Chen, C.G. Pantano, R. Woodman, J. Belcher, 654
Structure of cerium phosphate glasses: Molecular dynamics simulation, J. Am. Ceram. 655
Soc. 94 (2011) 2393–2401. https://doi.org/10.1111/j.1551-2916.2011.04514.x. 656
657 658
19 Tables
659 660
Table 1: Chemical composition (as mol%) of the codoped core measured by SEM-EDS. 661
Sample position/label SiO
2 Al2O3 CeO2 CeO2/Al2O3
32 93.7 2.6 3.71 1.44 29 94.9 2.4 2.67 1.11 24 95.7 2.1 2.16 1.02 19 96.1 2.0 1.87 0.93 14 96.5 1.9 1.58 0.84 9 97.4 1.6 1.03 0.63 4 98.5 1.5 0.05 0.04 662 663
Table 2: Results from the photoluminescence studies. Excitation (Ex) and emission (Em) maxima, and 664
parameters obtained from the deconvolution of the bands with Gaussian (G*) functions are reported. SS:
665
Stokes shifts. All values as cm−1. The Ce/Al molar ratios are reported for sake of clarity.
666
Sample Excitation Emission splitting ground
levels
SS Ce/Al
Ex max G1Ex G2Ex G3Ex Em max G1Em G2Em
32 30024 29498 32160 35095 24017 24741 22370 2371 6007 1.44 29 30077 29524 32166 34969 24452 25234 22838 2396 5625 1.11 24 30235 29751 32503 35268 24724 25420 23112 2309 5511 1.02 19 30512 29721 32235 35003 24643 25363 23064 2299 5869 0.93 14 30390 29638 32060 34724 24709 25395 23084 2311 5680 0.84 9 30816 29985 32380 34931 25526 26324 24142 2181 5290 0.63 4 32969 30958 32531 34931 27360 28164 25734 2381 5609 0.04 Sampl e EX G1 ex HWH M 1 ex area G2 ex HWH M 2 ex area G3 ex HWH M 3 ex area EM Em 2nd EM stoke s shift G1 em HWH M 1 G2 em HWH M 2 splittin g ground levels 667 668
Table 3: Results of the study of the difference Raman spectra reported in Figure 5E. Ce and Al oxides molar 669
contents are reported for sake of clarity. The position of each peak, the total integrated area of the difference 670
spectra, and the integrated area (as %) of the two contributions at lower frequencies (P1 + P2) are reported.
671 Sample Al2O3 cladding mol% Al2O3 core mol% CeO2 core mol% P1 (cm-1) P 2 (cm-1) P 3 (cm-1) P 4 (cm-1) Tot Integrated area % Int. Area P1+P2 32 0.03 2.58 3.71 907.5 985.2 1121.8 1200.8 3.16 74.5 29 0.06 2.41 2.67 905.3 980.9 1115.8 1185.5 4.13 78.1 24 0.02 2.12 2.16 926.8 985.7 1116.5 1163.8 1.44 72.0 19 0.02 2.00 1.87 912.2 985.6 1116.2 1180.0 2.30 65.6 14 0.02 1.88 1.58 937.2 988.1 1116.0 1159.5 0.90 64.0 9 0.11 1.62 1.03 988.5 1118.7 1176.6 0.78 49.5 4 0.13 1.47 0.05 1120.2* 0.37 0.0
* Single Lorentzian function. See text for details
672 673 674
20 Table 4: Results from the Raman signal deconvolution of the Ce/Al codoped cores, in the high-frequency 675
range. Each Gaussian function integrated area (AG), and total integrated area (Atot), along with the Center
676
of mass (C) of the whole Q-range are reported. Data obtained for the average Cladding (𝑪𝒍𝒂𝒅%%%%%%%) and
677
reference SiO2 are reported for comparison.
678 Sample Ce/Al (cmG1-1) 𝐴1 2 G2 (cm-1) 𝐴1 6 G3 (cm-1) 𝐴1 8 G4 (cm-1) 𝐴1 : G5 (cm-1) 𝐴1 < Ato t C (cm -1) 32 1.44 1051.5 42.3 1153.4 19.7 1211.1 13.3 915.8 8.0 972.0 16.7 3.9 1068.8 29 1.11 1054.5 40.9 1151.0 18.3 1210.9 10.4 919.7 11.2 978.5 19.2 5.1 1058.7 24 1.02 1054.0 46.0 1143.2 17.2 1203.1 16.6 924.1 9.9 979.3 10.3 4.1 1073.5 19 - 1055.1 45.6 1157.7 29.5 1218.5 6.6 917.7 6.1 972.5 12.3 4.7 1077.5 14 0.84 1060.6 51.9 1154.6 21.9 1211.0 11.3 919.5 5.5 977.4 9.3 3.6 1082.8 9 0.63 1061.5 52.6 1147.4 21.0 1206.2 17.4 927.3 5.2 978.3 3.7 3.9 1094.7 4 0.04 1058.0 45.7 1132.8 27.1 1203.5 27.2 - - - - 3.0 1117.9 𝐶𝑙𝑎𝑑 %%%%%%§ - 1059.9 55.8 1159.4 21.3 1212.9 23.0 - - - - 2.7 1116.2 SiO2 - 1059.4 53.8 1161.5 20.6 1212.9 25.6 - - - - 2.1 1119.7
§ Average signal of all cladding portions analyzed.
679 680 681
21 Figures Caption
682 683
Figure 1: Schematic drawing of the core portion of the SiO2 preform (silica cladding not
684
represented). Each bold number indicates the position where the disks have been cut (cm) 685
along the preform, which also represents samples labeling. Darker color indicates a higher 686
CeO2 content. On top is reported the CeO2/Al2O3 molar ratio in the codoped core.
687 688
Figure 2: Normalised excitation (Ex) and emission (Em) spectra for the different samples, and 689
deconvoluted Gaussian bands. By increasing the CeO2 molar content both Ex and Em bands
690
show a red shift, and an increase of Stokes shifts and of the ground level splitting. The 691
luminescence properties of sample 4 are different. See text for details. 692
693
Figure 3: Photoluminescence spectra collected in the codoped cores are compared to the most 694
intense signals observed in the cladding (grey solid lines). Black vertical arrows indicate the 695
Ex and Em wavelength used to collect the signals in the codoped core samples. For the 696
cladding, two emission bands are reported, one collected with an excitation wavelength (lEm)
697
of 300 nm (close to the Ex maximum of sample 4 – orange vertical arrow), and the other one 698
collected at 350 nm (grey vertical arrow). 699
700
Figure 4: (a) Normalized excitation spectra for samples 4 and 32 (black solid lines) and 701
Gaussian bands used for signal deconvolution (dotted lines). The Emission spectra (colored 702
solid lines) were collected at different excitation wavelengths marked by the vertical arrows. 703
704
Figure 5: Raman spectra collected in the cladding (A), and in the codoped core (B) of the 705
different disks. A) The Raman spectrum of pure SiO2 glass (dashed black line) is compared to
706
signals from the cladding portions .B) An average spectra of all claddings (𝐶𝑙𝑎𝑑%%%%%%, black solid 707
line) is reported as reference and compared to the core signals. Insets provide a magnification 708
of the D2 defect line, and of the Q-range. 709
710
Figure 6: A-C) Raman spectra collected in the core region and the subtracted spectra obtained 711
by the difference between core and cladding of the same sample. Magnifications of the defect 712
lines and of the Q-range are reported, respectively, in panel B and C. In A, a Cladding 713
spectrum is reported as reference in black. D) Example of the subtractive method used. The 714
Raman signal of each cladding has been subtracted to the one collected into the core region. 715
The difference spectrum obtained has been deconvoluted with mathematical functions, and 716
22 based on their positions we use the labels P1, P2, P3 and P4. E) Stacked difference spectra and
717
position of the mathematical functions for some of the samples. 718
719
Figure 7: Details of the Raman spectra and deconvolution of the high-frequency regions of 720
some of the samples investigated. In the codoped core, for CeO2 contents ≥ 1 mol%, two
721
additional vibrations rise, respectively at ~ 916 cm-1 and ~ 970 cm-1. The chemical
722
compositions of both cladding and core are reported for sake of clarity (as mol% oxide). 723
724
Figure 8: Correlations between parameters from Raman data analysis and Photoluminescence 725
studies of the codoped cores. A) the Raman center of mass C vs. the Emission (Em) and 726
Excitation (Ex) maxima. B) the frequency Excitation maxima are related to the sum of the 727
integrated areas of the contributions P1 and P2, obtainedfollowing the subtractive method. The
728
latter shows a nearly perfect linear correlation (Adjusted R2 = 99.92).
729 730 731 732
23 Figure 1
733
734 735
24 Figure 2
736
737 738
25 Figure 3
739
740 741
26 Figure 4
742
743 744
27 Figure 5
745
746 747
28 Figure 6
748
749 750
29 Figure 7
751
752 753
30 Figure 8
754