Publisher’s version / Version de l'éditeur:
Vous avez des questions? Nous pouvons vous aider. Pour communiquer directement avec un auteur, consultez la première page de la revue dans laquelle son article a été publié afin de trouver ses coordonnées. Si vous n’arrivez pas à les repérer, communiquez avec nous à PublicationsArchive-ArchivesPublications@nrc-cnrc.gc.ca.
Questions? Contact the NRC Publications Archive team at
PublicationsArchive-ArchivesPublications@nrc-cnrc.gc.ca. If you wish to email the authors directly, please see the first page of the publication for their contact information.
https://publications-cnrc.canada.ca/fra/droits
L’accès à ce site Web et l’utilisation de son contenu sont assujettis aux conditions présentées dans le site LISEZ CES CONDITIONS ATTENTIVEMENT AVANT D’UTILISER CE SITE WEB.
Inter-Noise 2007 [Proceedings], pp. 1-10, 2007-08-28
READ THESE TERMS AND CONDITIONS CAREFULLY BEFORE USING THIS WEBSITE. https://nrc-publications.canada.ca/eng/copyright
NRC Publications Archive Record / Notice des Archives des publications du CNRC :
https://nrc-publications.canada.ca/eng/view/object/?id=1e557b72-03c4-41c7-8200-b20e6ad08cf6 https://publications-cnrc.canada.ca/fra/voir/objet/?id=1e557b72-03c4-41c7-8200-b20e6ad08cf6
NRC Publications Archive
Archives des publications du CNRC
This publication could be one of several versions: author’s original, accepted manuscript or the publisher’s version. / La version de cette publication peut être l’une des suivantes : la version prépublication de l’auteur, la version acceptée du manuscrit ou la version de l’éditeur.
Access and use of this website and the material on it are subject to the Terms and Conditions set forth at
Measurement of flanking transmission through gypsum board walls with a modified SEA method
http://irc.nrc-cnrc.gc.ca
M e a s u r e m e n t o f f l a n k i n g t r a n s m i s s i o n
t h r o u g h g y p s u m b o a r d w a l l s w i t h a m o d i f i e d
S E A m e t h o d
N R C C - 4 9 6 9 3
S c h o e n w a l d , S . ; G e r r e t s e n , E . ; M a r t i n , H . ;
N i g h t i n g a l e , T .
A version of this document is published in / Une version de ce document se trouve dans: Inter-Noise 2007, Istanbul, Turkey, August 28-31, 2007, pp. 1-10
The material in this document is covered by the provisions of the Copyright Act, by Canadian laws, policies, regulations and international agreements. Such provisions serve to identify the information source and, in specific instances, to prohibit reproduction of materials without written permission. For more information visit http://laws.justice.gc.ca/en/showtdm/cs/C-42
Les renseignements dans ce document sont protégés par la Loi sur le droit d'auteur, par les lois, les politiques et les règlements du Canada et des accords internationaux. Ces dispositions permettent d'identifier la source de l'information et, dans certains cas, d'interdire la copie de documents sans permission écrite. Pour obtenir de plus amples renseignements : http://lois.justice.gc.ca/fr/showtdm/cs/C-42
INTER-NOISE 2007
28-31 AUGUST 2007 ISTANBUL, TURKEY
Measurement of flanking transmission through gypsum board
walls with a modified SEA method
Stefan Schoenwalda, Eddy Gerretsenb and Heiko Martinc
Eindhoven University of Technology Department of Architecture, Building and Planning
Den Dolech 2 5600 MB Eindhoven
The Netherlands Trevor Nightingaled
National Research Council Canada Institute for Research in Construction
1200 Montreal Road Ottawa, K1A 0R6
Canada ABSTRACT
This paper reports results from a research project that examines flanking sound transmission involving lightweight gypsum board walls using SEA. There are multiple transmission paths between any two gypsum board surfaces coupled by the junction. This is because the gypsum board leaves of a wall are often resiliently mounted to the studs, which forms a cavity and transverse velocity is not the same on either side of the wall. Often the assumption is made that power flow occurs along every path independently and the power balance method is applied to estimate the flanking transmission along every path independently. This approach overestimates the power flow along each of the single paths, since their magnitude is a complex function of the wall structure. However, two different approaches of application of the power balance method to estimate the total flanking sound transmission between two rooms from measured surface velocity level differences between two leaves are presented in this paper. One is a common approach that was already applied in earlier work to identify the relative importance of the different paths that might contribute to the overall transmission at the regarded junction. The velocity level difference is measured between the surfaces of the flanking walls that are exposed two the source and receiving room respectively where the first is excited structurally. In the second, the modified measurement approach, the surface velocity of the wall that is not exposed to the source room is measured instead to get some benefit in predicting the structural response of this leaf to airborne excitation in the source room. The results of the methods are compared and the advantages as well as the disadvantages of both methods are discussed.
1 INTRODUCTION
This paper reports results from a research project that examined methods to predict flanking sound transmission between adjacent rooms via double leaf framed gypsum board walls.
a
Email address: s.schoenwald@tue.nl
b
Email address: e.gerretsen@tue.nl
c
Email address: h.j.martin@tue.nl
d
An earlier paper [1] used SEA and a simple power balance approach to develop expressions for a first-order flanking path in terms of the resonant sound reduction index of the flanking surface in the source room and the velocity level difference between the source and receive surfaces for the assembly shown in Figure 1.
NE NW
SE SW
Figure 1: Junction, orientation of rooms (southeast (SE), southwest (SW), northwest (NW); northeast (NE)) and considered transmission paths
This paper expands on this work by showing that the first-order flanking expression can be written in terms of the sound reduction index of the double leaf wall in the source room, rather than the surface exposed to the sound. Results from this modified approach are compared to those presented earlier and measured results for the normalized flanking level difference obtained from ISO 10848.
This paper begins with an overview of SEA applied to flanking transmission where the coincidence frequency occurs in the frequency range of interest, and then an expression for the first-order flanking path is presented. Measured and predicted results compared. The paper concludes with a short discussion.
2 MODELLING FLANKING USING SEA
It is generally recognized that structure borne (flanking) transmission between coupled building elements (like walls and floors) is due to resonant transmission. Resonant transmission is the coupling of resonant modes of vibration on the source surface (which are damping controlled) to resonant motion on the receive surface (again, damping controlled). Thus, to accurately predict flanking transmission it is necessary to correctly estimate this resonant vibration. Unfortunately, resonant motion is not the only motion that a building surface can have – non-resonant motion is also possible. The relative magnitude of resonant to non-resonant transverse velocity depends on many factors, but is not limited to the method of excitation (airborne or impact), and construction details of the coupled building elements. Because non-resonant motion does not couple across a junction that couples two flanking surfaces, care must be taken when the velocity level difference between the two surfaces is used to describe the strength of structure borne transmission. Inclusion of a significant non-resonant component in the estimate of the source velocity level will significantly underestimate the coupling, while a non-resonant component in the receive velocity level will overestimate the coupling.
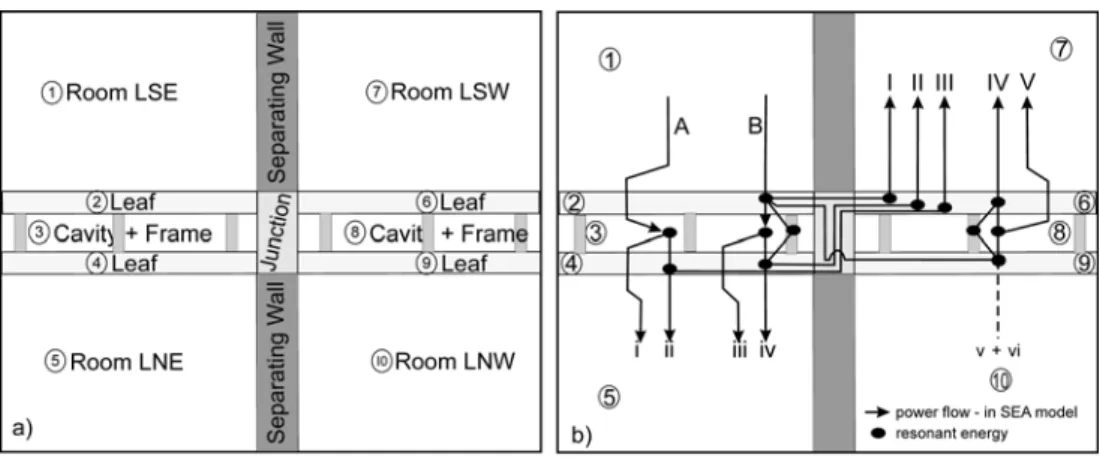
Additionally, for double leaf walls and floors there will be multiple paths between the source and receive surfaces. Figure 2 shows the SEA subsystems used in the model and the paths of power flow considered (subsystems are numbered). The different transmission paths
through the wall of the source room (separating rooms 1 and 5) are denoted with lower case roman numerals, while upper case roman numerals denote the flanking paths into room 7.
Figure 2: The applied SEA model, a) subsystems with denotations, b) power flow
There are five structure borne flanking paths from room 1 to room 7 and each one involves the junction between the two walls. The junction is seen as ‘black box’. Even though the leaves are not continuous across the junction or directly connected to each other it is assumed that power flow occurs only from one leaf to the other. Because this flanking is structure borne, only the resonant component of vibration energy (and hence velocity) has to be taken into account.
Since the coincidence frequency of gypsum board is usually high (typically above 2000 Hz), direct sound transmission through the wall (via Paths i to Path iv) may have both resonant and non-resonant components, and their relative importance will depend strongly on frequency. The black dots in Figure 2b mark the parts of the structure that are considered as resonant subsystems for the transmission paths. The transmission that occurs resonantly through the leaves, the cavity and also the frame are lumped together in Path iv and Path vi for simplicity. In the low frequency range additional direct transmission paths exist, such as the mass-spring-mass resonance of the leaves where the two move in phase with equal amplitude, and the wall can be considered as a single orthotropic plate.
Earlier work [1] showed that the flanking sound reduction index due to the sum of Path II and III is at least 15 dB higher than the one of Path I. Path IV and V were not presented in the earlier paper but their contribution can be assumed to be of the same order as the one of Path II and III since the junction (shown in Figure 1) is symmetric. Generally, all paths will contribute to flanking transmission, but for the assembly considered here flanking is governed by transmission through a single path – Path I.
2.1 Simplified Power Balance Method
In the earlier paper [1] it was assumed that the subsystems are weakly damped and both the modal densities and modal overlap are high. Further, power flow occurs independently along every path and only from subsystems of high energy to the one with low energy. The flanking sound reduction index R1267 of Path I, will be denoted as R17,I because of the source
and receiving subsystem, and can be evaluated as follows
6 , 6 , 2 2 6 2 2 , 13 , 17 10 lg 10 lg 10 lg S S v v R R S res res res I = + ⋅ + ⋅ σ + ⋅ σ (1)
Equation 1 expresses the flanking sound reduction index for the dominant wall-wall path in terms of the resonant sound reduction index of leaf 2, R13,res, the resonant radiation
efficiencies of the source and receive flanking surfaces, σ2,res and σ6,res, respectively, and the
area of the receive room flanking surface, S6, and the area of the partition that nominally
separates the two rooms, SS. The second term on the right hand side is the velocity level
difference between leaves 2 and 6 when leaf 2 is excited structurally and when power flow occurs only along Path I.
The power flow that occurs when subsystem 2 is excited structurally is shown in Figure 3. Since the junction is very complex and power flow occurs also through various other paths, assuming that the measured velocity level difference is due to transmission via a single path would lead to an underestimation of the actual path velocity level difference (and overestimation of the CLF). Fortunately, it has already been shown [1] that power flow through the other paths of the assembly in Figure 1 can be neglected and the assumption that power flow occurs predominantly along Path I is valid.
Figure 3: Power flow when subsystem 2 is excited structurally
2.2 Modified Power Balance Method
In this paper, an alternate method is applied where the velocity level difference between leaves 4 and 6 is measured when leaf 2 is structurally excited. This method was proposed by Gerretsen [2] and the expression for the flanking sound reduction index is obtained using the approach previously given except that velocity level difference between leaves 4 and 6 is used (instead of 2 and 6), and the sound reduction index R15,iv for resonant transmission is
used (instead of just leaf 2). Additionally, the resonant radiation efficiency of leaf 4 is used (rather than that of leaf 2). The result is R17,mod, and is given in equation 2.
6 , 6 , 4 2 6 2 , 4 , 15 mod , 17 10 lg 10 lg 10 lg S S v v R R S res res iv iv+ ⋅ + ⋅ + ⋅ = σ σ (2)
Equations (1) and 2 both describe transmission along Path I and differ only in the input data used. Above the coincidence frequency it is safe to assume that R15,iv can be
approximated by the measured sound reduction index of the wall, and the measured velocity level difference (between leaves 4 and 6) need not be corrected for the presence of non-resonant motion. Thus, above the coincidence frequency there is no need to manipulate the measured input data before predicting the flanking sound reduction index. Below the coincidence frequency there may be significant a non-resonant component to the motion and
the assumption may not hold so the resonant sound transmission loss R15,iv of Path iv must be
computed. It may also be necessary to remove the non-resonant component included in the estimate of the resonant velocity level difference.
Predictions of the resonant sound reduction index of the wall, R15,iv, can be obtained using
simple SEA relationships for the CLF between rooms and plates [3], and the measured velocity level difference between leaves 2 and 4 when leaf 2 is mechanically excited. The result is shown in equation (3), η2 the total loss factor, m2’ the mass per unit area and fc2 the
critical frequency of leaf 2, σi,res the resonant radiation efficiency of leaf i, and ρ0 and c0 the
density and speed of sound in air, respectively.
⎟ ⎟ ⎠ ⎞ ⎜ ⎜ ⎝ ⎛ ⋅ ⋅ ′ ⋅ ⋅ + ⎟ ⎟ ⎠ ⎞ ⎜ ⎜ ⎝ ⎛ ⋅ ⋅ ⋅ ⋅ ⋅ + ⎟ ⎟ ⎟ ⎠ ⎞ ⎜ ⎜ ⎜ ⎝ ⎛ ⋅ = res res c v v iv f m c f R iv 2 2, 4, 2 2 2 3 0 2 0 3 2 2 2 , 15 10 lg 163 . 0 2 . 35 lg 10 lg 10 , 4 2 σ σ η ρ π (3)
Figure 3 shows that despite structural excitation of leaf 2, which generates only resonant motion, the velocities of leaf 4 and leaf 6 will contain resonant components. These non-resonant components may be greater than the non-resonant component for frequencies far below coincidence. For the junction considered here, the non-resonant component of leaf 6 due to Path V can be neglected since it was shown earlier that the power flow along this path is considerably less important than Path I.
It is not possible to make a general statement regarding the non-resonant velocity component of leaf 4 so a correction is necessary. The non-resonant component of velocity of leaf 4 due to Path iii can be estimated using the relationship of equation 4.
3 35 23 2 2 2 , 4 2 , 4 0 0 η η η ω σ ρ ⋅ = ′ ⋅ ⋅ ⋅ v v m c nr iii (4)
On the left hand side of equation 4 the ratio of energy of leaf 2 and of room 5 due to transmission along Path iii is given in terms of the resonant velocity component 〈v2〉2 of
leaf 2, the non-resonant velocity component 〈v4,iii〉2 of leaf 4 and the non-resonant radiation
efficiency σ4,nr of leaf 4. On the right hand side it is expressed in terms of SEA coupling loss
factors and the total loss factor of the cavity η3 that are given in equation 5.
ω γ η π τ η ω σ ρ η 0 3 4 35 2 , 2 0 0 23 4 ; and c m c res = = ′ = (5)
It is assumed that the cavity is completely filled with fibrous absorbent, and η3 is a
function of the attenuation parameter γ for wave propagation in an absorbent material [4]. Delany and Bazley gave γ for wave propagation in fibrous blankets of different flow resistances [5]. 2 2 , 4 0 , 2 4 2 , 4 2 c v f v nr res iii ⋅ ⋅ ⋅ ⋅ ⋅ ⋅ = σ γ σ τ (6) After substituting the CLFs and TLFs and rearranging equation 4, the non-resonant velocity component 〈v4,iii〉2 can be expressed in terms of the resonant velocity of leaf 2, 〈v2〉2,
obtain estimates of the transmission coefficient, τ4, the non-resonant radiation efficiency σ4,nr
of leaf 4, and the resonant radiation efficiency σ2,res of leaf 2.
3 MEASUREMENTS
The measurements for the wall-wall flanking path between the room SW and room SE on the ground floor of the two-story IRC/NRC flanking test facility in Ottawa. The orientation of the rooms and designations are given in Figure 1 and Figure 2a. There are four rooms on each story.
3.1 Test Specimen
This paper examines flanking transmission through the load bearing walls separating the north and south rooms of Figure 1. All separating walls were single wood stud walls having studs (38x89 mm) spaced 406 mm on center. On one side of the frame, two layers of 16 mm gypsum board were directly attached to the studs. On the other side, one layer of 16 mm gypsum board was attached via resilient metal channels to the studs. The resilient metal channels were installed perpendicular to the studs with a spacing of 610 mm. The cavity was filled with 90 mm of mineral wool.
To isolate the flanking transmission paths the direct transmission path must be suppressed. Thus, the non-load bearing walls separating rooms on the East and West sides of the facility were shielded on both sides with 16 mm gypsum board on a layer of 90 mm encapsulated mineral wool. The shielding was not attached mechanically to the walls and joints between the boards taped with aluminum tape.
The ceilings of the rooms comprised of two layers of 16 mm gypsum board attached to resilient channels. The channels were mounted to the wood I-joists of the floor structure. The joists were discontinuous at the load bearing wall and the cavity above the gypsum board was filled with 150 mm mineral wool.
3.2 Surface Velocity
Velocity level difference estimates were obtained from using scanning laser vibrometer system (Polytec, PSV-300) and a 300 mm, or less, measurement grid. Setup of the vibrometer is very time consuming so the velocity was measured on one surface for all excitation positions and afterwards it was moved to the next room. Therefore, it was necessary to normalize velocities to the excitation power of the (airborne or structure borne) source and the velocity level differences calculated afterwards. For structure borne excitation, every leaf was excited with at a minimum of six different positions.
3.3 Flanking Transmission from Airborne Measures
The normalized flanking level difference Dn,f for the wall-wall paths between rooms 1 and
7 was characterized using the indirect method of ISO 10848 from data collected by an automated measurement system – a computer controlled the microphone positioning robot and four loudspeakers in each room. Sound pressure levels were an average of 6-positions and were measured simultaneously in every room. The reverberation time was measured at the same positions. The presented Dn,f are direction averaged and are restricted to the
frequency range of 125 to 3150 Hz because of background noise.
The sound pressure measurements were also used to determine the direct sound reduction index R15 of the flanking walls and the radiation efficiencies of the surfaces for different
types of excitation.
Shielding was applied to the surfaces of the walls in stages and the apparent sound reduction index measured for all possible shielding conditions so that it was possible to obtain an estimate of the sum of flanking paths not involving specimen under test (i.e., the sum of the paths involving the ceilings and shielded separating walls).
3.4 Flanking Transmission from Structure Borne Measures
The goal of this paper is to assess the accuracy of flanking transmission predicted using equations 1 and 2. To do this we will take the normalized flanking level difference Dn,f
calculated using airborne results (indirect method of ISO 10848) as the reference to which estimates predicted using equations 1 and 2 will be compared when Ss of the separating
element is taken to be 10 m² (Dn,f and Rij are identical when Ss of the separating element is
taken to be 10 m²).
When evaluating equation 2 one must recognize that most of the input data are not measured directly, but rather R15,iv and 〈v4,iv〉2 must be obtained after measured data are
modified to remove a non-resonant component namely 〈v4,iii〉2. The next section is devoted to
obtaining an estimate of 〈v4,iv〉2 from an estimate of 〈v4〉2 by subtracting an estimate of 〈v4,iv〉2
obtained from equation 6.
3.4.1 Non-resonant Velocity Component 〈v4,iii〉 2
of Leaf 4
Equation 6 is used to obtain an estimate of the non-resonant velocity component 〈v4,iii〉2 of
leaf 4 due to transmission through Path iii. .
To do this, the radiation efficiencies and transmission coefficients were computed for a simply supported gypsum board (density 720 m/kg³, Young’s modulus 2.25⋅109
N/m²) with the size 2.40 m by 0.40 m using the expressions of Leppington [6, 7]. This is the size of the sub-panels formed by the studs spaced 0.4m on center. In the expression of Leppington, the plate is assumed to lie in the plane of a rigid infinite baffle. Since leaf 2 radiates into a duct rather than into a half space, σ2,res must be doubled to take into account the limited wedge
angle of 90° [8]. The same plate size (0.4 x 2.4 m) was used for computing the transmission coefficient τ4 and the non-resonant radiation efficiency σ4,nr of leaf 4, because leaf 4 is
excited through the cavity and non-resonant transmission depends on the incident sound field. The attenuation parameter γ for sound propagation in the mineral wool bats of the cavity was predicted with the empirical expression of Delany and Bazley [5] using the measured flow resistivity of the mineral wool, 4800 Pa⋅s/m². Earlier research on predicting the sound reduction index of lightweight double walls (e.g. [9]) indicates good agreement with measured results is obtained only when the flow resistivity was assumed to be only 5% to 10% of the actual value. Using the actual flow resistivity causes a gross overestimation of the sound reduction index. Therefore 〈v4,iii〉2 was predicted for different values of the flow
resistivity ranging from 5% to 100% of that measured.
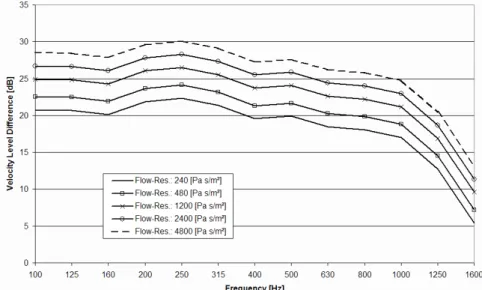
Figure 4 shows the difference between the measured velocity level Lv,4iii+iv and the
predicted non-resonant velocity level Lv,4iii due to transmission through Path iii for
frequencies below 2000 Hz, the coincidence frequency. The measured velocity of leaf 4 the mean was taken to be the average of the measured velocities of the surface LNE and surface LNW.
Even for the case of a very small flow resistivity, the measured velocity level Lv,4iii+iv
(sum of resonant and resonant components) is at least 20 dB greater than the non-resonant component. Below the coincidence frequency the difference decreases due to the increase of the resonant sound radiation into the cavity by leaf 2. However even in the frequency band right below coincidence, the measured velocity level Lv,4iii+iv is 5 dB higher in
comparison to the estimate of the non-resonant component obtained using minimal flow resistivity, and about 15 dB higher in comparison to the one obtained for the nominal measured flow resistivity. This indicates that the non-resonant velocity component due to transmission through Path iii is small and can be safely neglected. The biggest power flow between the structurally excited leaf 2 and room 5 involves resonant motion of all subsystems in this path, and is most likely via the studs. Thus, for the assembly considered in this paper
there is no need to correct the measured velocity level of leaf 4 for a non-resonant component.
Figure 4: Velocity level difference D4iii+iv,4iii of measured velocity level Lv,4iii+iv and predicted Lv,iii of leaf 4 for
different flow resistivities of absorbent in cavity
Moreover, the non-resonant velocity component of leaf 6 due to transmission through Path V is very small since a stronger resonant velocity component due to structural transmission between leaf 2 and leaf 6 will predominate. Therefore, as already indicated earlier, the resonant radiation efficiency σ6,res can be used in equation (3).
3.4.2 Comparison of Methods to Estimate the Normalized Flanking Level Difference Dn,f
The results for the normalized flanking level difference Dn,f between room SE and
room SW are shown in Figure 5 for the different methods. All results are direction averaged. The so-called indirect method, where Dn,f is determined from the sound pressure level
difference of the rooms is used as reference.
For the simplified method (equation (1)) the sound transmission loss R13,res and the
radiation efficiency σ2,res of leaf 2 are predicted using the procedure outlined. While, the
sound transmission loss R15,iv for the modified method was determined by equation 3. The
Figure 5: Normalized flanking level difference Dn,f between rooms SE and SW
The predicted Dn,f of Path I is shown for the simplified power balance method because
contributions from higher order Paths II to V is small and can be neglected [1]. The agreement between the predictions of both power balance methods is good in the frequency below 630 Hz, but both tend to overestimate Dn,f slightly in this frequency range in
comparison with the measured results obtained from the indirect measurement method of ISO 10848. Above 630 Hz, predictions from both power balance methods tend to underestimate
Dn,f.
Figure 6 shows the difference between the computed Dn,f obtained from the power
balance methods - simplified equation (1) and modified equation (2) - and the indirect measurement method. Both power balance methods show the same trend, the overestimation is about 3 dB at low frequencies and the underestimation at high frequencies is on average about 6 dB.
Figure 6: Difference between Dn,f of the power balance methods and of the indirect method
4 CONCLUSIONS
This paper has shown that there can be good agreement between estimates of the normalized flanking level difference (Dn,f) obtained using direct measurement of airborne levels (ISO10848) and estimates obtained from equations (1) and (2) that require input data to describe the structure borne response. Equations (1) and (2) were derived using an SEA framework and require significant effort to correct for non-resonant vibration components which do not couple across a flanking junction but are often present when making simple velocity level difference measures across a junction.
In general, both approaches provide an estimate of the normalized level difference consistent with the way in which the velocity level difference was measured. In other words, since only a single velocity level difference measurement was made, there is no information regarding the number of transmission paths between the source and receive surfaces or their relative importance – all that is obtained is the sum. To extract more information regarding the active paths and their relative importance it would be necessary to go back to the SEA formulation of the system and use the power injection method systematically applied to each subsystem in order to estimate all the coupling loss factors. Usually, this level of detail is not required and the approaches that are given by equations (1) and (2) is what matters for predicting the total power flow between two flanking surfaces. They however would
overestimate the transmission for any individual path. The magnitude depends on the relative importance of the others paths. This was discussed earlier [1].
Both approaches presented in this paper have advantages and disadvantages that depend on the regarded situation. Above the coincidence frequency the modified power balance method is preferable since the measured sound reduction index of the wall can be used directly as input data for R15,iv in equation 2. Below coincidence frequency R15,iv cannot
easily be obtained by measurement. It has to be predicted which is usually not feasible because of the many parameters that have to be taken into account and the their variation due to craftsmanship. In this paper R15,iv is obtained from the measured velocity level difference
between leaf 2 and leaf 4 by equation 3. Further before equation 2 and 3 can be applied below coincidence frequency a correction for non-resonant velocity components in the measured velocity of leaf 4 is necessary. An estimate of the non-resonant velocity component can be found by applying equation 6. Additional input data is necessary for this correction and has to be predicted, which also increases the uncertainty of the final result.
Equation (1), referred to as the simplified power balance approach, is perhaps easier to apply because estimating the resonant sound reduction index of a single leaf is easier and can be performed more accurately than obtaining the resonant sound reduction index of a double leaf system. But also this situation has to be handled with care because common prediction methods, like e.g. [6], [7], are assuming that sound is radiated into a free field and not into cavity with dimensions that may be smaller than the wavelength of sound in air.
5 REFERENCES
[1] S. Schoenwald, T. R. T. Nightingale, E Gerretsen and H. Martin, “Application of direct method of ISO 10848 to flanking transmission through double leaf gypsum board walls,” Proceedings of Internoise 2006, Honolulu, Hawaii (2006).
[2] E. Gerretsen, “Calculation of airborne and impact sound isolation between dwellings”, Applied Acoustics, 19(4), pp. 245-264, (1986)
[3] R. J. M. Craik, “Sound transmission through buildings: Using statistical energy analysis,” Gower Publishing Limited, (1996).
[4] L. L. Beranek and I. L: Ver, “Noise and vibration control engineering, Principals and applications”, John Willey and Sons, 1992
[5] M. E. Delany and E. N. Bazley, “Acoustical properties of fibrous absorbent materials,” Applied Acoustics, 3 (2), pp. 105-116, (1970)
[6] F. G. Leppington, E. G. Broadbent and K. H. Heron “The acoustic radiation efficiency of rectangular panels”, Proceedings of the Royal Society of London, A 382, 245-271, (1982)
[7] F. G. Leppington, E. G. Broadbent, K. H. Heron and S. M. Mead “Resonant and non-resonant acoustic properties of elastic panels. ii. The transmission problem”, Proceedings of the Royal Society of London, A 412, 309-337, (1987)
[8] F. G. Leppington “Acoustic radiation from plates into wedge-shaped fluid region: application to the free plate problem”, Proceedings of the Royal Society of London, A 452, 1745-1764, (1997).
[9] R. A. Novak, “Sound isolation of lightweight double walls”, Applied Acoustics, 37, pp. 281-303, (1992).