Publisher’s version / Version de l'éditeur:
The Journal of Physical Chemistry C: Nanomaterials and Interfaces, 114, 39, pp.
16463-16474, 2010-09-01
READ THESE TERMS AND CONDITIONS CAREFULLY BEFORE USING THIS WEBSITE.
https://nrc-publications.canada.ca/eng/copyright
Vous avez des questions? Nous pouvons vous aider. Pour communiquer directement avec un auteur, consultez la première page de la revue dans laquelle son article a été publié afin de trouver ses coordonnées. Si vous n’arrivez pas à les repérer, communiquez avec nous à PublicationsArchive-ArchivesPublications@nrc-cnrc.gc.ca.
Questions? Contact the NRC Publications Archive team at
PublicationsArchive-ArchivesPublications@nrc-cnrc.gc.ca. If you wish to email the authors directly, please see the first page of the publication for their contact information.
NRC Publications Archive
Archives des publications du CNRC
This publication could be one of several versions: author’s original, accepted manuscript or the publisher’s version. / La version de cette publication peut être l’une des suivantes : la version prépublication de l’auteur, la version acceptée du manuscrit ou la version de l’éditeur.
For the publisher’s version, please access the DOI link below./ Pour consulter la version de l’éditeur, utilisez le lien DOI ci-dessous.
https://doi.org/10.1021/jp104306j
Access and use of this website and the material on it are subject to the Terms and Conditions set forth at
Oxygen reduction reaction activity and electrochemical stability of
thin-film bilayer systems of platinum on niobium oxide
Zhang, Li; Wang, Liya; Holt, Chris M. B.; Navessin, Titichai; Malek, Kourosh;
Eikerling, Michael H.; Mitlin, David
https://publications-cnrc.canada.ca/fra/droits
L’accès à ce site Web et l’utilisation de son contenu sont assujettis aux conditions présentées dans le site
LISEZ CES CONDITIONS ATTENTIVEMENT AVANT D’UTILISER CE SITE WEB.
NRC Publications Record / Notice d'Archives des publications de CNRC:
https://nrc-publications.canada.ca/eng/view/object/?id=af7f4c9a-daa7-4ca4-bf5e-4795e8f31e04 https://publications-cnrc.canada.ca/fra/voir/objet/?id=af7f4c9a-daa7-4ca4-bf5e-4795e8f31e04ReceiVed: May 11, 2010; ReVised Manuscript ReceiVed: July 26, 2010
We used electrochemical testing and theoretical calculations based on density functional theory (DFT) to examine the oxygen reduction reaction (ORR) activity of platinum electrocatalyst supported on several forms of niobium oxide. Bilayer electrocatalysts were synthesized in the form of 5 nm thick Pt layers (ca. 0.01 mg/cm2), deposited on 5 or 10 nm thick niobium oxide and backed by glassy carbon (GC) electrodes. The
NbO and NbO2supports enhance the specific electrochemical activity of Pt relative to the identically synthesized
baseline system of Pt on GC but have no positive effect on the mass activity. The electrochemical stability of the Pt/NbO2bilayer system was investigated by potential cycling with up to 2500 cyclic voltammetry
(CV) cycles. After 2500 cycles, data indicates minimal electrochemical area loss. With the use of DFT calculations, we have evaluated effects of oxygen incorporation on stability, electronic structure, and electrochemical activity of Pt|NbxOysystems. Calculations predict a transfer of electronic charge density from Nb, NbO, and NbO2to Pt and a reverse case for Nb2O5. However, the experimental ORR activity does not
follow the trends predicted by the d-band model.
1. Introduction
Polymer electrolyte fuel cells (PEFC) are touted as the key enabling technology of a highly efficient and clean energy infrastructure based on hydrogen. Without question, PEFC technology has seen tremendous progress in the past 2 decades. Despite these improvements, the large-scale commercialization still faces numerous challenges in scientific and technological aspects such as identifying the benign temperature range of operation, improving the performance response and tolerance to pertinent variations in operating conditions, controlling distribution and fluxes of water in cell components, accomplish-ing economical stack engineeraccomplish-ing design, loweraccomplish-ing the cost of materials, and enhancing materials’ durability and fuel cell cycle life.1–3
For the electrode materials, most efforts focus on the electrocatalyst material at the cathode side, where the oxygen reduction reaction (ORR) incurs a major portion (30-40%) of irreversible voltage losses. Highly active and cost-effective ORR electrocatalysts are essential for achieving key milestones in power density and overall system costs of PEFC.
One persistent challenge even with the best currently available Pt-based catalyst materials is the sluggish kinetics of ORR. At relevant cathode potentials above ∼0.75 V, Pt surface sites form relatively strong Pt-O and Pt-OH bonds, which block the further access of oxygen molecules to active surface sites of Pt.4Overcoming this limitation demands high cathodic
over-potentials, i.e., a reduction of the cathodic electrode potential by several hundreds of millivolts below the reversible thermo-dynamic potential of 1.23 V to generate a sufficient number of oxide-free active sites on Pt and lower the activation barrier of electron-transfer processes at these sites.
The second critical problem is the long-time durability of catalyst and support materials.1Carbon is the most widely used catalyst support due to its high surface area, good electronic conductivity, and the beneficial electronic interaction with Pt. However, severe active surface area losses occur under opera-tion, which are predominantly caused by carbon corrosion and Pt dissolution. The oxidation of carbon under the corrosive working conditions in a PEFC is accelerated in the presence of Pt-containing catalysts.
To address improvements in power density and cost reduction (due to Pt loading reduction) of electrocatalyst systems in PEFC, great attention has focused on (i) increasing the intrinsic activity of the Pt catalyst by control of size, shape, and composition (in case of mixed metal catalysts) of catalyst nanoparticles5 and (ii) increasing the statistical utilization of Pt by optimizing composition and porous structure of the cathode catalyst layer.6–8 Degradation studies have mainly focused on effects of Pt particle size distributions on stability and durability.9The impact of the support material on electrocatalytic activity and stability influ-enced by its morphology, intrinsic electronic structure, and Pt-support interactions has received much less attention.
Several studies in PEFC research have started to explore metal oxide supported Pt electrocatalysts as alternative systems to achieve improved activity and durability. Electrocatalysts comprising Pt supported on transition metal oxides MxOy(e.g.,
M ) Nb,10,11Ti,12–14Ta,15,16W,17,18Ce,19Ru,20Ir,21and Sn22) have been investigatedssome, such as TiO2, which is attractive
* Corresponding authors. E-mail: dmitlin@ualberta.ca (D.M.); lzhang12@ ualberta.ca (L.Z.).
†University of Alberta.
‡National Institute for Nanotechnology. §Simon Fraser University.
|NRC Institute for Fuel Cell Innovation.
10.1021/jp104306j 2010 American Chemical Society Published on Web 09/01/2010
because of its exceptional stability23sin significant detail. However, the electronic conductivity of undoped TiO2(0.132 and 0.124 S cm-1
reported for anatase and rutile lattices, respectively)24is rather low for a catalyst support material in PEFC, as compared to Vulcan carbon which has a conductivity of around 4 S cm-1at room temperature, unless TiO
2is doped by a conductive metal. A systematic stability study by Martı´nez et al. for a wide range of metal dioxides has singled out NbO2 as the second most stable material, which has better electronic conductivity than TiO2.23Therefore, Nb oxides, Nb doped TiO2, and nonstoichiometric TixOy (Ebonex) drew attention as
can-didate support materials for Pt catalyst.7,25,26
Theoretical studies of support effects on electrocatalytic performance have to address a hierarchy of electronic structure effects, including bulk metal oxide properties, interfacial proper-ties, and Pt surface properties. Conductivity is a main selection criteria for support materials. Materials that pass this hurdle need to be evaluated in terms of electrocatalytic activity and stability. A key variable that controls the complex interplay of support effects is the degree of oxygen incorporation, i.e., the ratio y/x. Complex random morphologies of the MxOy|Pt interface as well
as of the Pt surface further complicate this interplay. Pt may form islands on the metal oxide surface, instead of the continuous film assumed in our study. Oxygen vacancy sites on the Pt-free metal oxide surface may help to split O-O bonds. The objective of the present study is to systematically investigate the ORR activity of a model system consisting of a thin-film Pt electrocatalyst supported on several forms of planar niobium oxide (NbO, NbO2, and Nb2O5), also in thin-film form. This research methodology, based on precisely controlled thin-film bilayer systems with well-characterized surface areas and interfaces, can provide fundamental insight regarding the intrinsic activities of Pt on various metal oxide substrates. This insight may then be utilized for rational design of improved technologically important particulate-based supported ORR catalysts.
2. Experimental Procedure
Glassy carbon (GC) electrodes (11.32 mm in diameter and 2 mm thick) were polished to a mirror finish with 6.0, 1.0, 0.25, and 0.05 µm polycrystalline diamond paste (Allied High Tech Products, Inc.) in sequence. After each polishing step, the GC electrodes were ultrasonically cleaned in Milli-Q (Millipore) water. Finally, the GC electrodes were ultrasonically cleaned in 8 M HNO3, acetone, isopropyl alcohol, and Milli-Q water in sequence and dried under argon flow.
Five or ten nanometer thick niobium oxide films were deposited onto the GC supports by radio frequency magnetron sputtering (AJA International, Inc.) from a niobium target (99.995% purity) in mixed argon-oxygen plasma. The ratio of argon to oxygen was controlled by two mass-flow controllers. Prior to all depositions, the sputtering chamber reached a base pressure below 5 × 10⁻⁸
Torr. The total pressure in the sputtering chamber was maintained at 10 × 10-3Torr for all the experiments, and the volume flow ratios of argon to oxygen ranged from 8.4:1.6 to 9.8:0.2 with a total flow rate of 10 sccm. The substrate was held at 700 °C during deposition. After sputtering, the oxide films were annealed at 700 °C for 2 h in the deposition chamber. Deposition rate calibration was per-formed ex situ through the use of a profilometer (KLA-Tencor P-10) to measure step heights.
The phases present were identified using glancing angle X-ray diffraction (Bruker AXS D8 Discover diffractometer with a GADDS area detector). Phase identification was performed on
∼500 nm thick NbxOyfilms grown on 4 in. (100) Si substrates
using identical deposition parameters. Although the grain size is expected to be different between the nanometer-thick and the half-micrometer thick samples, the stoichiometry of the oxide phase should be nearly identical. The surface morphologies of the films were analyzed using a Hitachi S-4800 scanning electron microscope (SEM) operated at 20 kV.
Five nanometer thick (ca. 0.01 mg/cm2) Pt films were deposited either directly on GC electrodes (baseline) or onto the niobium oxide films by radio frequency magnetron sput-tering. The rationale for choosing 5 nm thick Pt is provided in the Results section. A high-purity platinum target (99.995% purity) and ultrapure argon (99.999%) atmosphere were used. The targets were presputtered for 3 min to remove surface impurities. A substrate temperature of 630 °C was used to obtain crystalline and strongly adhering Pt films with good adhesion. In this case, the sputtering rate was accurately measured in situ using a crystal monitor at the substrate plane. For these depositions a rate of 0.9 nm/min was used. Pt deposition was done directly after the final step of the oxide growth process, without breaking vacuum.
To prevent the Pt from contacting the sides of the GC and creating a short circuit we developed a rudimentary microfab-rication process. In summary, a filled-in circle with a diameter slightly smaller than that of the GC disk was patterned on the GC using a high-quality permanent marker that did not streak. Chromium was then sputtered unto the entire GC surface. The samples were subsequently ultrasonically cleaned in acetone to remove the ink and the chromium that was on top. SEM analysis confirmed complete Cr removal. The remaining chromium lining the periphery of the GC was then used as a lift-off mask to pattern the Pt with the underlying oxide preventing overhang. After deposition the entire electrode was immersed into Cr-7 standard solution (50 g of ceric ammonium nitrate + 12 mL of HClO4in 300 mL of water) to remove the remaining chromium. Both SEM analysis and electrochemical testing confirmed that Pt was not shorted to the GC substrate and that the only electrical path between the Pt layer and the GC disk was through the niobium oxide.
Electrochemical measurements were performed using a standard rotating disk electrode (RDE) system (Princeton Applied Research model 616 RDE), a potentiostat (Versa STAT 3), and an in-house-fabricated three-compartment glass cell. A helical Pt wire counter electrode and a chloride-free Hg/Hg2SO4 reference electrode with taper joint (Princeton Applied Research model G0093) were used. All the potentials are specified relative to the reversible hydrogen electrode (RHE) scale. All electro-chemical measurements were carried out at room temperature. Solutions were prepared from 70% HClO4(Optima grade, Fisher Scientific) and Milli-Q water. Ultrapure argon (99.999%, Praxair) and oxygen (99.999%, Praxair) were used for solution deaeration and saturation, respectively. Prior to oxygen reduction measurements, cyclic voltammetry (CV) was taken in argon saturated 0.1 M HClO4solution. Before the CV tests, argon was bubbled through the electrolyte solution for 45 min. Then, the working electrodes were electrochemically cleaned by sweeping their potential between 0.0 and 1.4 V at 100 mV/s until steady-state cyclic voltammograms were obtained. The onset of the hydrogen evolution potential was recorded and then set as the cathodic vertex. Then the potential was scanned in a potential range of 0.03-1.2 V with a scan rate of 100 mV/s for 20 cycles. The stable 20th CV was used for calculating the electrochemical surface area of Pt (ESA or Areal). Here, Areal was determined by averaging the charge of the Hads (Q′) and
Hdes(Q′′) peaks corrected for double layer charging to get QH and using eq 1.
We used the accepted value k ) 210 µC/cm2 for the maximum surface charge transferred to Pt during adsorption of a monolayer of H.
After the CV measurement, O2 was bubbled through the solution for 60 min and then ORR testing was started. The electrode was scanned from 0.03 to 1.0 V and back to 0.03 V at 200 rpm with a scan rate of 10 mV/s for a total of five scans. Then voltammetric curves at other rotational speeds were taken using the same potential range and scan rate. The anodic scan, or back-wave curve, from 0.03 to 1.0 V was used for data analysis.
3. Computational Methods
Density functional theory (DFT) calculations were carried out using the Vienna ab initio simulation package (VASP).27 The core-valence electron interactions were treated using Blo¨chl’s projector-augmented wave (PAW) formalism with a cutoff energy of 400 eV. The nonlocal exchange and correlation energies were calculated with the Perdew-Wang (PW91) functional within generalized gradient approximation (GGA). The total energy calculations were performed with the linear tetrahedron method with Blo¨chl correction.28We employed the Methfessel-Paxton function, which gives the most accurate description of the occupation of electronic states at the Fermi level.29 Brillouin zone integrations were performed using a Monkhorst-Pack 9 × 9 × 9 k-points mesh.
Initially, we performed calculations for slabs of bare NbxOy
support layers, without deposited Pt. Simulated slabs represent NbO(111), NbO2(100), and Nb2O5(001) surfaces. We simulated NbxOy with four or five layers and inserted a vacuum layer
between periodically repeated images. The difference in total
energy per atom between slabs with four and five monolayers of NbxOy was 1.2 meV. In going from four to five layers of
NbxOy, the difference in total density of state (DOS) per surface
atom at the Fermi level is less than 3%. Increasing the width of the vacuum layer from 15 to 25 Å caused the total energy per atom to decrease by 0.8 meV. In this range, the thickness of the vacuum layer does not exert any significant influence on the electronic structure of NbxOy. We have performed calcula-tions of total energies and electronic structure of four-layer slabs of NbO2for varying size of the unit cell. We found that total energy and the DOS at the Fermi level per atom increased by 1.5% and 2.4%, respectively, when the size of the unit cell increased from 1 × 1 to 2 × 2. On the other hand, the computational time increased by about a factor of 10 for the 2 ×2 unit cell. On the basis of these benchmark calculations, we used four monolayers of NbxOy with a 1 × 1 unit cell and a
vacuum layer thickness of 15 Å between periodically repeated NbxOyslabs.
In order to study the physical properties of Pt|NbxOybilayer
systems, we considered an initial configuration with four layers of NbxOycontact with three layers of Pt. Pt atoms at NbO(111)
and Nb2O5(001) are located at hollow sites of oxygen; they form bonds with three neighboring undercoordinated surface O atoms. At NbO2(100), Pt atoms are located at bridge sites, each forming bonds with two undercoordinated surface O atoms. The remain-ing Pt atoms are constructed based on the interfacial layer of Pt atoms to form a face-centered cubic (fcc) structure.
4. Results
4.1. Experimental: Structure and Electrochemical Analy-sis.Figure 1 shows the XRD patterns for the obtained niobium oxide phases. Adjusting the argon to oxygen volume flow ratio controls the degree of oxygen incorporation. An argon to oxygen volume flow ratio of 8.4:1.6 leads to the formation of Nb2O5, a ratio of 8.8:1.2 leads to a mixture of Nb2O5 and NbO2 (not shown), a ratio of 9.0:1.0 leads to NbO2, and 9.5:0.5 leads to NbO.
Figure 1. X-ray diffraction patterns of ∼500 nm niobium oxide films: (a) NbO, grown with the mass flow ratio of argon to oxygen gas being 9.5:0.5; (b) NbO2grown with ratio of 9.0:1.0; (c) Nb2O5grown with the ratio of 8.4:1.6.
Areal) QH
Figure 2a shows the first cycle CV curve of 10 nm niobium oxide films on GC, without the Pt overlayer. Only the first two cycles are given for each film. The potential was first scanned negatively from 0.72 V at a sweep rate of 50 mV/s. No specific reduction peaks emerged on the cathodic scans for all three films. When the potential was scanned positively the Nb2O5was quite stable. For both NbO and NbO2electrodes anodic reaction commences at about 0.6 V. In the reverse scan no reduction peaks were observed. This indicates that the oxidized species formed in the first positive scan cannot be cathodically reduced in the reverse scan. During the second positive scan, the oxidation peaks decreased significantly. After several scans (not shown), all three films showed nearly identical stable CV curves, with the current close to zero for both the forward and reverse scans. It can thus be concluded that without a Pt overlayer an irreversible oxidation reaction occurs on the surfaces of NbO and NbO2. As demonstrated in Figure 2c, the presence of a 5 nm Pt overlayer effectively prevents oxidation of either NbO or NbO2.
Figure 2b presents the ORR curves of 10 nm niobium oxide electrodes at 1600 rpm. All three films possess negligible catalytic activities. A minor increase in the cathodic current below 0.3 V is apparent. This is most likely not ORR by the oxide films but, rather, the action of the exposed GC electrode. Figure 2c shows the CV curves of the supported 5 nm Pt films, including the baseline. It is evident that Pt on niobium oxide exhibits higher double layer charging currents compared to Pt on GC. This is expected since niobium oxide compounds are known to be good capacitor materials. The Nb2O5possesses the largest capacitance being an insulator (10-4
S cm-1 ),30 whereas NbO and NbO2(15 S cm
-1)31are n-type semiconduc-tors with consequently lower capacitances. Due to the high electrical resistance of Nb2O5, its CV differs fundamentally from the other three curves. The oxide reduction peak negatively shifts about 250 mV, and only one hydrogen adsorption peak appears
in the negative scan. The real surface area (Areal) of Pt can be calculated from the average value of charge obtained by integrating the hydrogen desorption and adsorption peaks and using eq 1. The surface roughness factors are then calculated to be 2.69 for Pt/GC, 1.09 for Pt/NbO, 1.88 for Pt/NbO2, and 2.1 for Pt/Nb2O5.
The effect of thickness of Pt deposited on NbO2is shown in Figure 2d. As demonstrated in the figure, between 1 and 5 nm, the ORR activity improves with increasing Pt thickness. When the thickness of Pt reaches 5 nm, the limited current remains constant at around 5.75 mA/cm2
geo, which is close to the theoretical value of 5.8 mA/cm2
geo. Beyond 5 nm, the ORR curves are stable with no additional benefit of further increasing the Pt loading. Hence a 5 nm thickness of Pt was chosen for all subsequent ORR experiments.
Figure 3 shows plan-view SEM micrographs of the 5 nm Pt on 10 nm of the three oxides, NbO (Figure 3a), NbO2(Figure 3b), and Nb2O5(Figure 3c). The 10 nm thick bare oxide surfaces are relatively uniform at these magnifications, with the observed surface morphology being due to the Pt overlayer. Generally one can correlate wetting behavior of very thin films, 5 nm in this case, with their surface roughness. Such a comparison breaks down at larger thicknesses where competitive grain growth begins to dominate the surface morphology.32,33 Differing wetting behavior, in turn, indicates a variation in the degree of chemical interaction between the overlayer and the support. From both the electrochemical results and the plan-view SEM analysis one can argue that the strongest chemical interaction is for Pt on the NbO surface, the least chemical interaction is for Pt on Nb2O5, and Pt on NbO2seems to be an intermediate between the two.
Figure 4 shows the ORR curves for Pt films on the four supports. The thickness of the Pt was 5 nm, whereas that of the oxides was 10 nm. Only the anodic potential sweeps are shown and discussed. Figure 4a shows the ORR data for the baseline Figure 2. (a) Cyclic voltammograms of 10 nm NbxOy/GC (geometric area ) 1.0 cm2). The scan rate was 50 mV/s. (b) Oxygen reduction curves
of 10 nm NbxOy/GC: rotation rate of 1600 rpm, scan rate of 5 mV/s. (c) Cyclic voltammogram curves of 5 nm Pt supported on 10 nm NbxOy/GC,
with Pt on GC as a baseline. The scan rate was 100 mV/s. (d) Effect of different Pt thicknesses on ORR activity of Pt on NbO2: rotation rate of
1600 rpm, scan rate of 10 mV/s.
Pt on GC. Figure 4b shows the ORR data for Pt on NbO, while Figure 4c shows the ORR data for Pt on NbO2. In the case of Pt on Nb2O5(Figure 4d) the oxygen reduction current is very low and independent of the rotation rate. Hence, only the ORR curve at 1600 rpm is displayed. Sasaki et al. reported that ORR curves of Pt/(Nb2O5+carbon) are dependent on rotation rate.10 However, their fabrication processes and microstructure were different. Here the Nb2O5film completely separates the GC from the Pt, with negligible contributions from areas of Pt on GC. Since Nb2O5is an insulator, electrical current cannot flow to or from the Pt film. In ref 10 the electrocatalysts were synthesized with an amount of Pt equivalent to a monolayer coverage on Nb2O5nanoparticles, where that entire nanoparticle was then
supported by conductive carbon (Vulcan). The electrical path in that microstructure is therefore quite different. The onset potentials of O2reduction of Pt on GC, Pt on NbO, and Pt on NbO2are found at 0.980, 0.968, and 0.984 V, respectively.
The RDE data was further analyzed with the Koutecky-Levich (K-L) approach,34embodied by eq 2.
Figure 3. Plan view SEM micrographs of 5 nm thick platinum films on the three oxide supports: (a) Pt on 10 nm of NbO; (b) Pt on 10 nm of NbO2; (c) Pt on 10 nm of Nb2O5.
Figure 4. Oxygen reduction curves of (a) Pt on glassy carbon, (b) Pt on 10 nm of NbO, (c) Pt on 10 nm NbO2, and (d) Pt on 10 nm Nb2O5. The
sweep rate was 10 mV/s.
1 I ) 1 IK + 1 IL ) 1 IK + 1 Bω1/2 ) 1 IK + 1 0.62nFAgeoDO 2 2/3 ω1/2ν-1/6CO 2 (2)
where I is the measured current, IKand ILare the kinetic and the diffusion-limited current, respectively, B is the Levich slope,
F is the Faraday constant, n is the number of electrons transferred per O2molecule, DO2is the diffusion coefficient of
oxygen being equal to 1.93 × 10⁻⁵
cm2 s-1 ,35 C
O2 is the
concentration of oxygen in the bulk solution, ω is the angular velocity, and ν is the kinematic viscosity of the solution.
The K-L plots of Pt on NbO2are shown in Figure 5a. The number of electrons transferred per O2 molecule (n) can be deduced from the experimental value B obtained from the slope of the K-L plot. The calculated value of n (ca. 4.01) supports a four-electron pathway of oxygen reduction.10,36The number of electrons transferred per O2molecule for Pt on GC, Pt on NbO, and Pt on NbO2 were similarly calculated to be 4. However, as Sarapuu et al.37 indicated, it is not possible to unequivocally establish whether the reduction of O2proceeds through the direct 4e
-pathway or through a H2O2intermediate pathway.
We further compared the intrinsic activities of the supported Pt films with currents that are normalized by the geometric surface area (GSA), as well as by electrochemical surface area (ESA). The procedure of normalizing ORR profiles is sum-marized here. First ILand Ikare normalized by the GSA and ESA according to eqs 3 and 4, respectively.
Next the normalized overall current density is reconstructed via eq 5, using a roughness factor of 10, in accordance with analysis in Xiao et al.’s work.38
The plots of j* as a function of the electrode potential are shown in Figure 5b. We can now provide a distinct comparison in the half-wave potential (E1/2) for the four catalyst systems. In comparison to the baseline of Pt on GC, the half-wave potentials of Pt on a 10 nm of NbO, on 10 nm of NbO2, and on 5 nm of NbO2shift positively by 10.65, 14.59, and 21.54 mV,
respectively. These normalized ORR curves demonstrate that NbO and NbO2substrates do enhance the Pt ORR.
We now compare the effect of the support material on the Pt specific activity and on the Pt mass activity, at a potential of 0.85 V versus RHE. An approximately constant Pt loading of 0.011 mg/cm2was used in the analysis, which we obtained as the product of Pt density (assumed constant), electrode surface area, and a Pt layer thickness of 5 nm. Table 1 demonstrates that Pt on both forms of oxide exhibit improved specific activities relative to the baseline Pt on GC, but comparable mass activities (except Pt on 10 nm of NbO).
The electrochemical stability of Pt on 10 nm of NbO2was investigated up to 2500 CV cycles, with ORR measurements being performed at cycle 1 and at cycle 2500. Figure 6 shows these results. Comparison of the CV data before and after 2500 cycles shows minimal electrochemical area loss. This indicates that Pt has both excellent adhesion to NbO2and that this bond is stable even after long-term voltage cycling. An examination of the ORR curves before and after 2500 potential cycles shows that the half-wave potential shifted negatively by only 20 mV. On the contrary, for the 5 nm Pt on GC, after 2500 cycles, the thin film almost peeled off and the catalytic activity dropped remarkably; it is straightforward to conclude that the electro-chemical stability of Pt on NbO2is improved compared to Pt on GC.
4.2. Modeling: Electronic Structure Calculations and
Effect of Oxygen Incorporation. The degree of oxygen
incorporation, y/x, is a vital parameter of metal oxide support materials. In the thin-film bilayer systems of Pt|NbxOy, studied
here, it influences catalytic properties through a hierarchy of effects. As we will see, y/x determines the stability and electronic conductivity of the bulk material of NbxOy; we will evaluate
these properties by calculating formation energies, Fermi energies, and density of states (DOS) at the Fermi level. Next,
y/x determines the structure of the interface between Pt and NbxOy, which can be characterized by type, number, and strength
of interfacial bonds, as well as by the charge distribution in the interfacial region that establishes in order to balance the Figure 5. (a) Koutecky-Levich (K-L) plot at different potentials using the data obtained from Pt on 10 nm of NbO2and (b) normalized ORR
profiles obtained by plotting normalized overall current density (j*) as a function of the electrode potential.
jL) IL GSA (3) jK ) IK ESA (4) 1 j* ) 1 jL + 1 10jK ) 1 jL + 1 j*K ) j* + jK L j*jKL (5)
TABLE 1: Pt Specific Activities and Pt Mass Activities As a Function of Substrate substrates Pt specific activity jk/(mA · cm-2real) at 0.850 VRHE Pt mass activity jk/mA · µg-1Pt at 0.850 VRHE Pt/GC 1.3 0.33 Pt/NbO (10 nm) 1.7 0.18 Pt/NbO2(10 nm) 1.9 0.34 Pt/NbO2(5 nm) 2.5 0.3
mismatch between pristine work functions (or electrochemical potentials of electrons) of Pt and NbxOy. Finally, we can
characterize the resulting work function and electronic band structure at the Pt surface, specifically the d-band structure, in order to evaluate the effect of y/x on interaction of Pt with chemisorbed -O and -OH species that determine the current density of the ORR.
Considering the oxidation reaction of Nb
the formation energy of NbxOy can be calculated from the
following expression
where µNbxOy is the chemical potential of NbxOy, and µNb and
µO2are the chemical potentials of Nb and oxygen molecules in
the gas phase. Due to the complicated electronic structure of O2, the binding energy of O2cannot be determined precisely with DFT.39Instead, the chemical potential of O
2can be found from the relation
where ∆G is the molar reaction Gibbs energy of the reaction H2O f H2 +1/2O2, which is found as 2.46 eV from experi-ment,40 and µ
H2O and µH2 are the chemical potentials of H2O
and H2in the gas phase, respectively, which can be obtained from DFT. Results of our calculations show that µH2O)14.28
eV and µH2) 6.83 eV, which gives µO2) 9.61 eV. Inserted
into eq 8, the formation energies of NbO, NbO2, and Nb2O5 are obtained as -0.16, -2.47, and -4.15 eV. The calculated formation energy for NbO2 is in good agreement with the measured value of -2.76 eV that was reported in ref 41. The absolute value of the formation energy increases with y/x, singling out Nb2O5as the most stable system in the considered series of metal oxides, as can be seen in Figure 7a.
Oxidation of Nb occurs through covalent bonding between O and Nb atoms. Since oxygen has a higher electron affinity, electron density is transferred from d-orbitals of Nb into unoccupied p-orbitals of O atoms. With increasing y/x, the
d-electron occupancy, therefore, reduces from d4for bare Nb to d3in NbO, d1in NbO
2, and d0in Nb2O5.
The Fermi energy, εF, is determined as the energy difference of the highest occupied electronic state in NbxOy to the
electrostatic potential in the center of the vacuum layer between periodically repeated slabs. The values obtained are -4.15, -5.15, -5.62, and -6.55 eV for Nb, NbO, NbO2, and Nb2O5, respectively. Figure 7b illustrates the effect of y/x on εF.
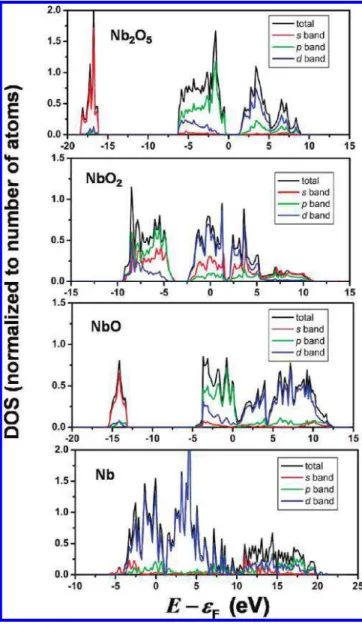
The electronic conductivity of the metal oxide material depends on the electronic DOS at εF. In NbxOy, the conduction
band is formed by d-electrons of Nb atoms. The valence band below εFis formed by hybridized s- and p-electrons. Figure 8 depicts the effect of oxygen incorporation on the total DOS and DOS on s-, p-, and d-orbitals, plotted as a function of E - εF for each case. With increasing y/x more electron density in d-bands with higher energy is transferred to the hybridized s-and p-orbitals, which are allocated below εF. This transfer of electronic charge from states at the Fermi level into lower-lying states decreases the DOS at εF. For Nb2O5, εFlies in the band gap between valence band (s- and p-dominated) and conduction band (d-dominated), as expected since this material is known as an insulator. The observed trend in the DOS at the Fermi level upon increasing y/x is consistent with the decreasing electronic conductivity in this series, observed in experiment. Undersaturated oxygen with dangling bonds at the substrate surface causes a significant geometric distortion of the surface structure.42,43In the case of Nb
xOy, undercoordinated surface O
atoms provide an excess p-electron density, hence, changing the charge distribution at the surface. The distribution of excess electronic charge density at the surface creates an electrostatic surface dipole layer, which contributes to the electrostatic energy of electrons at the surface. Potential energies generated by surface electrons of NbxOydepend on the ratio y/x and on the
surface morphology (atomic arrangement). The work function of an uncharged metal is related to the Fermi energy and the surface potential, χs, via
where e0 is the elementary charge. Since both Fermi energy and surface potential, χs, refer to the electrostatic potential in the center of the vacuum layer between two neighboring slabs, φV, the work function can be expressed as
Figure 6. (a) CV and (b) oxygen reduction curves at cycle 1 and at cycle number 2500, for Pt on 10 nm of NbO2. Cycling was performed from
0.6 to 1.1 V at a sweep rate of 10 mV/s. xNb + y 2O2fNbxOy (6) Eform)∆µ ) µ NbxOy-xµNb -y 2µO2 (7) µO 2 )2µ H2O-2µH2-2∆G (8) ΦM) -εF+e 0χ s (9) ΦM) -εF+e 0(φ V - χS) (10)
The values of ΦMfor Nb(111), NbO(111), NbO
2(100), and Nb2O5(001) determined in our calculations are 3.99, 5.13, 5.64, and 6.58 eV, respectively. These values are plotted versus y/x in Figure 7c. The work function of the substrate material increases markedly with increasing y/x.44
Upon establishing an electrical contact between catalyst and support, corresponding to the formation of a metal|metal oxide interface, equalization of the Fermi levels to attain thermody-namic equilibrium drives electron transfer from the side with lower work function to the one with higher work function. This interfacial charge transfer phenomenon has been quantitatively studied on metal|TiO2systems.45Pt(111) is known to have ΦM )6.1 eV;46this value is indicated as a dotted horizontal line in Figure 7c. Upon establishing contact at the Pt(111)|NbxOy
interface, electronic charge will therefore flow from NbxOyto
Pt for y/x ) 0, 1, 2, generating a negative charge on Pt. For Pt(111)|Nb2O5the direction of electron transfer upon contact is reversed, leaving a net positive charge on Pt.
The normalized charge distribution per surface volume along the direction perpendicular to surface is plotted in Figure 9. The integral of the electronic excess charge density per volume in the Pt region along the normal direction to the interface gives the net excess surface charge density per unit surface area of Pt; the obtained values of net excess charge per Pt atom at the Pt|NbxOyinterface and per unit area are listed in Table 2. The
net charge density on Pt at the interface is positive for y/x ) 0, 1, 2 and negative for y/x ) 2.5. This finding is consistent with the differences in the work function. The corresponding shifts in Fermi energy, ∆εFPt, and the work function of Pt resulting from the interfacial charge flux are given in Table 2. The interfacial charge transfer between Pt and NbxOyis accomplished
by interactions between Pt atoms and undersaturated O atoms at the Pt|NbxOy interface. Due to the difference in surface
morphology, the adsorption site for Pt changes from a bridge site on Nb2O5to an on-top site on the NbO2surface, as shown in Figure 10. We calculated the adsorption energy of Pt on NbxOy, Ead, by
where Etot, EPt/sub, and EPtare the total energies of the Pt/NbxOy
systems and of free NbxOy and Pt slabs, respectively. The
calculation results of Eadnormalized by the number of NbxOy-Pt
bonds along with the type and abundances of bonds for different systems are shown in Table 2. In calculations, we determined the weakest interaction of the Pt film with NbO and the strongest interaction with Nb2O5; this trend is opposite to inferences on interactions between Pt and NbxOy that were made based on
experimental observations of the wetting behavior of Pt, depicted in Figure 3.
The interaction between NbxOyand Pt strongly influences the
morphology of the Pt film, as shown in Figure 10. In our simulation, Pt atoms are allowed to relax within the unit cell defined on the NbxOysubstrate. Pt layers are more distorted on
Nb2O5 and NbO2 than on NbO, due to the stronger Pt-O interaction with Pt|Nb2O5 and Pt|NbO2 and the geometrical mismatch between Pt(111) and Nb2O5(001) as well as NbO2(100). The average coordination number (CN) and Pt-Pt distance, two essential geometrical parameters for characteriza-tion of the optimized bilayer model, are listed in Table 2 for different systems. With decreasing y/x, average CN and Pt-Pt distance for relaxed Pt layers increase. Pt deposited on Nb2O5, which shows the lowest average CN for optimized geometry, undergoes the strongest reconstruction due to strong Pt-Nb2O5 interactions.
The different Pt surface morphologies, NbxOy-Pt interactions,
and charge redistribution at the Pt|NbxOy interface affect the
surface electronic structure of the Pt layer, that is, the width, DOS and occupancy of the d-band of Pt. In general, effects of increasing the degree of oxygen incorporation, y/x, on the d-band structure of Pt can be attributed to the interplay of several trends: (i) decreasing average coordination number and increasing average Pt-Pt bond distance reduce the overlap between d-orbitals of neighboring Pt atoms, which causes a narrowing
Figure 7. (a) Formation energy, (b) Fermi energy and density of states (normalized to number of atoms in unit cell) at the Fermi level, and (c) work function of NbxOyas a function of the degree of oxygen incorporation, y/x.
Ead)EPt/sub-Esub-EPt (11)
of the Pt d-band;41,47(ii) electron transfer between Pt and support results in a change in the d-band occupancy; (iii) in the absence of Nb atoms at the Pt|NbxOy interface, electron-deficient
p-orbitals of O atoms form partially ionic covalent bonds with Pt orbitals; hybridization between p-orbitals of O and d-orbitals of Pt effectuates the splitting of the DOS in dz2 by
producing antibonding orbitals above the Fermi level and bonding orbitals below the Fermi level; this splitting greatly increases the number of free DOS in dz2, while shifting the
energy of occupied states downward.48The d-band structure of Pt supported by NbO, NbO2, and Nb2O5 emerges from the interplay of all of the above effects. The d-band center, εjd, is defined as the first moment of the occupied local density of states (LDOS) in the d-band.49For a specific adsorption site, I, the projected d-band center, εd,I, can be calculated from50
where l and m are the quantum numbers for angular momentum and z-projection of angular momentum. nl)2,m,I(ε), is defined as
the DOS projected onto one of five localized d-orbitals (φl)2,m)-2,-1,0,-1,2) at site I. The binding energy of atomic oxygen,
Eb, at a specific surface site, relative to the energy of a free O2 molecule, is calculated from
where EO-Pt/subis the total energy of the Pt/NbxOysystems with
adsorbed atomic oxygen and µO2is the energy of an oxygen
molecule in the gas phase as calculated in eq 7. Figure 8. Total density of states (DOS) divided by the number of atoms
in the unit cell, and DOS projected onto s-, p-, and d-orbitals of NbxOyas
a function of electron energy, specified relative to the Fermi energy, εF.
εd,I)
∑
m∫
-∞ +∞ εnl)2,m,I(ε) dε∑
m∫
-∞ +∞ nl)2,m,I(ε) dε (12)Figure 9. Average charge density per volume for the position perpendicular to the Pt|NbxOyinterface.
TABLE 2: Excess Charge, Shift of Fermi Energy, Work Function, Normalized Adhesive Energy, and Lattice Parameters of Pt Film in Different Systems
Pt/Nb2O5 Pt/NbO2 Pt/NbO Pt
Pt|NbxOyInterface
excess charge per unit area (e0/nm2)
+0.0132 -0.813 -0.0169 excess charge per
Pt atom (e0)
+0.001 -0.08 -0.003
Eadper bond (eV) -4.306 -0.066 -0.005
no. of NbxOy-Pt bonds 2 1 0
Pt adsorption site on NbxOy
bridge top none Supported Pt Film ∆εFPt(eV) -0.28 +0.1 +0.28 ΦPt(V) 5.12 5.62 5.71 6.10 (ref 46) CN of Pt at Pt|solution interface 3 5.33 6 6 average Pt-Pt distance (Å) 2.6 2.8 2.8 2.8 ε jd- εF(eV) -3.25 -3.94 -3.26 -2.25 (ref 58) Eb(eV) -1.43 -1.32 -1.40 -1.63 (ref 61) Eb)EO-Pt/sub-EPt/sub -1 2µO2 (13)
For all high-symmetry sites (on-top, bridge, hollow, and fcc) on fixed Pt/NbxOysurface, we calculated εd,Iand corresponding
Eb. On Pt/NbO, Pt/NbO2, and Pt/Nb2O5surfaces, the adsorption site with largest absolute value of adsorption energy of atomic oxygen, |Eb|, is chosen as the most favorable site. For all three surfaces, the fcc site is the preferred adsorption site. We further calculated Ebfor the relaxed Pt/NbxOysurface to rationalize the
surface relaxation contribution to the adsorption energy. Results are listed in Table 2.
5. Discussion
The observed ORR activity at the Pt|solution interface of the bilayer systems is determined by the substrate conductivity, the resulting work function of Pt supported on NbxOy, as well as
by the surface charge density and the electronic structure at the Pt surface. A low degree of oxygen incorporation corresponds to high electronic conductivity of the support, which is a critical condition for maintaining a high electrochemical activity of the ORR at the Pt surface. Nb2O5fails to pass this primary hurdle. Conductivity competes with stability, the latter being the highest for large y/x. The work function of the Pt surface increases with increasing degree of oxygen incorporation; the work function is known to be related to the potential of zero charge (PZC) at the Pt|solution surface.51The proton and potential distribution in the solution near the interface (at the position of the Helmholtz layer) are determined by to the PZC. Thereby, the work function can exert a significant effect on the apparent ORR activity. The Pt|NbO2system exhibits formation of the largest negative surface excess charge due to the contact of Pt with the support, which is expected to be beneficial for the ORR reaction. Molecular level studies have revealed that reaction steps involving forma-tion and further reacforma-tion of chemisorbed -O and -OH on the Pt surface, including coupled electron- and proton-transfer processes, constitute the energetically most inhibited steps of the ORR mechanism.52–54 The adsorption Gibbs energy of chemisorbed -O and -OH is widely considered as a yardstick in evaluating the electrocatalytic ORR activity of supported or unsupported transition metal catalysts.55 On the one hand, chemisorbed oxygen species are intermediates of the ORR which should be formed at a high rate; on the other hand, maintaining steady high rates of ORR hinges on sufficient Pt surface sites that are free of chemisorbed oxygen species, a requirement that becomes critical if oxide species are bound too strongly. The conundrum of these competing adsorption requirements is responsible for the typical volcano shape in plots of
electro-catalytic rates of ORR studies as a function of the adsorption Gibbs energy of oxygen species.
Nørskov and co-workers developed this phenomenological concept further by relating the oxide chemisorption energy to the structure and occupancy of the transition metal d-band.56,57 A shift of the d-band center toward the Fermi level corresponds to increasing chemisorption energy. Trends between the position of the transition metal d-band center relative to the Fermi level, (εjd- εF), and kinetic current density, jk, for ORR at 0.8 V for ORR on the Pt monolayers supported on different metal in 0.1 M HClO4solution were systematically explored in ref 58. The data for jk are shown as a function of calculated values of (εjd- εF) in Figure 11, extracted from ref 58. On this plot, we also show measured jkat 0.8 V versus RHE for Pt/NbxOybilayer
systems together with (εjd- εF) and Ebfor the most preferred adsorption site obtained from our study. Admittedly, this mixed experimental/theoretical representation of results from our study in Figure 11 represents a crude attempt of rationalizing support effects on electrocatalytic activity; it ignores the significant discrepancy between comparatively thick and irregular bilayer structures evaluated in experiment and highly simplified struc-tures considered in modeling, which may obscure systematic correlations.
Figure 10. Side views (top) and top view (bottom) of relaxed Pt layers deposited on NbxOysubstrate. Black dash lines indicate the boundary of
unit cells.
Figure 11. Measured current density of ORR, jk(solid square), and
calculated atomic oxygen binding energy, Eb(open circle), vs calculated
d-band center relative to the Fermi energy (εjd- εF) for Pt monolayers
on various support materials, including the Pt/NbxOysystems studied
in the present work. The data for Pt[111]) is taken form ref 61 for comparison.
Pt|NbO2seems to be enhanced, compared to the expectation based on the (εjd- εF) position. Calculated binding energies of atomic oxygen, Eb, are plotted in Figure 11 as a function of (εjd- εF), together with reference data for oxygen adsorption at Pt(111).61The values of E
bfor the bilayer system follow roughly a linear trend with (εjd- εF), which is consistent with the d-band model proposed by Hammer et al.62 At present, we cannot explain the apparent enhancement of electrocatalytic activity of Pt with the NbO2support material relative to the value that corresponds to the calculated (εjd - εF); this discrepancy is probably due to a significant difference in the surface structure of Pt considered in calculations from the surface structure of the experimental sample. We expect that the (εjd- εF) position will depend on film thickness and surface morphology of Pt. We will have to conduct systematic calculations for Pt layers with variable thickness and surface structure in order to explore this further.
On the other hand, the strong metal support interaction (SMSI) has been intensively investigated on reduced metal oxides (TiO2, TaO5, CeO2, NbO, etc.)45with supported group VIII metals (Fe, Ni, Rh, Pt, Pd, and Ir).59 A strong bonding between metal cations on surfaces of oxides and the metal atoms (metal-metal interaction) was suggested to explain observed changes in catalytic and chemisorption properties and the morphology of the supported metal. The decreasing degree of oxygen incorporation is known to enhance metal-metal oxide interactions in the theory of SMSI.60Different from predictions of SMSI theory, we assumed in our simulations that the metal oxide surface is in the oxidized state, which means that the coordination numbers of surface Nb atoms are saturated. Therefore, Pt atoms at the Pt|NbxOyinterface are only forming
bonds with undersaturated surface oxygen atoms but not with Nb. Since both Pt-O and Nb-O bonding formation involve electron density transfer from d-orbitals of the metal to unoccupied p-orbitals of oxygen, the decreasing value of y/x reduces the amount of unoccupied p-orbitals of O at interface, which leads to the weak Pt-O bonding strength. When the Pt adsorption behavior on reduced and oxidized surfaces of metal oxides is compared, we noticed a strong dependence of the Pt binding mechanism and binding energies on the oxidation state of the support surface. Images in Figure 3 suggest that Pt on NbO has a smoother surface than Pt on NbO2and Nb2O5, which could be correlated with a stronger binding of Pt at the interface. However, the growth mechanism of Pt thin films on NbxOyhas
not been fully investigated as of yet. In order to explore this aspect further, we plan to investigate formation of Pt monolayer or films of submonolayer islands on NbxOywith various surface
morphologies.
6. Conclusions
This study examined the ORR activity and electrochemical stability of 5 nm thick Pt films supported by 5 or 10 nm thick
With the use of DFT calculations, we have evaluated effects of oxygen incorporation on stability, electronic structure, and electrochemical activity of Pt|NbxOysystems. Calculated bulk
properties of NbxOy are consistent with data on stability and
conductivity. At the Pt|NbxOyinterface, we observed a transfer
of electronic charge density from Nb, NbO, and NbO2to Pt; the direction of charge transfer is reversed for Nb2O5. The resultant ORR activity of Pt|NbxOyentails the interplay of bulk
electronic properties of the support, Pt|NbxOyinterfacial
proper-ties, and surface electronic structure of Pt.
Acknowledgment. The authors acknowledge the financial
support of NRC NINT and NRC IFCI for this work. We thank Professor Zhuang Lin in Wuhan University (China) for his kindest advice.
References and Notes
(1) Vielstich, W., Lamm, A., Gasteriger, H. A., Eds. Handbook of Fuel
Cells: Fundamentals, Technology, Applications; VCH-Wiley: Weinheim, Germany, 2003.
(2) Eikerling, M.; Kornyshev, A. A.; Kucernak, A. R. Phys. Today
2006, 59, 38–44.
(3) Eikerling, M.; Kornyshev, A. A.; Kulikovsky, A. A. Encyclopedia
of Electrochemistry; Bard, A. J., Stratmann, M., Macdonald, D., Schmuki, P., Eds.; VCH-Wiley: Weinheim, Germany, 2007; Vol. 5, Chapter 8.2, pp 447-543.
(4) Norskov, J. K.; Rossmeisl, J.; Logadottir, R.; Lindquist, L.; Kiychin, J. R.; Bligaard, T.; Jonsson, H. J. Phys. Chem. B 2004, 108, 17886–17892. (5) Wieckowski, A., Savinova, E. R., Vayenas, C. G., Eds. Catalysis
and Electrocatalysis at Nanoparticle Surfaces; Marcel Dekker: New York, 2003.
(6) Bonakdarpour, A.; Lobel, R.; Sheng, S.; Monchesky, T. L.; Dahn, J. R. J. Electrochem. Soc. 2006, 153, A2304–A2313.
(7) Zhang, J.; Mo, Y.; Vukmirovic, M. B.; Klie, R.; Sasaki, K.; Adzic, R. R. J. Phys. Chem. B 2004, 108, 10955–10964.
(8) Gasteiger, H. A.; Kocha, S. S.; Somplli, B.; Wagner, F. T. Appl.
Catal., B 2005, 56, 9–35.
(9) Rinaldo, S. G.; Stumper, J.; Eikerling, M. J. Phys. Chem. C 2010,
114, 5773–5785.
(10) Sasaki, K.; Zhang, L.; Adzic, R. R. Phys. Chem. Chem. Phys. 2008,
10, 159–167.
(11) Orilall, M. C.; Matsumoto, F.; Zhou, Q.; Sai, H.; Abruna, H. D.; DiSalvo, F. J.; Wiesner, U. J. Am. Chem. Soc. 2009, 131, 9389–9395.
(12) Neophytides, S. G.; Murase, K.; Zafeiratos, S.; Papakonstantinou, G.; Paloukis, F. E.; Krstajic, N. V.; Jaksic, M. M. J. Phys. Chem. B 2006,
110, 3030–3042.
(13) Vracar, L. M.; Krstajic, N. V.; Radmilovic, V. R.; Jaksic, M. M. J.
Electroanal. Chem. 2006, 587, 99–107.
(14) Xiong, L.; Manthiram, A. Electrochim. Acta 2001, 49, 4163–4170. (15) Baturina, O. A.; Garsany, Y.; Zega, T. J.; Stroud, R. M.; Schull, T.; Swider-Lyons, K. E. J. Electrochem. Soc. 2008, 155, B1314–B1321. (16) Ueda, A.; Yamada, Y.; Ioroi, T.; Fujiwara, N.; Yasuda, K.; Miyazaki, Y.; Kobayashi, T. Catal. Today 2003, 84, 223–229.
(17) Savadogo, O.; Beck, P. J. Electrochem. Soc. 1996, 143, 3842– 3846.
(18) Sun, Z.; Chiu, H. C.; Tseung, A. C. C. Electrochem. Solid-State
Lett. 2001, 4, E9–E12.
(19) Chen, H. T.; Chio, Y. M.; Liu, M.; Lin, M. C. ChemPhysChem
2007, 8, 849–855.
(20) Gu, Y. J.; Wong, W. T. J. Electrochem. Soc. 2006, 153, A1714– A1718.
(21) Chen, A.; La Russa, D. J.; Miller, B. Langmuir 2004, 20, 9695– 9702.
(22) Saha, M. S.; Li, R. Y.; Cai, M.; Sun, X. L. Electrochem.
Solid-State Lett. 2007, 10, B130–B133.
(23) Martinez, J. I.; Hansen, H. A.; Rossmeisl, J.; Nørskov, J. K. Phys.
ReV. B 2009, 79, 045120.
(24) Mance, A.; Cai, M.; Carriquiry, C.; Ruthkosky, M. S. Oxidation
Resistant Electrode for Fuel Cell. U.S. Patent2006/0188775 A1, Aug 24, 2006.
(25) Dieckmann, G. R.; Langer, S. H. Electrochim. Acta 1998, 44, 437– 444.
(26) Park, K. W.; Seol, K. S. Electrochem. Commun. 2007, 9, 2256– 2260.
(27) Kresse, G.; Joubert, D. Phys. ReV. B 1999, 59, 1758–1775. (28) Blo¨chl, P. E.; Jepsen, O.; Andersen, O. K. Phys. ReV. B 1994, 49, 16223–16233.
(29) Methfessel, M.; Paxton, A. T. Phys. ReV. B 1989, 40, 3616–3621. (30) Reich, C. M.; Kaiser, A.; Irvine, J. T. S. Fuel Cells 2001, 1, 249– 255.
(31) Schaub, R.; Thostrup, P.; Lopez, N.; Laegsgaard, E.; Stensgaad, I.; Nørskov, J. K.; Besenbacher, F. Phys. ReV. Lett. 2001, 87, 266104.
(32) Ophus, C.; Luber, E. J.; Mitlin, D. Phys. ReV. E 2010, 81, 011601. (33) Ophus, C.; Luber, E. J.; Mitlin, D. Acta Mater. 2009, 57, 1327– 1336.
(34) Levich, V. G. In Physicochemical Hydrodynamics; Scriven, L. E., Acrivos, A., Newman, J. Hanratty, T. J., Bmckenstein, S., Rana, W. E., Eds.; Prentice-Hall: Englewood Cliffs, NJ, 1962.
(35) Adzic, R. R.; Wang, J.; Ocko, B. M. Electrochim. Acta 1995, 40, 83–89.
(36) Zhang, J.; Mo, Y.; Vukmirovic, M. B.; Klie, R.; Sasaki, K.; Adzic, R. R. J. Phys. Chem. B 2004, 108, 10955–10964.
(37) Sarapuu, A.; Kasikov, A.; Laaksonen, T.; Kontturi, K.; Tammeveski, K. Electrochim. Acta 2008, 53, 5873–5880.
(38) Xiao, L.; Zhuang, L.; Liu, Y.; Lu, J. T.; Abruna, H. D. J. Am.
Chem. Soc. 2008, 131, 602–608.
(39) Rossmeisl, J.; Logadottir, A.; Nørskov, J. K. Chem. Phys. 2005,
319, 178–184.
(40) Tarasevich, M. R.; Sadkowski, A.; Yeager, E. In ComprehensiVe
Treatise of Electrochemistry; Conway, B., Bockris, J. O., Yeager, E., Khan, S. U. M., Eds.; Plenum Press: New York, 1983, Vol. 7, Chapter 9.
(41) Bolzan, A. A.; Fong, C.; Kennedy, B. J.; Howard, C. J. J. Solid
State Chem. 1994, 113, 9–14.
(42) Gross, A. Theoretical Surface Science; Springer-Verlag: Berlin, Germany, 2003.
(43) Wang, L. Y.; Roudgar, A.; Eikerling, M. J. Phys. Chem. C 2009,
113, 17989–17996.
(44) Bak, T.; Nowotny, J.; Rekas, M.; Sorrell, C. C. J. Phys. Chem.
Solids 2001, 62, 731–735.
(45) Ioannides, T.; Verykios, X. E. J. Catal. 1996, 161, 560–569. (46) Derry, G. N.; Zhang, J. Z. Phys. ReV. B 1989, 39, 1940–1941. (47) Cabeza, G. F.; Castellani, N. J.; Legare, P. J. Phys. Chem. Solids
2006, 67, 690–697.
(48) Cooper, V. R.; Kolpak, A. M.; Yourdshahyan, Y.; Rappe, A. M.
Phys. ReV. B 2005, 72, 081409.
(49) Zangwill, A. Physics at Surfaces; Cambridge University Press: Cambridge, 1988.
(50) Hammer, B. Surf. Sci. 2000, 459, 323–348.
(51) Girault, H. H. Analytical and Physical Electrochemistry; EPFL Press: Lausanne, 2004.
(52) Jacob, T. Fuel Cells 2006, 6, 159–181.
(53) Nørskov, J. K.; Rossmeisl, J.; Logadottir, A.; Lindqvist, L. J. Phys.
Chem. B 2004, 108, 17886–17892.
(54) Roudgar, A.; Eikerling, M.; Van Santen, R. Phys. Chem. Chem.
Phys. 2010, 12, 614–620.
(55) Gottesfeld, S. Electrocatalysis of Oxygen Reduction in Polymer
Electrolyte Fuel Cells: A Brief History and a Critical Examination of Present Theory and Diagnostic; Koper, M., Wieckowski, A., Eds.; Wiley Series on Electrocatalysis and Electrochemistry; Wiley: NJ, 2009; Chapter 1, p 1.
(56) Hammer, B.; Nørskov, J. K. AdV. Catal. 2000, 45, 71–129. (57) Hammer, B.; Nørskov, J. K. Surf. Sci. 1995, 343, 211–220. (58) Zhang, J.; Vukmirovic, M. B.; Adzic, R. R. Angew. Chem., Int.
Ed. 2005, 44, 2132–2315.
(59) Tauster, S. J.; Fung, S. C.; Baker, R. T. K.; Horsley, J. A. Science
1981, 211, 1121–1125.
(60) Sanchez, M. G.; Gazquez, J. L. J. Catal. 1987, 104, 120–135. (61) Stamenkovic, V.; Mun, B. S.; Mayrhofer, K. J. J.; Ross, P. N.; Markovic, N. M.; Rossmeisl, J.; Greeley, J.; Nørskov, J. K. Angew. Chem.,
Int. Ed. 2006, 45, 2897–2901.
(62) Hammer, B.; Nielsen, O. H.; Nørskov, J. K. Catal. Lett. 1997, 46, 31–35.
JP104306J