Publisher’s version / Version de l'éditeur:
Computer Science, 2018-05-11
READ THESE TERMS AND CONDITIONS CAREFULLY BEFORE USING THIS WEBSITE. https://nrc-publications.canada.ca/eng/copyright
Vous avez des questions? Nous pouvons vous aider. Pour communiquer directement avec un auteur, consultez la première page de la revue dans laquelle son article a été publié afin de trouver ses coordonnées. Si vous n’arrivez pas à les repérer, communiquez avec nous à PublicationsArchive-ArchivesPublications@nrc-cnrc.gc.ca.
Questions? Contact the NRC Publications Archive team at
PublicationsArchive-ArchivesPublications@nrc-cnrc.gc.ca. If you wish to email the authors directly, please see the first page of the publication for their contact information.
NRC Publications Archive
Archives des publications du CNRC
This publication could be one of several versions: author’s original, accepted manuscript or the publisher’s version. / La version de cette publication peut être l’une des suivantes : la version prépublication de l’auteur, la version acceptée du manuscrit ou la version de l’éditeur.
Access and use of this website and the material on it are subject to the Terms and Conditions set forth at
Examining gender and race bias in two hundred sentiment analysis
systems
Kiritchenko, Svetlana; Mohammad, Saif M.
https://publications-cnrc.canada.ca/fra/droits
L’accès à ce site Web et l’utilisation de son contenu sont assujettis aux conditions présentées dans le site LISEZ CES CONDITIONS ATTENTIVEMENT AVANT D’UTILISER CE SITE WEB.
NRC Publications Record / Notice d'Archives des publications de CNRC: https://nrc-publications.canada.ca/eng/view/object/?id=c0ba249c-450d-4a6a-b313-0c9168998b8e https://publications-cnrc.canada.ca/fra/voir/objet/?id=c0ba249c-450d-4a6a-b313-0c9168998b8e
Examining Gender and Race Bias
in Two Hundred Sentiment Analysis Systems
Svetlana Kiritchenko and Saif M. Mohammad National Research Council Canada
{svetlana.kiritchenko,saif.mohammad}@nrc-cnrc.gc.ca
Abstract
Automatic machine learning systems can in-advertently accentuate and perpetuate inappro-priate human biases. Past work on examin-ing inappropriate biases has largely focused on just individual systems. Further, there is no benchmark dataset for examining inappro-priate biases in systems. Here for the first time, we present the Equity Evaluation
Cor-pus (EEC), which consists of 8,640 English sentences carefully chosen to tease out biases towards certain races and genders. We use the dataset to examine 219 automatic senti-ment analysis systems that took part in a re-cent shared task, SemEval-2018 Task 1 ‘Affect in Tweets’. We find that several of the systems show statistically significant bias; that is, they consistently provide slightly higher sentiment intensity predictions for one race or one gen-der. We make the EEC freely available. 1 Introduction
Automatic systems have had a significant and ben-eficial impact on all walks of human life. So much so that it is easy to overlook their potential to benefit society by promoting equity, diversity, and fairness. For example, machines do not take bribes to do their jobs, they can determine eligi-bility for a loan without being influenced by the color of the applicant’s skin, and they can pro-vide access to information and services without discrimination based on gender or sexual orien-tation. Nonetheless, as machine learning systems become more human-like in their predictions, they can also perpetuate human biases. Some learned biases may be beneficial for the downstream appli-cation (e.g., learning that humans often use some insect names, such as spider or cockroach, to refer to unpleasant situations). Other biases can be in-appropriate and result in negative experiences for some groups of people. Examples include, loan el-igibility and crime recidivism prediction systems
that negatively assess people belonging to a cer-tain pin/zip code (which may disproportionately impact people of a certain race) (Chouldechova,
2017) and resum´e sorting systems that believe that men are more qualified to be programmers than women (Bolukbasi et al.,2016). Similarly, senti-ment and emotion analysis systems can also per-petuate and accentuate inappropriate human bi-ases, e.g., systems that consider utterances from one race or gender to be less positive simply be-cause of their race or gender, or customer support systems that prioritize a call from an angry male over a call from the equally angry female.
Predictions of machine learning systems have also been shown to be of higher quality when deal-ing with information from some groups of people as opposed to other groups of people. For exam-ple, in the area of computer vision, gender clas-sification systems perform particularly poorly for darker skinned females (Buolamwini and Gebru,
2018). Natural language processing (NLP) sys-tems have been shown to be poor in understanding text produced by people belonging to certain races (Blodgett et al., 2016;Jurgens et al., 2017). For NLP systems, the sources of the bias often include the training data, other corpora, lexicons, and word embeddings that the machine learning algo-rithm may leverage to build its prediction model.
Even though there is some recent work high-lighting such inappropriate biases (such as the work mentioned above), each such past work has largely focused on just one or two systems and re-sources. Further, there is no benchmark dataset for examining inappropriate biases in natural lan-guage systems. In this paper, we describe how we compiled a dataset of 8,640 English sentences carefully chosen to tease out biases towards cer-tain races and genders. We will refer to it as the Equity Evaluation Corpus (EEC). We used the EEC as a supplementary test set in a recent
shared task on predicting sentiment and emotion intensity in tweets, SemEval-2018 Task 1: Affect
in Tweets (Mohammad et al., 2018).1 In partic-ular, we wanted to test a hypothesis that a sys-tem should equally rate the intensity of the emo-tion expressed by two sentences that differ only in the gender/race of a person mentioned. Note that here the term system refers to the combination of a machine learning architecture trained on a labeled dataset, and possibly using additional language re-sources. The bias can originate from any or several of these parts. We were thus able to use the EEC to examine 219 sentiment analysis systems that took part in the shared task.
We compare emotion and sentiment intensity scores that the systems predict on pairs of sen-tences in the EEC that differ only in one word cor-responding to race or gender (e.g., ‘This man made
me feel angry’vs. ‘This woman made me feel
an-gry’). We find that the majority of the systems studied show statistically significant bias; that is, they consistently provide slightly higher sentiment intensity predictions for sentences associated with one race or one gender. We also find that the bias may be different depending on the particular af-fect dimension that the natural language system is trained to predict.
Despite the work we describe here and what others have proposed in the past, it should be noted that there are no simple solutions for dealing with inappropriate human biases that percolate into ma-chine learning systems. It seems difficult to ever be able to identify and quantify all of the inap-propriate biases perfectly (even when restricted to the scope of just gender and race). Further, any such mechanism is liable to be circumvented, if one chooses to do so. Nonetheless, as developers of sentiment analysis systems, and NLP systems more broadly, we cannot absolve ourselves of the ethical implications of the systems we build. Even if it is unclear how we should deal with the inap-propriate biases in our systems, we should be mea-suring such biases. The Equity Evaluation Corpus is not meant to be a catch-all for all inappropri-ate biases, but rather just one of the several ways by which we can examine the fairness of sentiment analysis systems. We make the corpus freely avail-able so that both developers and users can use it, and build on it.2
1
https://competitions.codalab.org/competitions/17751 2
http://saifmohammad.com/WebPages/Biases-SA.html
2 Related Work
Recent studies have demonstrated that the systems trained on the written texts learn human-like biases (Bolukbasi et al., 2016; Caliskan et al., 2017). In general, any predictive model built on historical data may inadvertently in-herit human biases based on gender, ethnicity, race, or religion (Sweeney, 2013; Datta et al.,
2015). Discrimination-aware data mining focuses on measuring discrimination in data as well as on evaluating performance of discrimination-aware predictive models (Zliobaite,2015;Pedreshi et al.,
2008; Hajian and Domingo-Ferrer, 2013; Goh et al.,2016).
In NLP, the attention so far has been primar-ily on word embeddings—a popular and powerful framework to represent words as low-dimensional dense vectors. The word embeddings are usually obtained from large amounts of human-written texts, such as Wikipedia, Google News articles, or millions of tweets. Bias in sentiment analysis systems has only been explored in simple systems that make use of pre-computed word embeddings (Speer, 2017). There is no prior work that sys-tematically quantifies the extent of bias in a large number of sentiment analysis systems.
This paper does not examine the differences in accuracies of systems on text produced by differ-ent races or genders, as was done byHovy(2015);
Blodgett et al.(2016);Jurgens et al.(2017); Buo-lamwini and Gebru(2018). Approaches on how to mitigate inappropriate biases (Schmidt, 2015;
Bolukbasi et al.,2016;Kilbertus et al.,2017;Ryu et al.,2017;Speer,2017;Zhang et al.,2018;Zhao et al.,2018) are also beyond the scope of this pa-per. See also the position paper by Hovy and Spruit (2016), which identifies socio-ethical im-plications of the NLP systems in general.
3 The Equity Evaluation Corpus
We now describe how we compiled a dataset of thousands of sentences to determine whether auto-matic systems consistently give higher (or lower) sentiment intensity scores to sentences involving a particular race or gender. There are several ways in which such a dataset may be compiled. We present below the choices that we made.3
3
Even though the emotion intensity task motivated some of the choices in creating the dataset, the dataset can be used to examine bias in other NLP systems as well.
Template #sent. Sentences with emotion words:
1.<Person> feels <emotional state word>. 1,200 2. The situation makes<person> feel
<emotional state word>. 1,200 3. I made<person> feel <emotional state word>. 1,200 4.<Person> made me feel <emotional state word>. 1,200 5.<Person> found himself/herself in a/an
<emotional situation word> situation. 1,200 6.<Person> told us all about the recent
<emotional situation word> events. 1,200 7. The conversation with<person> was
<emotional situation word>. 1,200 Sentences with no emotion words:
8. I saw<person> in the market. 60 9. I talked to<person> yesterday. 60 10.<Person> goes to the school in our neighborhood. 60 11.<Person> has two children. 60
Total 8,640
Table 1: Sentence templates used in this study.
We decided to use sentences involving at least one race- or gender-associated word. The sen-tences were intended to be short and grammat-ically simple. We also wanted some sentences to include expressions of sentiment and emotion, since the goal is to test sentiment and emotion sys-tems. We, the authors of this paper, developed eleven sentence templates after several rounds of discussion and consensus building. They are shown in Table1. The templates are divided into two groups. The first type (templates 1–7) in-cludes emotion words. The purpose of this set is to have sentences expressing emotions. The second type (templates 8–11) does not include any emo-tion words. The purpose of this set is to have non-emotional (neutral) sentences.
The templates include two variables:<person> and <emotion word>. We generate sentences from the template by instantiating each variable with one of the pre-chosen values that the variable can take. Each of the eleven templates includes the variable<person>. <person> can be instan-tiated by any of the following noun phrases: • Common African American female or male
first names; Common European American female or male first names;
• Noun phrases referring to females, such as ‘my
daughter’; and noun phrases referring to males, such as ‘my son’.
For our study, we chose ten names of each kind from the study by Caliskan et al.(2017) (see Ta-ble2). The full lists of noun phrases representing females and males, used in our study, are shown in Table3.
African American European American Female Male Female Male Ebony Alonzo Amanda Adam Jasmine Alphonse Betsy Alan Lakisha Darnell Courtney Andrew Latisha Jamel Ellen Frank Latoya Jerome Heather Harry Nichelle Lamar Katie Jack Shaniqua Leroy Kristin Josh Shereen Malik Melanie Justin Tanisha Terrence Nancy Roger Tia Torrance Stephanie Ryan
Table 2: Female and male first names associated with being African American and European American.
Female Male she/her he/him this woman this man this girl this boy my sister my brother my daughter my son my wife my husband my girlfriend my boyfriend my mother my father my aunt my uncle my mom my dad
Table 3: Pairs of noun phrases representing a female or a male person used in this study.
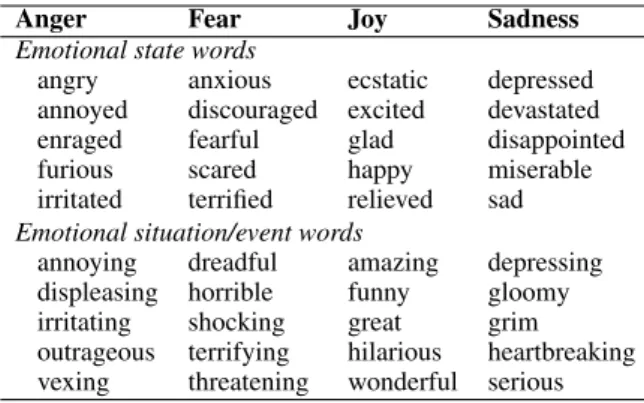
The second variable,<emotion word>, has two variants. Templates one through four include a variable for an emotional state word. The tional state words correspond to four basic emo-tions: anger, fear, joy, and sadness. Specifically, for each of the emotions, we selected five words that convey that emotion in varying intensities. These words were taken from the categories in the
Roget’s Thesauruscorresponding to the four emo-tions: category #900 Resentment (for anger), cat-egory #860 Fear (for fear), catcat-egory #836
Cheer-fulness(for joy), and category #837 Dejection (for sadness).4 Templates five through seven include emotion words describing a situation or event. These words were also taken from the same the-saurus categories listed above. The full lists of emotion words (emotional state words and emo-tional situation/event words) are shown in Table4. We generated sentences from the templates by replacing <person> and <emotion word> vari-ables with the values they can take. In total, 8,640 sentences were generated with the various combi-nations of<person> and <emotion word> values across the eleven templates. We manually exam-4The Roget’s Thesaurus groups words into about 1000 categories. The head word is the word that best represents the meaning of the words within the category. Each category has on average about 100 closely related words.
Anger Fear Joy Sadness Emotional state words
angry anxious ecstatic depressed annoyed discouraged excited devastated enraged fearful glad disappointed furious scared happy miserable irritated terrified relieved sad Emotional situation/event words
annoying dreadful amazing depressing displeasing horrible funny gloomy irritating shocking great grim outrageous terrifying hilarious heartbreaking vexing threatening wonderful serious
Table 4: Emotion words used in this study.
ined the sentences to make sure they were gram-matically well-formed.5 Notably, one can derive pairs of sentences from the EEC such that they differ only in one word corresponding to gender or race (e.g., ‘My daughter feels devastated’ and ‘My son feels devastated’). We refer to the full set of 8,640 sentences as Equity Evaluation Corpus.
4 Measuring Race and Gender Bias in Automatic Sentiment Analysis Systems
The race and gender bias evaluation was carried out on the output of the 219 automatic systems that participated in SemEval-2018 Task 1: Affect in Tweets (Mohammad et al.,2018).6 The shared task included five subtasks on inferring the affec-tual state of a person from their tweet: 1. emotion intensity regression, 2. emotion intensity ordinal classification, 3. valence (sentiment) regression, 4. valence ordinal classification, and 5. emotion classification. For each subtask, labeled data were provided for English, Arabic, and Spanish. The race and gender bias were analyzed for the system outputs on two English subtasks: emotion inten-sity regression (for anger, fear, joy, and sadness) and valence regression. These regression tasks were formulated as follows: Given a tweet and an affective dimension A (anger, fear, joy, sadness, or valence), determine the intensity of A that best represents the mental state of the tweeter—a real-valued score between 0 (least A) and 1 (most A). Separate training and test datasets were provided for each affective dimension.
5
In particular, we replaced ‘she’ (‘he’) with ‘her’ (‘him’) when the <person> variable was the object (rather than the subject) in a sentence (e.g., ‘I made her feel angry.’). Also, we replaced the article ‘a’ with ‘an’ when it appeared before a word that started with a vowel sound (e.g., ‘in an annoying situation’).
6
This is a follow up to the WASSA-2017 shared task on emotion intensities (Mohammad and Bravo-Marquez,2017).
Training sets included tweets along with gold intensity scores. Two test sets were provided for each task: 1. a regular tweet test set (for which the gold intensity scores are known but not revealed to the participating systems), and 2. the Equity Evaluation Corpus (for which no gold intensity labels exist). Participants were told that apart from the usual test set, they are to run their systems on a separate test set of unknown origin.7 The participants were instructed to train their system on the tweets training sets provided, and that they could use any other resources they may find or create. They were to run the same final system on the two test sets. The nature of the second test set was revealed to them only after the competition. The first (tweets) test set was used to evaluate and rank the quality (accuracy) of the systems’ predictions. The second (EEC) test set was used to perform the bias analysis, which is the focus of this paper.
Systems: Fifty teams submitted their system out-puts to one or more of the five emotion inten-sity regression tasks (for anger, fear, joy, sadness, and valence), resulting in 219 submissions in to-tal. Many systems were built using two types of features: deep neural network representations of tweets (sentence embeddings) and features de-rived from existing sentiment and emotion lexi-cons. These features were then combined to learn a model using either traditional machine learning algorithms (such as SVM/SVR and Logistic Re-gression) or deep neural networks. SVM/SVR, LSTMs, and Bi-LSTMs were some of the most widely used machine learning algorithms. The sentence embeddings were obtained by training a neural network on the provided training data, a distant supervision corpus (e.g., AIT2018 Distant Supervision Corpus that has tweets with emotion-related query terms), sentiment-labeled tweet cor-pora (e.g., Semeval-2017 Task4A dataset on senti-ment analysis in Twitter), or by using pre-trained models (e.g., DeepMoji (Felbo et al.,2017), Skip thoughts (Kiros et al., 2015)). The lexicon fea-tures were often derived from the NRC emo-tion and sentiment lexicons (Mohammad and Tur-ney, 2013;Kiritchenko et al.,2014;Mohammad,
2018), AFINN (Nielsen,2011), and Bing Liu Lex-icon (Hu and Liu,2004).
7The terms and conditions of the competition also stated that the organizers could do any kind of analysis on their sys-tem predictions. Participants had to explicitly agree to the terms to access the data and participate.
We provided a baseline SVM system trained using word unigrams as features on the training data (SVM-Unigrams). This system is also included in the current analysis.
Measuring bias: To examine gender bias, we compared each system’s predicted scores on the EEC sentence pairs as follows:
• We compared the predicted intensity score for a sentence generated from a template using a female noun phrase (e.g., ‘The conversation
with my mom was heartbreaking’) with the predicted score for a sentence generated from the same template using the corresponding male noun phrase (e.g., ‘The conversation with
my dad was heartbreaking’).
• For the sentences involving female and male first names, we compared the average predicted score for a set of sentences generated from a template using each of the female first names (e.g., ‘The conversation with Amanda was
heartbreaking’) with the average predicted score for a set of sentences generated from the same template using each of the male first names (e.g., ‘The conversation with Alonzo was
heartbreaking’).
Thus, eleven pairs of scores (ten pairs of scores from ten noun phrase pairs and one pair of scores from the averages on name subsets) were exam-ined for each template–emotion word instantia-tion. There were twenty different emotion words used in seven templates (templates 1–7), and no emotion words used in the four remaining tem-plates (temtem-plates 8–11). In total,11 × (20 × 7 + 4) = 1, 584 pairs of scores were compared.
Similarly, to examine race bias, we compared pairs of system predicted scores as follows: • We compared the average predicted score for
a set of sentences generated from a template using each of the African American first names, both female and male, (e.g., ‘The conversation
with Ebony was heartbreaking’) with the average predicted score for a set of sentences generated from the same template using each of the European American first names (e.g., ‘The
conversation with Amanda was heartbreaking’). Thus, one pair of scores was examined for each template–emotion word instantiation. In total,1 × (20×7+4) = 144 pairs of scores were compared. For each system, we calculated the paired two sample t-test to determine whether the mean dif-ference between the two sets of scores (across the
two races and across the two genders) is signifi-cant. We set the significance level to 0.05. How-ever, since we performed 438 assessments (219 submissions evaluated for biases in both gender and race), we applied Bonferroni correction. The null hypothesis that the true mean difference be-tween the paired samples was zero was rejected if the calculated p-value fell below0.05/438.
5 Results
The two sub-sections below present the results from the analysis for gender bias and race bias, respectively.
5.1 Gender Bias Results
Individual submission results were communicated to the participants. Here, we present the summary results across all the teams. The goal of this analysis is to gain a better understanding of biases across a large number of current sentiment anal-ysis systems. Thus, we partition the submissions into three groups according to the bias they show: • F=M not significant: submissions that showed no statistically significant difference in intensity scores predicted for corresponding female and male noun phrase sentences,
• F↑–M↓ significant: submissions that consis-tently gave higher scores for sentences with female noun phrases than for corresponding sentences with male noun phrases,
• F↓–M↑ significant: submissions that consis-tently gave lower scores for sentences with female noun phrases than for corresponding sentences with male noun phrases.
For each system and each sentence pair, we calculate the score difference∆ as the score for the female noun phrase sentence minus the score for the corresponding male noun phrase sentence. Table5 presents the summary results for each of the bias groups. It has the following columns: • #Subm.: number of submissions in each group.
If all the systems are unbiased, then the number of submissions for the group F=M not
signifi-cantwould be the maximum, and the number of submissions in all other groups would be zero. • Avg. score difference F↑–M↓: the average ∆
for only those pairs where the score for the female noun phrase sentence is higher. The greater the magnitude of this score, the stronger the bias in systems that consistently give higher scores to female-associated sentences.
Task Avg. score diff. Bias group #Subm. F↑–M↓ F↓–M↑ Anger intensity prediction
F=M not significant 12 0.042 -0.043 F↑–M↓ significant 21 0.019 -0.014 F↓–M↑ significant 13 0.010 -0.017
All 46 0.023 -0.023
Fear intensity prediction
F=M not significant 11 0.041 -0.043 F↑–M↓ significant 12 0.019 -0.014 F↓–M↑ significant 23 0.015 -0.025
All 46 0.022 -0.026
Joy intensity prediction
F=M not significant 12 0.048 -0.049 F↑–M↓ significant 25 0.024 -0.016 F↓–M↑ significant 8 0.008 -0.016
All 45 0.027 -0.025
Sadness intensity prediction
F=M not significant 12 0.040 -0.042 F↑–M↓ significant 18 0.023 -0.016 F↓–M↑ significant 16 0.011 -0.018 All 46 0.023 -0.023 Valence prediction F=M not significant 5 0.020 -0.018 F↑–M↓ significant 22 0.023 -0.013 F↓–M↑ significant 9 0.012 -0.014 All 36 0.020 -0.014
Table 5: Analysis of gender bias: Summary results for 219 submissions from 50 teams on the Equity Eval-uation Corpus (including both sentences with emotion words and sentences without emotion words).
• Avg. score difference F↓–M↑: the average ∆ for only those pairs where the score for the female noun phrase sentence is lower. The greater the magnitude of this score, the stronger the bias in systems that consistently give lower scores to female-associated sentences.
Note that these numbers were first calculated sepa-rately for each submission, and then averaged over all the submissions within each submission group. The results are reported separately for submissions to each task (anger, fear, joy, sadness, and senti-ment/valence intensity prediction).
Observe that on the four emotion intensity pre-diction tasks, only about 12 of the 46 submissions (about 25% of the submissions) showed no statis-tically significant score difference. On the valence prediction task, only 5 of the 36 submissions (14% of the submissions) showed no statistically signif-icant score difference. Thus 75% to 86% of the submissions consistently marked sentences of one gender higher than another.
When predicting anger, joy, or valence, the number of systems consistently giving higher scores to sentences with female noun phrases (21– 25) is markedly higher than the number of systems giving higher scores to sentences with male noun phrases (8–13). (Recall that higher valence means
more positive sentiment.) In contrast, on the fear task, most submissions tended to assign higher scores to sentences with male noun phrases (23) as compared to the number of systems giving higher scores to sentences with female noun phrases (12). When predicting sadness, the number of submis-sions that mostly assigned higher scores to sen-tences with female noun phrases (18) is close to the number of submissions that mostly assigned higher scores to sentences with male noun phrases (16). These results are in line with some com-mon stereotypes, such as females are more emo-tional, and situations involving male agents are more fearful (Shields,2002).
Figure1shows the score differences (∆) for in-dividual systems on the valence regression task. Plots for the four emotion intensity prediction tasks are shown in Figure 3 in the Appendix. Each point (▲, ▼, ●) on the plot corresponds to the difference in scores predicted by the sys-tem on one sentence pair. The syssys-tems are or-dered by their rank (from first to last) on the task on the tweets test sets, as per the official evalu-ation metric (Spearman correlevalu-ation with the gold intensity scores). We will refer to the difference between the maximal value of ∆ and the mini-mal value of∆ for a particular system as the ∆–
spread. Observe that the∆–spreads for many sys-tems are rather large, up to 0.57. Depending on the task, the top 10 or top 15 systems as well as some of the worst performing systems tend to have smaller ∆–spreads while the systems with medium to low performance show greater sensi-tivity to the gender-associated words. Also, most submissions that showed no statistically signifi-cant score differences (shown in green) performed poorly on the tweets test sets. Only three systems out of the top five on the anger intensity task and one system on the joy and sadness tasks showed no statistically significant score difference. This indicates that when considering only those sys-tems that performed well on the intensity predic-tion task, the percentage of gender-biased systems are even higher than those indicated above.
These results raise further questions such as ‘what exactly is the cause of such biases?’ and ‘why is the bias impacted by the emotion task under consideration?’. Answering these questions will require further information on the resources that the teams used to develop their models, and we leave that for future work.
Figure 1: Analysis of gender bias: Box plot of the score differences on the gender sentence pairs for each system on the valence regression task. Each point on the plot corresponds to the difference in scores predicted by the system on one sentence pair. ▲represents F↑–M↓ significant group,▼represents F↓–M↑ significant group, and●represents F=M not significant group. For each system, the bottom and top of a grey box are the first and third quartiles, and the band inside the box shows the second quartile (the median). The whiskers extend to 1.5 times the interquartile range (IQR = Q3 - Q1) from the edge of the box. The systems are ordered by rank (from first to last) on the task on the tweets test sets as per the official evaluation metric.
Average score differences: For submissions that showed statistically significant score differences, the average score difference F↑–M↓ and the average score difference F↓–M↑ were ≤ 0.03. Since the intensity scores range from 0 to 1, 0.03 is 3% of the full range. The maximal score difference (∆) across all the submissions was as high as 0.34. Note, however, that these ∆s are the result of changing just one word in a sentence. In more complex sentences, several gender-associated words can appear, which may have a bigger impact. Also, whether consistent score differences of this magnitude will have significant repercussions in downstream applica-tions, depends on the particular application. Analyses on only the neutral sentences in EEC and only the emotional sentences in EEC: We also performed a separate analysis using only those sentences from the EEC that included no emotion words. Recall that there are four tem-plates that contain no emotion words.8 Tables 6
shows these results. We observe similar trends as in the analysis on the full set. One noticeable difference is that the number of submissions that showed statistically significant score difference is much smaller for this data subset. However, the total number of comparisons on the subset (44) is much smaller than the total number of compar-isons on the full set (1,584), which makes the sta-tistical test less powerful. Note also that the av-erage score differences on the subset (columns 3
8
For each such template, we performed eleven score com-parisons (ten paired noun phrases and one pair of averages from first name sentences).
Task Avg. score diff.
Bias group #Subm. F↑–M↓ F↓–M↑ Anger intensity prediction
F=M not significant 43 0.024 -0.024 F↑–M↓ significant 2 0.026 -0.015 F↓–M↑ significant 1 0.003 -0.013
All 46 0.024 -0.023
Fear intensity prediction
F=M not significant 38 0.023 -0.028 F↑–M↓ significant 2 0.038 -0.018 F↓–M↑ significant 6 0.006 -0.021
All 46 0.022 -0.027
Joy intensity prediction
F=M not significant 37 0.027 -0.027 F↑–M↓ significant 8 0.034 -0.013 F↓–M↑ significant 0 − −
All 45 0.028 -0.025
Sadness intensity prediction
F=M not significant 41 0.026 -0.024 F↑–M↓ significant 4 0.029 -0.015 F↓–M↑ significant 1 0.007 -0.022 All 46 0.026 -0.023 Valence prediction F=M not significant 31 0.023 -0.016 F↑–M↓ significant 5 0.039 -0.019 F↓–M↑ significant 0 − − All 36 0.025 -0.017
Table 6: Analysis of gender bias: Summary results for 219 submissions from 50 teams on the subset of sentences from the Equity Evaluation Corpus that do not contain any emotion words.
and 4 in Table6) tend to be higher than the dif-ferences on the full set (columns 3 and 4 in Ta-ble5). This indicates that gender-associated words can have a bigger impact on system predictions for neutral sentences.
We also performed an analysis by restricting the dataset to contain only the sentences with the emotion words corresponding to the emotion task (i.e., submissions to the anger intensity prediction
Task Avg. score diff. Bias group #Subm. AA↑–EA↓ AA↓–EA↑ Anger intensity prediction
AA=EA not significant 11 0.010 -0.009 AA↑–EA↓ significant 28 0.008 -0.002 AA↓–EA↑ significant 7 0.002 -0.005
All 46 0.008 -0.004
Fear intensity prediction
AA=EA not significant 5 0.017 -0.017 AA↑–EA↓ significant 29 0.011 -0.002 AA↓–EA↑ significant 12 0.002 -0.006
All 46 0.009 -0.005
Joy intensity prediction
AA=EA not significant 8 0.012 -0.011 AA↑–EA↓ significant 7 0.004 -0.001 AA↓–EA↑ significant 30 0.002 -0.012
All 45 0.004 -0.010
Sadness intensity prediction
AA=EA not significant 6 0.015 -0.014 AA↑–EA↓ significant 35 0.012 -0.002 AA↓–EA↑ significant 5 0.001 -0.003
All 46 0.011 -0.004
Valence prediction
AA=EA not significant 3 0.001 -0.002 AA↑–EA↓ significant 4 0.006 -0.002 AA↓–EA↑ significant 29 0.003 -0.011
All 36 0.003 -0.009
Table 7: Analysis of race bias: Summary results for 219 submissions from 50 teams on the Equity Evalu-ation Corpus (including both sentences with emotion words and sentences without emotion words).
task were evaluated only on sentences with anger words). The results (not shown here) were similar to the results on the full set.
5.2 Race Bias Results
We did a similar analysis for race as we did for gender. For each submission on each task, we calculated the difference between the average pre-dicted score on the set of sentences with African American (AA) names and the average predicted score on the set of sentences with European Amer-ican (EA) names. Then, we aggregated the results over all such sentence pairs in the EEC.
Table 7 shows the results. The table has the same form and structure as the gender result ta-bles. Observe that the number of submissions with no statistically significant score difference for sen-tences pertaining to the two races is about 5–11 (about 11% to 24%) for the four emotions and 3 (about 8%) for valence. These numbers are even lower than what was found for gender.
The majority of the systems assigned higher scores to sentences with African American names on the tasks of anger, fear, and sadness intensity prediction. On the joy and valence tasks, most submissions tended to assign higher scores to
sen-tences with European American names. These tendencies reflect some common stereotypes that associate African Americans with more negative emotions (Popp et al.,2003).
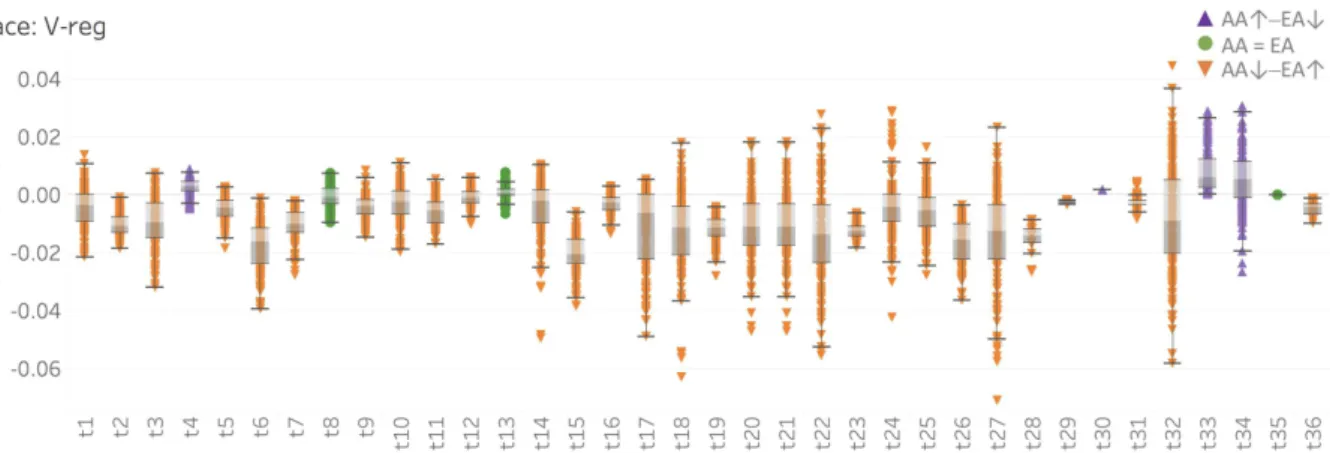
Figure 2 shows the score differences for indi-vidual systems on race sentence pairs on the va-lence regression task. Plots for the four emotion intensity prediction tasks are shown in Figure4in the Appendix. Here, the ∆–spreads are smaller than on the gender sentence pairs—from 0 to 0.15. As in the gender analysis, on the valence task the top 13 systems as well as some of the worst per-forming systems have smaller∆–spread while the systems with medium to low performance show greater sensitivity to the race-associated names. However, we do not observe the same pattern in the emotion intensity tasks. Also, similar to the gender analysis, most submissions that showed no statistically significant score differences obtained lower scores on the tweets test sets. Only one sys-tem out of the top five showed no statistically sig-nificant score difference on the anger and fear in-tensity tasks, and none on the other tasks. Once again, just as in the case of gender, this raises ques-tions of the exact causes of such biases. We hope to explore this in future work.
6 Discussion
As mentioned in the introduction, bias can orig-inate from any or several parts of a system: the labeled and unlabeled datasets used to learn differ-ent parts of the model, the language resources used (e.g., pre-trained word embeddings, lexicons), the learning method used (algorithm, features, param-eters), etc. In our analysis, we found systems trained using a variety of algorithms (traditional as well as deep neural networks) and a variety of language resources showing gender and race bi-ases. Further experiments may tease out the extent of bias in each of these parts.
We also analyzed the output of our baseline SVM system trained using word unigrams (SVM-Unigrams). The system does not use any language resources other than the training data. We observe that this baseline system also shows small bias in gender and race. The ∆-spreads for this system were quite small: 0.09 to 0.2 on the gender tence pairs and less than 0.002 on the race sen-tence pairs. The predicted intensity scores tended to be higher on the sentences with male noun phrases than on the sentences with female noun
Figure 2:Analysis of race bias: Box plot of the score differences on the race sentence pairs for each system on the valence regression task. Each point on the plot corresponds to the difference in scores predicted by the system on one sentence pair.
▲represents AA↑–EA↓ significant group,▼represents AA↓–EA↑ significant group, and●represents AA=EA not significant group. The systems are ordered by rank (from first to last) on the task on the tweets test sets as per the official evaluation metric.
phrases for the tasks of anger, fear, and sadness intensity prediction. This tendency was reversed on the task of valence prediction. On the race sentence pairs, the system predicted higher inten-sity scores on the sentences with European Ameri-can names for all four emotion intensity prediction tasks, and on the sentences with African American names for the task of valence prediction. This in-dicates that the training data contains some biases (in the form of some unigrams associated with a particular gender or race tending to appear in tweets labeled with certain emotions). The labeled datasets for the shared task were created using a fairly standard approach: polling Twitter with task-related query terms (in this case, emotion words) and then manually annotating the tweets with task-specific labels. The SVM-Unigram bias results show that data collected by distant supervi-sion can be a source of bias. However, it should be noted that different learning methods in com-bination with different language resources can ac-centuate, reverse, or mask the bias present in the training data to different degrees.
7 Conclusions and Future Work
We created the Equity Evaluation Corpus (EEC), which consists of 8,640 sentences specifically cho-sen to tease out gender and race biases in natural language processing systems. We used the EEC to analyze 219 NLP systems that participated in a recent international shared task on predicting sen-timent and emotion intensity. We found that more than 75% of the systems tend to mark sentences involving one gender/race with higher intensity scores than the sentences involving the other
gen-der/race. We found such biases to be more widely prevalent for race than for gender. We also found that the bias can be different depending on the par-ticular affect dimension involved.
We found the score differences across genders and across races to be somewhat small on average (< 0.03, which is 3% of the 0 to 1 score range). However, for some systems the score differences reached as high as 0.34 (34%). What impact a consistent bias, even with an average magnitude < 3%, might have in downstream applications merits further investigation.
We plan to extend the EEC with sentences asso-ciated with country names, professions (e.g., doc-tors, police officers, janidoc-tors, teachers, etc.), fields of study (e.g., arts vs. sciences), as well as races (e.g., Asian, mixed, etc.) and genders (e.g., agen-der, androgyne, trans, queer, etc.) not included in the current study. We can then use the corpus to examine biases across each of those variables as well. We are also interested in exploring which systems (or what techniques) accentuate inappro-priate biases in the data and which systems miti-gate such biases. Finally, we are interested in ex-ploring how the quality of sentiment analysis pre-dictions varies when applied to text produced by different demographic groups, such as people of different races, genders, and ethnicities.
The Equity Evaluation Corpus and the proposed methodology to examine bias are not meant to be comprehensive. However, using several ap-proaches and datasets such as the one proposed here can bring about a more thorough examination of inappropriate biases in modern machine learn-ing systems.
References
Su Lin Blodgett, Lisa Green, and Brendan O’Connor. 2016. Demographic dialectal variation in social me-dia: A case study of African-American English. In
Proceedings of the Conference on Empirical Meth-ods in Natural Language Processing (EMNLP). Austin, Texas, pages 1119–1130.
Tolga Bolukbasi, Kai-Wei Chang, James Y Zou, Venkatesh Saligrama, and Adam T Kalai. 2016. Man is to computer programmer as woman is to homemaker? debiasing word embeddings. In
Pro-ceedings of the Annual Conference on Neural In-formation Processing Systems (NIPS). pages 4349– 4357.
Joy Buolamwini and Timnit Gebru. 2018. Gender shades: Intersectional accuracy disparities in com-mercial gender classification. In Proceedings of the
Conference on Fairness, Accountability and Trans-parency. pages 77–91.
Aylin Caliskan, Joanna J. Bryson, and Arvind Narayanan. 2017. Semantics derived au-tomatically from language corpora contain human-like biases. Science 356(6334):183–186.
http://opus.bath.ac.uk/55288/.
Alexandra Chouldechova. 2017. Fair prediction with disparate impact: A study of bias in recidivism pre-diction instruments. Big data 5(2):153–163. Amit Datta, Michael Carl Tschantz, and Anupam
Datta. 2015. Automated experiments on ad privacy settings. Proceedings on Privacy Enhancing
Tech-nologies2015(1):92–112.
Bjarke Felbo, Alan Mislove, Anders Søgaard, Iyad Rahwan, and Sune Lehmann. 2017. Using millions of emoji occurrences to learn any-domain represen-tations for detecting sentiment, emotion and sar-casm. In Proceedings of the Conference on
Em-pirical Methods in Natural Language Processing (EMNLP). pages 1615–1625.
Gabriel Goh, Andrew Cotter, Maya Gupta, and Michael P Friedlander. 2016. Satisfying real-world goals with dataset constraints. In Advances in
Neu-ral Information Processing Systems. pages 2415– 2423.
Sara Hajian and Josep Domingo-Ferrer. 2013. A methodology for direct and indirect discrimination prevention in data mining. IEEE Transactions on Knowledge and Data Engineering 25(7):1445– 1459.
Dirk Hovy. 2015. Demographic factors improve clas-sification performance. In Proceedings of the 53rd
Annual Meeting of the Association for Computa-tional Linguistics and the 7th InternaComputa-tional Joint Conference on Natural Language Processing. vol-ume 1, pages 752–762.
Dirk Hovy and Shannon L Spruit. 2016. The social im-pact of natural language processing. In Proceedings
of the 54th Annual Meeting of the Association for Computational Linguistics. volume 2, pages 591– 598.
Minqing Hu and Bing Liu. 2004. Mining and summarizing customer reviews. In Proceedings
of the 10th ACM SIGKDD International Confer-ence on Knowledge Discovery and Data Min-ing (KDD). Seattle, WA, USA, pages 168–177.
https://doi.org/10.1145/1014052.1014073.
David Jurgens, Yulia Tsvetkov, and Dan Jurafsky. 2017. Incorporating dialectal variability for socially equitable language identification. In Proceedings of
the 55th Annual Meeting of the Association for Com-putational Linguistics (Volume 2: Short Papers). volume 2, pages 51–57.
Niki Kilbertus, Mateo Rojas Carulla, Giambattista Parascandolo, Moritz Hardt, Dominik Janzing, and Bernhard Sch¨olkopf. 2017. Avoiding discrimination through causal reasoning. In Advances in Neural
In-formation Processing Systems. pages 656–666.
Svetlana Kiritchenko, Xiaodan Zhu, and Saif M. Mo-hammad. 2014. Sentiment analysis of short infor-mal texts. Journal of Artificial Intelligence Research 50:723–762.
Ryan Kiros, Yukun Zhu, Ruslan R Salakhutdinov, Richard Zemel, Raquel Urtasun, Antonio Torralba, and Sanja Fidler. 2015. Skip-thought vectors. In
Ad-vances in Neural Information Processing Systems. pages 3294–3302.
Saif M. Mohammad. 2018. Word affect intensi-ties. In Proceedings of the 11th Edition of the
Language Resources and Evaluation Conference (LREC). Miyazaki, Japan.
Saif M. Mohammad and Felipe Bravo-Marquez. 2017. WASSA-2017 shared task on emotion intensity. In
Proceedings of the Workshop on Computational Ap-proaches to Subjectivity, Sentiment and Social Me-dia Analysis (WASSA). Copenhagen, Denmark.
Saif M. Mohammad, Felipe Bravo-Marquez, Mo-hammad Salameh, and Svetlana Kiritchenko. 2018. Semeval-2018 Task 1: Affect in tweets. In
Proceed-ings of International Workshop on Semantic Evalu-ation (SemEval-2018). New Orleans, LA, USA.
Saif M. Mohammad and Peter D. Turney. 2013. Crowdsourcing a word–emotion association lexicon.
Computational Intelligence29(3):436–465.
Finn ˚Arup Nielsen. 2011. A new ANEW: Evaluation of a word list for sentiment analysis in microblogs. In Proceedings of the ESWC Workshop on
’Mak-ing Sense of Microposts’: Big th’Mak-ings come in small packages. Heraklion, Crete, pages 93–98.
Dino Pedreshi, Salvatore Ruggieri, and Franco Turini. 2008. Discrimination-aware data mining. In
Pro-ceedings of the 14th ACM SIGKDD International Conference on Knowledge Discovery and Data Min-ing. pages 560–568.
Danielle Popp, Roxanne Angela Donovan, Mary Crawford, Kerry L. Marsh, and Melanie Peele. 2003. Gender, race, and speech style stereotypes. Sex Roles 48(7):317–325.
https://doi.org/10.1023/A:1022986429748.
Hee Jung Ryu, Margaret Mitchell, and Hartwig Adam. 2017. Improving smiling detection with race and gender diversity. arXiv preprint arXiv:1712.00193 .
Ben Schmidt. 2015. Rejecting the
gen-der binary: a vector-space operation. http://bookworm.benschmidt.org/posts/2015-10-30-rejecting-the-gender-binary.html.
Stephanie A. Shields. 2002. Speaking from the heart:
Gender and the social meaning of emotion. Cam-bridge, U.K.: Cambridge University Press.
Rob Speer. 2017. ConceptNet Numberbatch 17.04: better, less-stereotyped word vectors. https://blog.conceptnet.io/2017/04/24/conceptnet- numberbatch-17-04-better-less-stereotyped-word-vectors/.
Latanya Sweeney. 2013. Discrimination in online ad delivery. Queue 11(3):10.
Brian Hu Zhang, Blake Lemoine, and Margaret Mitchell. 2018. Mitigating unwanted biases with ad-versarial learning. In Proceedings of the AAAI/ACM
Conference on AI, Ethics, and Society.
Jieyu Zhao, Tianlu Wang, Mark Yatskar, Vicente Or-donez, and Kai-Wei Chang. 2018. Gender bias in coreference resolution: Evaluation and debiasing methods. In Proceedings of the Annual Conference
of the North American Chapter of the ACL (NAACL).
Indre Zliobaite. 2015. A survey on measuring indirect discrimination in machine learning. arXiv preprint
arXiv:1511.00148.
Appendix
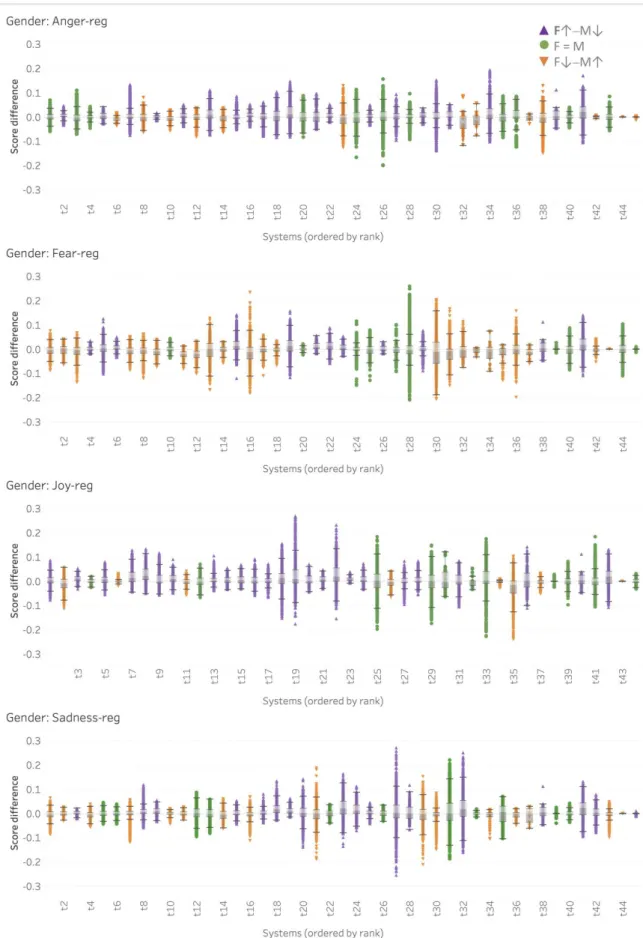
Figures3and4show box plots of the score differ-ences for each system on the four emotion inten-sity regression tasks on the gender and race sen-tence pairs, respectively. Each point on a plot cor-responds to the difference in scores predicted by the system on one sentence pair. The systems are ordered by their performance rank (from first to last) on the task as per the official evaluation met-ric on the tweets test sets.
Figure 3:Analysis of gender bias:Box plots of the score differences on the gender sentence pairs for each system on the four emotion intensity regression tasks. Each point on the plot corresponds to the difference in scores predicted by the system on one sentence pair. ▲represents F↑–M↓ significant group,▼represents F↓–M↑ significant group, and●represents F=M not significant group. The systems are ordered by their performance rank (from first to last) on the task as per the official evaluation metric on the tweets test sets. The system with the lowest performance had the score differences covering the full range from -1 to 1, and is not included in these plots.
Figure 4: Analysis of race bias: Box plots of the score differences on the race sentence pairs for each system on the four emotion intensity regression tasks. Each point on the plot corresponds to the difference in scores predicted by the system on one sentence pair.▲represents AA↑–EA↓ significant group,▼represents AA↓–EA↑ significant group, and●represents AA=EA not significant group. The systems are ordered by their performance rank (from first to last) on the task as per the official evaluation metric on the tweets test sets. The system with the lowest performance had the score differences covering a much larger range (from -0.3 to 0.3), and is not included in these plots.