Vous avez des questions? Nous pouvons vous aider. Pour communiquer directement avec un auteur, consultez la Questions? Contact the NRC Publications Archive team at
PublicationsArchive-ArchivesPublications@nrc-cnrc.gc.ca. If you wish to email the authors directly, please see the first page of the publication for their contact information.
https://publications-cnrc.canada.ca/fra/droits
L’accès à ce site Web et l’utilisation de son contenu sont assujettis aux conditions présentées dans le site LISEZ CES CONDITIONS ATTENTIVEMENT AVANT D’UTILISER CE SITE WEB.
READ THESE TERMS AND CONDITIONS CAREFULLY BEFORE USING THIS WEBSITE. https://nrc-publications.canada.ca/eng/copyright
NRC Publications Archive Record / Notice des Archives des publications du CNRC : https://nrc-publications.canada.ca/eng/view/object/?id=364b682c-3ecc-4dec-9c74-8d9c270bf9c8 https://publications-cnrc.canada.ca/fra/voir/objet/?id=364b682c-3ecc-4dec-9c74-8d9c270bf9c8
NRC Publications Archive
Archives des publications du CNRC
Access and use of this website and the material on it are subject to the Terms and Conditions set forth at
The Influence of Type of Organo-Nanoclay and Preparation Methods on Curing Kinetics and Mechanical Properties of Epoxy Nanocomposites
The Influence of Type of Organo-Nanoclay and Preparation Methods on
Curing Kinetics and Mechanical Properties of Epoxy Nanocomposites
T.-D. Ngo1, M.-T. Ton-That2, S. V. Hoa1,K. C. Cole2
1
Department of Mechanical & Industrial Engineering, Concordia University 1455 De Maisonneuve Blvd., Montreal, Quebec, Canada H3G 1M8
2
National Research Council Canada, Industrial Materials Institute 75 De Mortagne Blvd., Boucherville, Quebec, Canada J4B 6Y4
ABSTRACT
The effect of two different organo-nanoclays and two different mixing methods on the cure mechanism, kinetics, and properties of epoxy nanocomposites based on Epon 828 and Epicure 3046 was studied. The two kinds of organo-nanoclay, both based on natural montmorillonite but differing in intercalant chemistry, were Nanomer® I.30E (treated with a long-chain primary amine intercalant) and Cloisite® 30B (treated with a quaternary ammonium intercalant, less reactive with epoxy than the primary amine). The two mixing processes used to prepare the nanocomposites were (i) a direct process, in which the clay and epoxy are mixed at room temperature, and (ii) a high-temperature process, in which the clay and epoxy are mixed at 120°C for one hour by means of mechanical mixing. The heat evolution of the epoxy resin formulation and its nanocomposite systems was measured during dynamic DSC scans at heating rates of 2.5, 5, 10, 15, and 20°C·min-1. The cure kinetics of these systems was modelled by means of different approaches. Kissinger and isoconversional models were used to calculate the kinetics parameters while the Avrami model was utilized to compare the cure behavior of the epoxy systems. The cure kinetics and mechanical properties were found to be influenced by the presence of nanoclay, by the type of intercalant, and by the mixing method.
Key words: nanoclay, epoxy, nanocomposites, cure kinetics, DSC, mechanical properties
INTRODUCTION
Clay nanolayers have been shown to be very effective reinforcements in epoxy systems [1-3]. Naturally occurring clay is very hydrophilic and therefore not highly compatible with the epoxy matrix, resulting in poor dispersion and a weak interface. To improve the interfacial interaction between the nanoclay and the matrix, surface modification of the nanoclay by organic compounds (so-called “intercalants”) is essential. The most popular intercalants are compounds based on onium ions, which contain an amine cation and a long hydrocarbon chain. The presence of intercalant may affect the curing process in terms of chemistry, while the presence of clay platelets at an atomic scale may inhibit the curing reaction through a steric effect of the clay. The effect of primary-amine-based intercalant on the polymerization of epoxy has been described by Lan et al. [4] but there have been few investigations on the impact of such effects on the mechanism and kinetics of the curing process. In addition, a steric effect of clay on the curing of intercalated epoxy matrix has been discussed by Kornmann et al. [5, 6].
In an earlier publication [7] we described the effects of adding the organo-clay Nanomer® I.30E (montmorillonite believed to be modified with octadecyl amine as intercalant) to an epoxy-amine resin system. The nanoclay was dispersed in the epoxy resin with the aid of a solvent (methyl ethyl ketone) and ultrasonication. The cure kinetics were analyzed in detail by means of differ-ent models. The activation energy and the Avrami expondiffer-ent are important indices for the cure analysis, while the simulation of the cure process is an important prerequisite component in establishing the relationship between processing and properties of epoxy systems and their nanocomposites. The activation energy of the epoxy nanocomposite was found to be similar to that of the epoxy-amine system in the early stages of dynamic DSC cure (i.e. at lower temper-ature), but substantially lower in the later stages (at higher temperature). The presence of nanoclay facilitates the curing reaction, especially the etherification reaction (as opposed to the initial epoxy-amine reaction). On the other hand, the Avrami approach indicated a steric effect of the exfoliated clay on the cure of the nanocomposite.
The results reported here pertain to the same epoxy-amine system studied earlier [7]. The nano-clay, however, was dispersed in the epoxy resin without the use of solvent or ultrasonication. Furthermore, in addition to Nanomer® I.30E, the study included the nanoclay Cloisite® 30B (a natural montmorillonite modified with a quaternary ammonium salt). The aim is thus to better understand how the nature of the intercalant and the type of mixing method used influence the cure mechanism, kinetics, and properties of epoxy nanocomposites in which the nanoclay has been exfoliated or intercalated in the matrix.
EXPERIMENTAL Materials
The resin and amine hardener selected for this study were respectively EPON™ 828 and EPIKURE™ 3046, from Resolution Performance Products LLC (Houston, TX, USA). Two organo-nanoclays recommended for use with amine-cured epoxy systems were used, namely Nanomer® I.30E (montmorillonite treated with octadecyl amine, a primary amine base) from Nanocor Inc. (Arlington Heights, IL, USA) and Cloisite® 30B (montmorillonite treated with methyl tallow bis-(2-hydroxyethyl) quaternary ammonium) from Southern Clay Products Inc. (Gonzales, TX, USA).
Sample Preparation
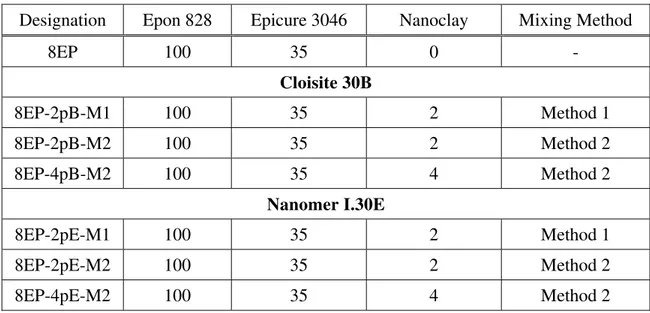
Two processes were used to prepare the epoxy nanocomposites. The first one (Method 1) is a direct process, in which the clay and epoxy are mixed at room temperature by mechanical mixing; the nanoclay content in the epoxy resin in this case was 2 wt%. The second one (Method 2) is a high-temperature process, in which the clay and epoxy are mixed at 120°C for 1 hour; the nanoclay content in the epoxy resin in this case was 2 and 4 wt%. For curing, the amine hardener was mixed in at room temperature at a level of 35 phr. Samples were cured either at room temperature for 2 days or at 120°C for 2 hours, with subsequent post cure at 140°C for 2 hours in both cases. Sample specifications are given in Table 1.
Table 1. Sample specifications.
Designation Epon 828 Epicure 3046 Nanoclay Mixing Method
8EP 100 35 0 - Cloisite 30B 8EP-2pB-M1 100 35 2 Method 1 8EP-2pB-M2 100 35 2 Method 2 8EP-4pB-M2 100 35 4 Method 2 Nanomer I.30E 8EP-2pE-M1 100 35 2 Method 1 8EP-2pE-M2 100 35 2 Method 2 8EP-4pE-M2 100 35 4 Method 2 Measurements
The DSC data were obtained on a Perkin-Elmer Pyris 1 instrument using nitrogen atmosphere. The samples were heated from 30°C to 250°C (dynamic scan) at five different heating rates (2.5, 5, 10, 15, and 20°C·min-1) to follow the heat evolution due to the chemical reaction occurring in this temperature range. The cured sample was then cooled to 30°C at 20°C·min-1 to minimize the enthalpy relaxation in the second heating scan. Finally, the sample was reheated to 250°C at 20°C·min-1 in order to determine the glass transition temperature (Tg) and confirm the absence of
any residual curing.
To evaluate the dispersion of the nanoclay in the polymer matrix, X-ray diffraction patterns were obtained from the surface of the samples with a Bruker Discover 8 powder X-ray diffractometer with CuKα radiation. The experiments were conducted on the exposed surface of specimens prepared by casting.
The flexural and tensile properties of the epoxy system with and without clay were determined at room temperature and 50% relative humidity according to ASTM D790-2000 and ASTM D638-2002, with crosshead speeds of 1.3 mm/min and 5 mm/min, respectively.
RESULTS AND DISCUSSION Dispersion
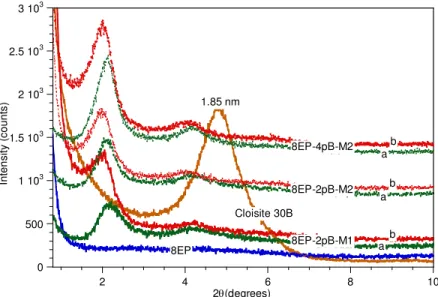
X-ray diffraction curves of the epoxy system and its nanocomposites based on Cloisite 30B and Nanomer I.30E are illustrated in Figures 1 and 2. The d-spacing data calculated therefrom are summarized in Table 2. In all the nanocomposite samples the clay layer separation (degree of intercalation) is considerably higher than in the original Cloisite 30B or Nanomer I.30E. There
is no significant difference between the clay loading levels of 2 phr and 4 phr for Cloisite 30B. However, the difference is more apparent for Nanomer I.30E, particularly when the samples were cured at 120oC. At the same loading level of 2 phr, the 8EP-2pB-M2 (epoxy and clay mixed at high temperature) shows somewhat better intercalation than the 8EP-2pB-M1 (epoxy and clay mixed at room temperature), whether the samples were cured at room temperature or at 120°C. For instance, when samples were cured at room temperature, the d-spacing of 8EP-2pB-M2 is 4.23 nm, compared with 3.99 for 8EP-2pB-M1. A high temperature of mixing speeds up the diffusion of the polymer into the clay galleries. The situation is similar for nanocomposites based on Nanomer I.30E. This confirms that mixing at high temperature leads to better delamination than room temperature mixing.
Table 2. Summary of XRD data.
In addition, the X-ray results also indicate that the curing of the nanocomposites at the higher temperature of 120°C in all cases results in better intercalation than the curing at room temper-ature, for nanocomposites with the same clay loading and mixing method. The X-ray diffraction peak (see Figures 1 and 2) shifts to lower angle, which means the degree of delamination increases in all cases. Thus a high curing temperature accelerates the diffusion of the polymer and hardener into the clay galleries [6].
Gallery distance (nm)
Sample Cured at room
temperature Cured at 120°C for 2 h 8EP - Cloisite 30B 1.85 8EP-2pB-M1 3.99 4.38 8EP-2pB-M2 4.23 4.48 8EP-4pB-M2 4.17 4.41 Nanomer I.30E 2.38 8EP-2pE-M1 4.84 5.60 8EP-2pE-M2 4.94 5.70 8EP-4pE-M2 4.70 4.99
0 500 1 103 1.5 103 2 103 2.5 103 3 103 2 4 6 8 10 In te ns it y ( c ou n ts ) 2θ(degrees) Cloisite 30B 8EP-2pB-M1 8EP-2pB-M2 8EP-4pB-M2 8EP a b a a b b 1.85 nm
Figure 1. X-ray diffraction curves of the 8EP and its Cloisite 30B nanocomposites: (a) samples cured at room temperature; (b) samples cured at 120°C for 2 h.
0 500 1 103 1.5 103 2 103 2.5 103 3 103 2 4 6 8 10 In tens it y ( c o u nt s ) 2θ(degrees) Nanomer I30E 8EP-2pE-M1 8EP-2pE-M2 8EP-4pE-M2 8EP ab a a b b 2.38 nm
Figure 2. X-ray diffraction curves of the 8EP and its Nanomer I.30E nanocomposites: (a) samples cured at room temperature; (b) samples cured at 120°C for 2 h.
Cure behaviour
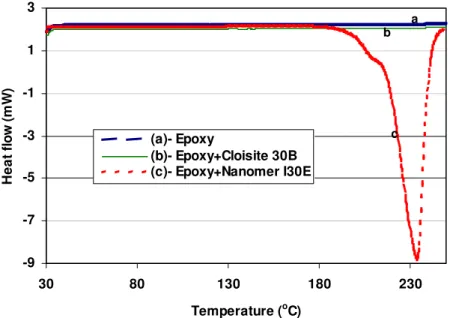
The epoxy resin alone (EPON 828) and epoxy-clay mixtures without hardener were heated in the DSC at a rate of of 10°C·min-1. Figure 3 shows that up to 250°C no exothermic or endothermic peak is observed for the epoxy resin sample and epoxy with Cloisite 30B, but a strong exothermic peak appeared in the range between 180 and 250°C for the mixture of epoxy and Nanomer I.30E. Thus, no chemical reaction occurred either in the epoxy resin or mixture of epoxy and Cloisite 30B in the temperature range studied, whereas the exothermic peak for the
Nanomer I.30E mixture likely indicates that a curing reaction took place during the first heating scan. To check the effect of the heating process on the physical properties of the sample, a second scan was done. The neat epoxy sample and the Cloisite 30B mixture showed no change, but the Nanomer I.30E mixture now showed a glass transition at Tg = 102°C. The resin in the
mixture had been polymerized to the solid state and the final product was in the form of a brown powder. This transformation can be explained in terms of the polymerization of epoxy groups initiated by the primary amine onium ion of the organo-nanoclay I.30E. A similar effect was reported by Lan et al. [4].
-9 -7 -5 -3 -1 1 3 30 80 130 180 230 Temperature (oC) H e a t fl o w (m W ) (a)- Epoxy (b)- Epoxy+Cloisite 30B (c)- Epoxy+Nanomer I30E a b c
Figure 3. DSC curves of neat epoxy resin and epoxy-clay mixtures in the absence of hardener.
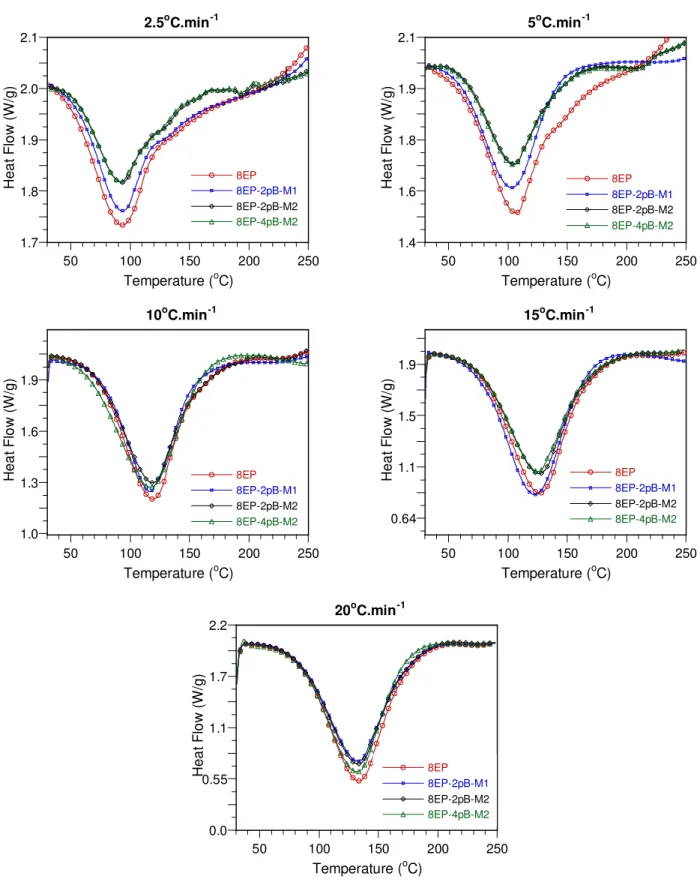
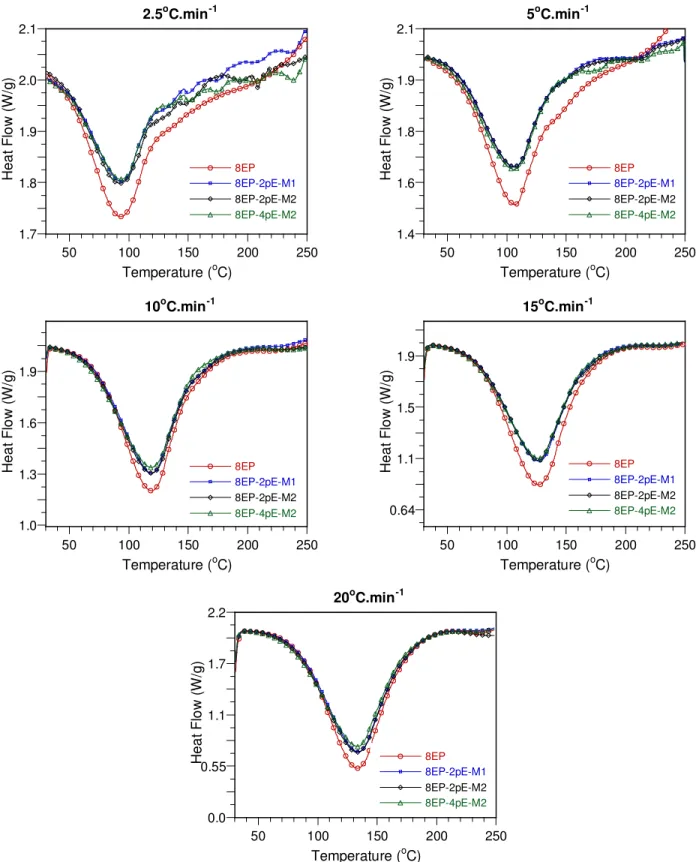
DSC curves of the epoxy-amine system and its nanocomposites at different heating rates are shown in Figures 4 and 5. The presence of nanoclay has some effect on the curing process as reflected by the difference in the DSC curves of the epoxy and its nanocomposites. This difference is more apparent at lower heating rates than at higher ones.
For the mixture of epoxy and Cloisite 30B, the mixing method also affects the curing process. At the same clay loading of 2 phr (based on epoxy resin), the DSC curves of the nanocomposite in which clay and epoxy were mixed at high temperature are different from those of epoxy and the nanocomposite in which clay and epoxy were mixed at room temperature (compare 8EP, 8EP-2pB-M1 and 8EP-2pB-M2). This may be caused by the presence of clay and the level of dispersion of clay in the epoxy (see Figure 4 at heating rates 2.5 and 5°C·min-1). On the other hand, with Nanomer I.30E, the mixing method does not affect the curing process, and the DSC curves of epoxy nanocomposites based on Nanomer I.30E are all very similar, although different from the curves of the sample without clay (see Figure 5).
1.7 1.8 1.9 2.0 2.1 50 100 150 200 250 2.5oC.min-1 8EP 8EP-2pB-M1 8EP-2pB-M2 8EP-4pB-M2 H e at F low ( W /g ) Temperature (oC) 1.4 1.6 1.8 1.9 2.1 50 100 150 200 250 5oC.min-1 8EP 8EP-2pB-M1 8EP-2pB-M2 8EP-4pB-M2 H e at F low ( W /g ) Temperature (oC) 1.0 1.3 1.6 1.9 50 100 150 200 250 10oC.min-1 8EP 8EP-2pB-M1 8EP-2pB-M2 8EP-4pB-M2 H e at F low ( W /g ) Temperature (oC) 0.64 1.1 1.5 1.9 50 100 150 200 250 15oC.min-1 8EP 8EP-2pB-M1 8EP-2pB-M2 8EP-4pB-M2 H e at F low ( W /g ) Temperature (oC) 0.0 0.55 1.1 1.7 2.2 50 100 150 200 250 20oC.min-1 8EP 8EP-2pB-M1 8EP-2pB-M2 8EP-4pB-M2 H e at F low ( W /g ) Temperature (oC)
Figure 4. DSC curves obtained at different heating rates for the epoxy-amine system and its nanocomposites based on Cloisite 30B.
1.7 1.8 1.9 2.0 2.1 50 100 150 200 250 2.5oC.min-1 8EP 8EP-2pE-M1 8EP-2pE-M2 8EP-4pE-M2 H e at F low ( W /g ) Temperature (oC) 1.4 1.6 1.8 1.9 2.1 50 100 150 200 250 5oC.min-1 8EP 8EP-2pE-M1 8EP-2pE-M2 8EP-4pE-M2 H e at F low ( W /g ) Temperature (oC) 1.0 1.3 1.6 1.9 50 100 150 200 250 10oC.min-1 8EP 8EP-2pE-M1 8EP-2pE-M2 8EP-4pE-M2 H e at F low ( W /g ) Temperature (oC) 0.64 1.1 1.5 1.9 50 100 150 200 250 15oC.min-1 8EP 8EP-2pE-M1 8EP-2pE-M2 8EP-4pE-M2 H e at F low ( W /g ) Temperature (oC) 0.0 0.55 1.1 1.7 2.2 50 100 150 200 250 20oC.min-1 8EP 8EP-2pE-M1 8EP-2pE-M2 8EP-4pE-M2 H e at F low ( W /g ) Temperature (oC)
Figure 5. DSC curves obtained at different heating rates for the epoxy-amine system and its nanocomposites based on Nanomer I.30E.
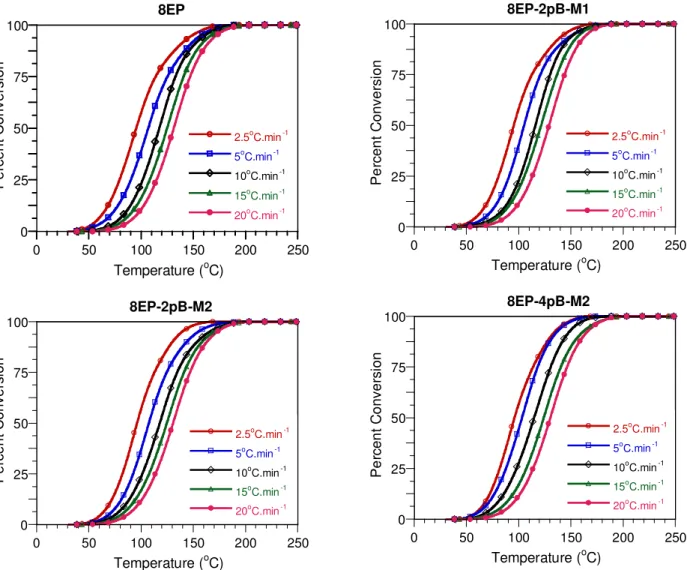
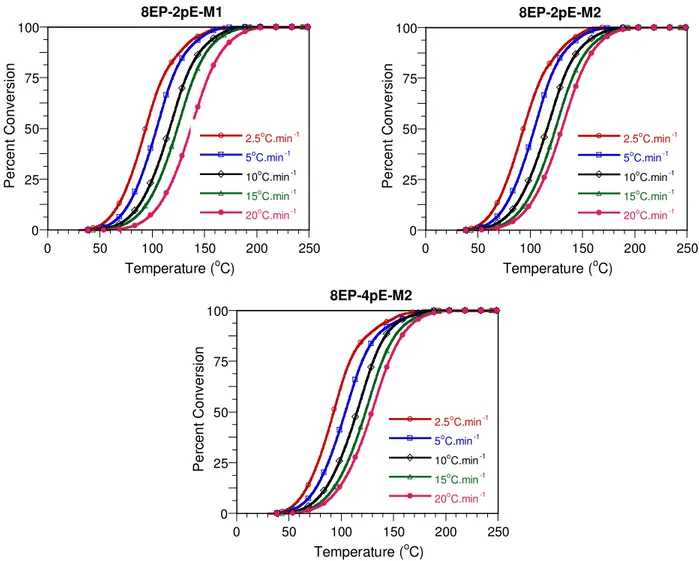
The transformation curves derived from the DSC results are shown in Figures 6 and 7. Gener-ally speaking, the reaction onset and completion occur at lower temperatures at lower heating rates, as can be seen from the Tonset values given in Tables 3 and 4. There is no significant
difference between the systems with respect to the Tonset, nor with respect to Tp (the temperature
of the peak maximum in the heat flow curves). The curing of epoxy with amine involves several different reactions, and the rates of these reactions will vary with temperature in different ways. Thus a change in the heating rate may favour one reaction with respect to another and change the structure of the crosslinked molecular network. This could explain the decrease in the ultimate
Tg observed on increasing the heating rate (Tables 3 and 4), as well as the variations in ∆H. For
a given heating rate, the presence of clay does not seem to have a significant effect on Tg, with
the possible exception of sample 8EP-4pE-M2, where the values are generally a couple of degrees lower. If this effect is real, it could be explained either by a reduction of the crosslink density or by crowding by the intercalant, whose alkyl chain may increase the mobility of the crosslinked network and affect the curing mechanism as well.
0 25 50 75 100 0 50 100 150 200 250 8EP 2.5oC.min-1 5oC.min-1 10oC.min-1 15oC.min-1 20oC.min-1 P e rc en t C o nv e rsi o n Temperature (oC) 0 25 50 75 100 0 50 100 150 200 250 8EP-2pB-M1 2.5oC.min-1 5oC.min-1 10oC.min-1 15oC.min-1 20oC.min-1 Pe rc en t C onv e rs ion Temperature (oC) 0 25 50 75 100 0 50 100 150 200 250 8EP-2pB-M2 2.5oC.min-1 5oC.min-1 10oC.min-1 15oC.min-1 20oC.min-1 Pe rc en t C o nv e rs ion Temperature (oC) 0 25 50 75 100 0 50 100 150 200 250 8EP-4pB-M2 2.5oC.min-1 5oC.min-1 10oC.min-1 15oC.min-1 20oC.min-1 Pe rc en t C o nv e rs ion Temperature (oC)
Figure 6. Transformation curves corresponding to different heating rates for 8EP and its nanocomposites based on Cloisite 30B.
0 25 50 75 100 0 50 100 150 200 250 8EP-2pE-M1 2.5oC.min-1 5oC.min-1 10oC.min-1 15oC.min-1 20oC.min-1 Pe rc en t C o nv e rs ion Temperature (oC) 0 25 50 75 100 0 50 100 150 200 250 8EP-2pE-M2 2.5oC.min-1 5oC.min-1 10oC.min-1 15oC.min-1 20oC.min-1 Pe rc en t C onv e rs ion Temperature (oC) 0 25 50 75 100 0 50 100 150 200 250 8EP-4pE-M2 2.5oC.min-1 5oC.min-1 10oC.min-1 15oC.min-1 20oC.min-1 Pe rc en t C o nv e rs ion Temperature (oC)
Figure 7. Transformation curves corresponding to different heating rates for nanocomposites based on Nanomer I.30E.
Table 3. Curing characteristics for 8EP.
q (°C·min-1) Tonset (°C) Tp (°C) ∆H (W/g) Tg (°C) 2.5 51.4 92.9 382.0 87.7 5 59.2 106.3 351.0 86.8 10 69.9 119.0 268.1 79.2 15 74.7 126.7 272.9 73.9 20 81.6 133.3 257.2 72.7
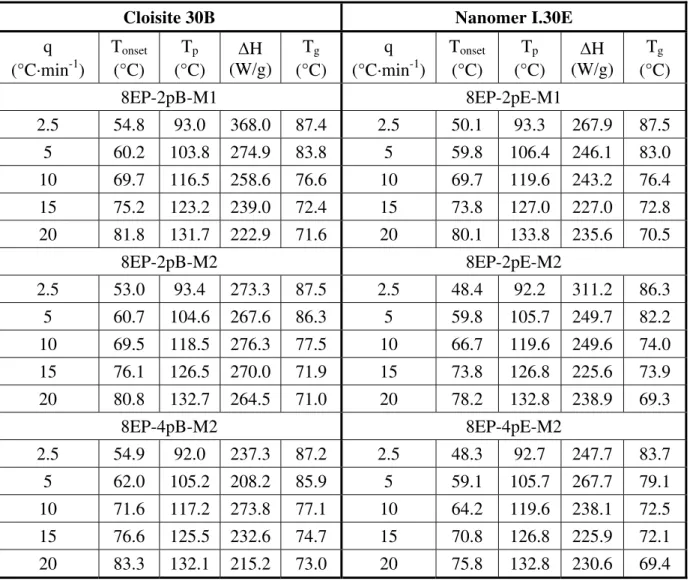
Table 4. Curing characteristics for 8EP nanocomposites.
Cloisite 30B Nanomer I.30E
q (°C·min-1) Tonset (°C) Tp (°C) ∆H (W/g) Tg (°C) q (°C·min-1) Tonset (°C) Tp (°C) ∆H (W/g) Tg (°C) 8EP-2pB-M1 8EP-2pE-M1 2.5 54.8 93.0 368.0 87.4 2.5 50.1 93.3 267.9 87.5 5 60.2 103.8 274.9 83.8 5 59.8 106.4 246.1 83.0 10 69.7 116.5 258.6 76.6 10 69.7 119.6 243.2 76.4 15 75.2 123.2 239.0 72.4 15 73.8 127.0 227.0 72.8 20 81.8 131.7 222.9 71.6 20 80.1 133.8 235.6 70.5 8EP-2pB-M2 8EP-2pE-M2 2.5 53.0 93.4 273.3 87.5 2.5 48.4 92.2 311.2 86.3 5 60.7 104.6 267.6 86.3 5 59.8 105.7 249.7 82.2 10 69.5 118.5 276.3 77.5 10 66.7 119.6 249.6 74.0 15 76.1 126.5 270.0 71.9 15 73.8 126.8 225.6 73.9 20 80.8 132.7 264.5 71.0 20 78.2 132.8 238.9 69.3 8EP-4pB-M2 8EP-4pE-M2 2.5 54.9 92.0 237.3 87.2 2.5 48.3 92.7 247.7 83.7 5 62.0 105.2 208.2 85.9 5 59.1 105.7 267.7 79.1 10 71.6 117.2 273.8 77.1 10 64.2 119.6 238.1 72.5 15 76.6 125.5 232.6 74.7 15 70.8 126.8 225.9 72.1 20 83.3 132.1 215.2 73.0 20 75.8 132.8 230.6 69.4 Activation Energy
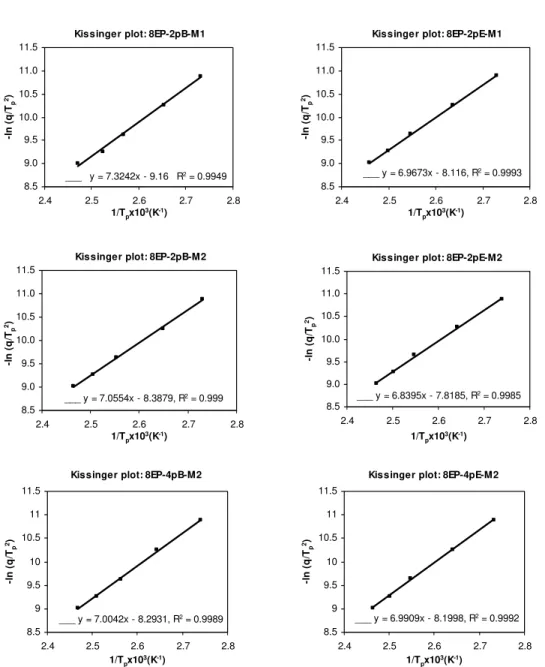
Activation energy is commonly evaluated by one of two methods: the Kissinger equation or the isoconversional equation. The Kissinger analysis is based on the relationship between the heating rate q and the temperature Tp corresponding to the peak in the heat release curve.
Consequently, only an overall activation energy can be calculated [8]. For nonisothermal curing, the relationship between activation energy E, the heating rate q, and the temperature Tp at which
the exothermic peak has its maximum can be described as:
2 1 (ln( / )) ( ) p p d q T E R d T − = − (1)
where R is the gas constant, equal to 8.3144 J·K-1·mol-1. From the dynamic DSC curves measured at different heating rates, the relation between ln (q/Tp2) and Tp-1 can be obtained, and
Kissinger plot: 8EP ___ y = 6.963x - 8.1235, R2 = 0.9991 8.5 9 9.5 10 10.5 11 11.5 2.4 2.5 2.6 2.7 2.8 1/Tpx103(K-1) -l n ( q /Tp 2)
Kissinger plot: 8EP-2pB-M1
___ y = 7.3242x - 9.16 R2 = 0.9949 8.5 9.0 9.5 10.0 10.5 11.0 11.5 2.4 2.5 2.6 2.7 2.8 1/Tpx103(K-1) -l n (q/ Tp 2)
Kissinger plot: 8EP-2pE-M1
___ y = 6.9673x - 8.116, R2 = 0.9993 8.5 9.0 9.5 10.0 10.5 11.0 11.5 2.4 2.5 2.6 2.7 2.8 1/Tpx103(K-1) -l n (q/ Tp 2)
Kissinger plot: 8EP-2pB-M2
___ y = 7.0554x - 8.3879, R2 = 0.999 8.5 9.0 9.5 10.0 10.5 11.0 11.5 2.4 2.5 2.6 2.7 2.8 1/Tpx103(K-1) -l n (q/ Tp 2)
Kissinger plot: 8EP-2pE-M2
___ y = 6.8395x - 7.8185, R2 = 0.9985 8.5 9.0 9.5 10.0 10.5 11.0 11.5 2.4 2.5 2.6 2.7 2.8 1/Tpx103(K-1) -l n ( q /T p 2)
Kissinger plot: 8EP-4pB-M2
___ y = 7.0042x - 8.2931, R2 = 0.9989 8.5 9 9.5 10 10.5 11 11.5 2.4 2.5 2.6 2.7 2.8 1/Tpx103(K-1) -l n (q/ Tp 2)
Kissinger plot: 8EP-4pE-M2
___ y = 6.9909x - 8.1998, R2 = 0.9992 8.5 9 9.5 10 10.5 11 11.5 2.4 2.5 2.6 2.7 2.8 1/Tpx103(K-1) -l n (q/ Tp 2)
Figure 8 shows the relationship between ln (q.Tp-2) and Tp-1 for both the epoxy-amine system
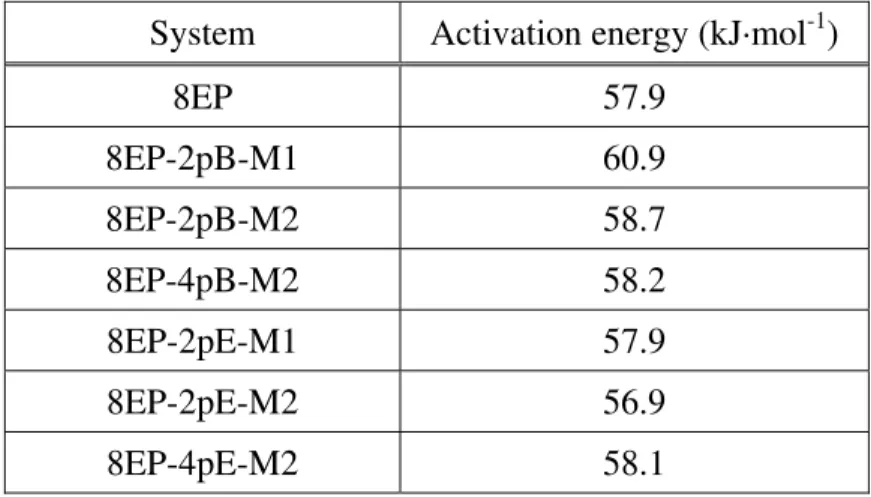
(8EP) and its nanocomposites. The five points correspond to the five heating rates of 2.5, 5, 10, 15, and 20°C·min-1. There is an excellent linear fit in all cases, indicating that the experimental data fit the Kissinger model quite well. From the slopes of these plots the overall activation energy values for epoxy-amine and nanocomposites were calculated and are shown in Table 5. The variations observed are believed to be within experimental error and are not considered significant. This is to be expected, given that the Tp values in Tables 3 and 4 are effectively the
same for a given heating rate. The average activation energy value of 58.4 kJ·mol-1 is typical for the reaction between epoxy and primary amine.
Table 5. Activation energies obtained from the Kissinger analysis for E828-EP and its nanocomposites.
System Activation energy (kJ·mol-1)
8EP 57.9 8EP-2pB-M1 60.9 8EP-2pB-M2 58.7 8EP-4pB-M2 58.2 8EP-2pE-M1 57.9 8EP-2pE-M2 56.9 8EP-4pE-M2 58.1
The isoconversional analysis is based on the relationship between the heating rate q and the temperature T at which a certain degree of conversion is reached. Unlike the Kissinger approach, the isoconversional approach makes it possible to determine the activation energy corresponding to different stages of cure throughout the entire conversion [8, 9]. The equation used is: 1 (ln ) ( ) d q E R d T− = − (2)
where T is the temperature corresponding to a selected degree of conversion α at a given heating rate q. From the slope of a plot of ln q vs. T -1 for a chosen degree of conversion, the activation energy corresponding to that degree of conversion can be obtained.
Isoconversional plots: 8EP 0.5 1.0 1.5 2.0 2.5 3.0 3.5 2.2 2.4 2.6 2.8 3 1/Tx103(K-1) ln q 0.2 0.1 0.4 0.5 0.6 0.7 0.8 0.9 0.3 α
Isoconversional plots: 8EP-2pB-M1
0.5 1.0 1.5 2.0 2.5 3.0 3.5 2.2 2.4 2.6 2.8 3 1/Tx103(K-1) ln q 0.1 0.2 0.3 0.4 0.5 0.6 0.8 0.9 0.7 α
Isoconversional plots: 8EP-2pE-M1
0.5 1.0 1.5 2.0 2.5 3.0 3.5 2.25 2.45 2.65 2.85 3.05 1/Tx103(K-1) ln q 0.1 0.2 0.3 0.4 0.5 0.6 0.8 0.9 0.7 α
Isoconversional plots: 8EP-2pB-M2
0.5 1.0 1.5 2.0 2.5 3.0 3.5 2.2 2.4 2.6 2.8 3 1/Tx103(K-1) ln q 0.1 0.2 0.3 0.4 0.5 0.6 0.7 0.9 0.8 α
Isoconversional plots: 8EP-2pE-M2
0.5 1.0 1.5 2.0 2.5 3.0 3.5 2.25 2.45 2.65 2.85 3.05 1/Tx103(K-1) ln q 0.1 0.2 0.3 0.4 0.5 0.6 0.8 0.9 0.7 α
Isoconversional plots: 8EP-4pB-M2
0.50 1.00 1.50 2.00 2.50 3.00 3.50 2.2 2.4 2.6 2.8 3 1/Tx103(K-1) ln q 0.1 0.2 0.3 0.4 0.5 0.6 0.7 0.8 0.9 α
Isoconversional plots: 8EP-4pE-M2
0.50 1.00 1.50 2.00 2.50 3.00 3.50 2.3 2.5 2.7 2.9 1/Tx103(K-1) ln q 0.1 0.2 0.3 0.4 0.5 0.6 0.7 0.8 0.9 α
Figure 9. Isoconversional plots corresponding to various degrees of conversion for the 8EP system and its nanocomposites.
Figure 9 shows the relationship between ln q and T -1 for nine different degrees of conversion ranging from 0.1 to 0.9. The linear relationship observed in all cases indicates that the approach is applicable for this case. The activation energies Ea calculated for the four systems are given in
Figure 10. Some differences are clearly apparent. For the epoxy-amine system without clay, Ea
increases steadily with the degree of cure, particularly in the later stages (α > 0.7). For the mixtures of epoxy and Cloisite 30B, when 2 wt% Cloisite 30B is mixed in by Method 1 (room temperature, 8EP-2pB-M1), Ea behaves in a similar manner except that the values are
consistently somewhat higher. Thus, even when not well dispersed, the clay appears to have an effect. However, when the clay is better dispersed (high temperature), whether at 2 or 4 wt % (8EP-2pB-M2 and 8EP-4pB-M2), the shape of the Ea vs. α curve changes considerably. The Ea
decreases slightly as α increases in the initial stages of cure, then levels off, then rises towards the end, but not nearly as much as when the clay is absent or less well dispersed. It is obvious that the mixing method affects the Ea for epoxy and Cloisite 30B systems. However, for the
mixtures of epoxy and Nanomer I.30E, whether mixed at room temperature (8EP-2pE-M1) or high temperature (8EP-2pE-M2), Ea behaves in a manner similar to the epoxy-Cloisite systems
mixed at high temperature, except that the values are generally somewhat lower. The mixing method has very litle effect on the Ea for the mixtures containing epoxy and Nanomer I30E.
60 70 80 90 100 110 120 130 140 0 0.2 0.4 0.6 0.8 1 8EP 8EP-2pB-M1 8EP-2pB-M2 8EP-4pB-M2 8EP-2pE-M1 8EP-2pE-M2 8EP-4pE-M2 Ac ti v a ti on E n er gy E a (k J .mol -1 ) Degree of conversion (α)
Figure 10. Activation energies obtained for the isoconversional model.
The activation energies obtained by the Kissinger approach (Table 5) are lower than the average values obtained by the isoconversional approach (Table 6). This can be explained by the differences in assumptions and mathematical approach between the two models. The isoconver-sional results are more meaningful than the Kissinger ones because the evolution of the chemistry of the system during the cure is partially taken into account. The Kissinger approach is based entirely on the maximum rate of cure, which occurs in this case around the beginning of the curing reaction [7]. Thus it is not surprising that the Ea values obtained by the Kissinger
approach are closer to those obtained at lower degrees of cure by the isoconversional approach rather than to the average isoconversional values.
Table 6. Average activation energies obtained for the isoconversional model.
System Average activation energy (kJ·mol-1) 8EP 79.9 8EP-2pB-M1 86.1 8EP-2pB-M2 78.2 8EP-4pB-M2 76.0 8EP-2pE-M1 72.4 8EP-2pE-M2 72.9 8EP-4pE-M2 74.5 Avrami Analysis
From the DSC results, curves of ln[-ln(1-α)] vs. T were plotted for two different conversion ranges, namely 0-10% and 10-25%. A linear fit in each range gave the parameters a and Tq in
Eq. 3 [9]:
ln[ ln(1− −α)]=a T( −Tq ) (3)
where a and Tq are constants. The results for the five different heating rates q were then used to
make plots of Tq vs. (ln q)/a according to Eq. 4:
1 ln q q T n T a = + (4)
where the slope n is the Avrami exponent and the intercept T1 corresponds to the Tq at q = 1
K·min-1.
The results are shown in Figures 11 and 12. The Avrami exponents n obtained from the slopes are given in Table 7. Similar values were obtained for the more highly exfoliated samples prepared with the use of a solvent [7]. For both epoxy-amine and nanocomposites, the Avrami exponent n in the early stage of cure is greater than in the second stage. It can be understood that at low conversions, the concentration and the size of the microgels are still small, and their growth is less space-restricted. With the advancement of cure the number of microgels and their size increases, so their growth is restrained and inter-microgelation may occur. When the cure reaches its end, intermicrogelation becomes dominant, a three-dimensional network is formed, and the reaction nearly stops [7].
Avram i exponent calculation 8EP (0-10%) __ y = 1.2652x + 350.2, R2 = 0.9983 350 360 370 380 390 400 410 5 15 25 35 45 (ln q)/a Tq ( 0K)
Avram i exponent calculation 8EP-2pB-M1 (0-10%) ___ y = 1.3285x + 348.53 R2 = 0.9924 350 360 370 380 390 400 0 10 20 30 40 (ln q)/a Tq ( 0K)
Avram i exponent calculation 8EP-2pE-M1 (0-10%) ___ y = 1.3813x + 346.09, R2 = 0.998 350 360 370 380 390 400 0 10 20 30 40 (ln q)/a Tq ( 0K)
Avram i exponent calculation 8EP-2pB-M2 (0-10%) ___ y = 1.2952x + 349.48, R2 = 0.9925 350 360 370 380 390 400 0 10 20 30 40 (ln q)/a Tq ( 0K)
Avram i exponent calculation 8EP-2pE-M2 (0-10%) ___ y = 1.277x + 347.91, R2 = 0.998 350 360 370 380 390 400 0 10 20 30 40 (ln q)/a Tq ( 0K)
Avram i exponent calculation 8EP-4pB-M2 (0-10%) ___ y = 1.2573x + 349.49, R2 = 0.9912 350 360 370 380 390 400 410 0 10 20 30 40 (ln q)/a Tq ( 0K)
Avram i exponent calculation 8EP-4pE-M2 (0-10%) ___ y = 1.2727x + 348.48 R2 = 0.9914 350 360 370 380 390 0 10 20 30 40 (ln q)/a Tq ( 0K)
Figure 11. Determination of the Avrami exponent n for the epoxy-amine system and its nanocomposites in the conversion range α = 0-10%.
Avram i exponent calculation 8EP (10-25%) ___ y = 1.0899x + 355.35, R2 = 0.9993 360 370 380 390 400 410 5 15 25 35 45 (ln q)/a Tq ( 0K)
Avram i exponent calculation 8EP-2pB-M1 (10-25%) ___ y = 1.0695x + 354.64, R2 = 0.9973 360 370 380 390 400 410 5 15 25 35 45 55 (ln q)/a Tq ( 0K)
Avram i exponent calculation 8EP-2pE-M1 (10-25%) ___ y = 1.0454x + 354.82, R2 = 0.9985 360 370 380 390 400 410 0 20 40 60 (ln q)/a Tq ( 0K)
Avram i exponent calculation 8EP-2pB-M2 (10-25%) ___ y = 0.9738x + 358.84, R2 = 0.9963 360 370 380 390 400 410 0 20 40 60 (ln q)/a Tq ( 0K)
Avram i exponent calculation 8EP-2pE-M2 (10-25%) ___ y = 1.0085x + 355.11, R2 = 0.9984 360 370 380 390 400 410 0 20 40 60 (ln q)/a Tq ( 0K)
Avram i exponent calculation 8EP-4pB-M2 (10-25%) ___ y = 1.0199x + 355.68, R2 = 0.9908 360 370 380 390 400 410 0 20 40 60 (ln q)/a Tq ( 0K)
Avram i exponent calculation 8EP-4pE-M2 (10-25%) ___ y = 1.0023x + 355.74 R2 = 0.9927 360 370 380 390 400 410 0 20 40 60 (ln q)/a Tq ( 0K)
Figure 12. Determination of the Avrami exponent n for the epoxy-amine system and its nanocomposites in the conversion range α = 10-25%.
Table 7. Exponents n obtained from Avrami analysis. System α = 0-10% α = 10-25% 8EP 1.27 1.09 8EP-2pB-M1 1.33 1.07 8EP-2pB-M2 1.30 0.97 8EP-4pB-M2 1.26 1.02 8EP-2pE-M1 1.38 1.05 8EP-2pE-M2 1.28 1.01 8EP-4pE-M2 1.27 1.00
The long polymer chains tend to form spherical structures (so-called “microgels”) with high cyclization and crosslinking density after the initial period of polymerization [10, 11]. The number of microgels increases during the early stages. The epoxy and hydroxyl groups of the epoxy resin and the amine groups of the hardener within the microgels continue to react to improve the crosslinking density, while those near the surface react with surrounding monomers and oligomers, leading to increased microgel diameter and microgel interconnection. The Avrami exponent reflects the steric freedom of microgel growth. A higher n value indicates greater freedom of growth, and a change of n value during the cure indicates a marked change in polymerization mechanism [7].
Mechanical Properties
Figures 13 and 14 provide the tensile and flexural properties of 8EP and its nanocomposites. Both clays result in an increase in modulus, whether in tension or in flexion. A similar effect was also reported by other researchers [2, 6, 12]. Since clay has a much higher modulus than the epoxy matrix, it is easy to understand, based on the rule of mixtures, why the modulus of the nanocomposites can be improved by adding nanoclay. However, the strength of the materials depends not only on the dispersion of the clay in the matrix but also on the quality of the inter-face between clay and matrix as well as the structure of the materials. Thus the strength does not follow the same trends as the modulus, and in some cases is reduced compared to the epoxy-amine system without clay. As confirmed by X-ray diffraction, mixing at higher temperature gives a better dispersion of nanoclay in epoxy than mixing at room temperature. This explains why, at the same 2 phr level of nanoclay, the 8EP-2pB-M2 sample in which the epoxy and clay were mixed at high temperature (M2) gives higher strength (especially in flexion) than 8EP-2pB-M1 in which the epoxy and clay were mixed at room temperature (8EP-2pB-M1).
Generally speaking, other conditions being equal, Nanomer I.30E gives a higher modulus than Cloisite 30B but the inverse holds true for the strength. The Nanomer I.30E nanocomposites are more brittle than the Cloisite 30B nanocomposites. This may be caused by the occurrence of homopolymerization inside the galleries of Nanomer I.30E, creating denser crosslinks around the clay particles. On the other hand, this homopolymerization can also create a nonuniform struc-ture, since fewer epoxy groups form crosslinks with amine curing agent, possibly resulting in
some free amine groups in the final structure. This may explain why the strength (and possibly to some extent the Tg) are reduced for Nanomer I.30E nanocomposites as compared with Cloisite
30B nanocomposites. This effect will be further studied in the future in order to confirm the results. 2600 2700 2800 2900 3000 3100 8E P 8E P -2pB -M 1 8E P -2pE -M 1 8E P -2pB -M 2 8E P -2pE -M 2 8E P -4pB -M 2 8E P -4pE -M 2 Te ns il e M odul us ( M P a ) 45 50 55 60 65 8E P 8E P -2p B -M1 8 EP-2 p E-M 1 8E P -2p B -M2 8 EP-2 p E-M 2 8E P -4p B -M2 8 EP-4 p E-M 2 Te ns il e s tr e ngt h (M P a )
Figure 13. Tensile properties of 8EP and its nanocomposites.
2700 2800 2900 3000 3100 3200 8E P 8E P -2pB -M 1 8E P -2pE -M 1 8E P -2pB -M 2 8E P -2pE -M 2 8E P -4pB -M 2 8E P -4pE -M 2 F lexu ra l M o d u lu s (M P a ) 80 85 90 95 100 105 110 8E P 8E P -2pB -M 1 8E P -2pE -M 1 8E P -2pB -M 2 8E P -2pE -M 2 8E P -4pB -M 2 8E P -4pE -M 2 Fl e x ur a l S tr e ng th (M P a )
CONCLUSIONS
There is a difference in cure kinetics between the epoxy nanocomposites based on Cloisite 30B or Nanomer I.30E nanoclay and the corresponding epoxy-amine system without clay. Generally speaking, the activation energy Ea increases more or less steadily as a function of the degree of
cure. This is probably because at higher degrees of cure (i.e. at higher temperature) the epoxy-hydroxyl reaction, which is known to have a higher activation energy, plays a greater role relative to the epoxy-amine reaction. The Ea of the mixture containing poorly dispersed Cloisite
30B (mixed at room temperature) is somewhat higher than that of epoxy-amine at all stages of dynamic DSC cure. However, for systems mixed at high temperature, Ea is higher in the early
stages of cure (i.e. at lower temperature) and lower in the later stages (at higher temperature). The Ea of the Nanomer I.30E mixture is lower than that of the Cloisite 30B mixture, except when
the cure approaches 90%. Nanomer I.30E has a chemical effect on curing. On the other hand, the Avrami approach indicates a steric effect of the intercalated/exfoliated clay on the cure of the nanocomposite. The use of these two approaches provides a better understanding of the cure kinetics and mechanism of the nanocomposite formation. Thus the presence of nanoclay and the mixing method both affect the cure kinetics and mechanical properties of epoxy nanocomposite. Nanoclay I.30E gives a more brittle product than Cloisite 30B, with higher modulus but lower breaking strength.
Further work involving structure and isothermal cure is underway to more clearly establish the kinetic models for the cure of this epoxy system and its nanocomposites.
ACKNOWLEDGEMENTS
We acknowledge the support of the Vietnamese Ministry of Education and Training. We also thank the National Science & Engineering Research Council of Canada.
REFERENCES
1. P. B. Messersmith and E. P. Giannelis, Chem. Mater., 6, 1719 (1994).
2. T. Lan and T. J. Pinnavaia, Chem. Mater., 6, 2216 (1994).
3. J. Massam and T. J. Pinnavaia, Mater. Res. Soc. Symp. Proc. 520, 223 (1998).
4. T. Lan, P. D. Kaviratna, and T. J. Pinnavaia, J. Phys. Chem. Solids, 57, 1005 (1996).
5. X. Kornmann, H. Lindberg, and L. A. Berglund, Polymer, 42, 1303 (2001).
6. X. Kornmann, H. Lindberg, and L. A. Berglund, Polymer, 42, 4493 (2001).
7. M.-T. Ton-That, T.-D. Ngo, P. Ding, G. Fang, K. C. Cole, S. V. Hoa, Polym. Eng. Sci., 44, 1132 (2004).
8. F. Y. C. Boey and W. Qiang, Polymer, 41, 2081 (2000).
9. K. P. Chuah, S. N. Gan, and K. K. Chee, Polymer, 40, 253 (1998).
10. S. V. Muzumdar and L. J. Lee, Polym. Eng. Sci., 36, 943 (1996).
11. M. G. Lu, M. J. Shim, and S. W. Kim, Thermochim. Acta, 323, 37 (1998). 12. H. Zhang and L. A. Berglund. Polym Eng. Sci, 33, 100 (1993).