HAL Id: hal-02664313
https://hal.inrae.fr/hal-02664313
Submitted on 31 May 2020
HAL is a multi-disciplinary open access
archive for the deposit and dissemination of
sci-entific research documents, whether they are
pub-lished or not. The documents may come from
teaching and research institutions in France or
abroad, or from public or private research centers.
L’archive ouverte pluridisciplinaire HAL, est
destinée au dépôt et à la diffusion de documents
scientifiques de niveau recherche, publiés ou non,
émanant des établissements d’enseignement et de
recherche français ou étrangers, des laboratoires
publics ou privés.
Distributed under a Creative Commons Attribution - NonCommercial - ShareAlike| 4.0
annual total across vegetation types and biomes
Michael Bahn, M. Reichstein, E.A. Davidson, J. Grünzweig, M. Jung, M.S.
Carbone, Daniel Epron, Laurent Misson, Yann Nouvellon, Olivier Roupsard,
et al.
To cite this version:
Michael Bahn, M. Reichstein, E.A. Davidson, J. Grünzweig, M. Jung, et al.. Soil respiration at
mean annual temperature predicts annual total across vegetation types and biomes. Biogeosciences,
European Geosciences Union, 2010, 7, pp.2147-2157. �10.5194/bg-7-2147-2010�. �hal-02664313�
Biogeosciences, 7, 2147–2157, 2010 www.biogeosciences.net/7/2147/2010/ doi:10.5194/bg-7-2147-2010
© Author(s) 2010. CC Attribution 3.0 License.
Biogeosciences
Soil respiration at mean annual temperature predicts annual total
across vegetation types and biomes
M. Bahn1, M. Reichstein2, E. A. Davidson3, J. Gr ¨unzweig4, M. Jung2, M. S. Carbone5, D. Epron6, L. Misson7,†, Y. Nouvellon8,9, O. Roupsard8,10, K. Savage3, S. E. Trumbore2, C. Gimeno11, J. Curiel Yuste12, J. Tang13, R. Vargas14, and I. A. Janssens15
1Institute of Ecology, University of Innsbruck, Innsbruck, Austria 2Max-Planck Institute for Biogeochemistry, Jena, Germany 3The Woods Hole Research Center, Falmouth, Massachusetts, USA
4Hebrew University of Jerusalem, Robert H. Smith Faculty of Agriculture, Food and Environment, Rehovot, Israel 5Department of Geography, University of California, Santa Barbara, California, USA
6Nancy Universit´e, Universit´e Henri Poincar´e, Vandoeuvre les Nancy, France 7CNRS, Montpellier, France
8CIRAD, Montpellier, France
9CRDPI, Pointe-Noire, Republic of Congo 10CATIE, Turrialba, Costa Rica
11CEAM, Paterna, Valencia, Spain
12CREAF, Universitat Aut`onoma de Barcelona, Bellaterra, Barcelona, Spain
13The Ecosystems Center, Marine Biological Laboratory, Woods Hole, Massachusetts, USA
14Department of Environmental Science, Policy & Management (ESPM), University of California, Berkeley, California, USA 15Department of Biology, University Instelling Antwerp, Wilrijk, Belgium
†This article is dedicated to Laurent Misson, who died in a tragic accident in March 2010.
Received: 12 November 2009 – Published in Biogeosciences Discuss.: 11 December 2009 Revised: 29 May 2010 – Accepted: 4 June 2010 – Published: 9 July 2010
Abstract. Soil respiration (SR) constitutes the largest flux of CO2from terrestrial ecosystems to the atmosphere.
How-ever, there still exist considerable uncertainties as to its ac-tual magnitude, as well as its spatial and interannual vari-ability. Based on a reanalysis and synthesis of 80 site-years for 57 forests, plantations, savannas, shrublands and grass-lands from boreal to tropical climates we present evidence that total annual SR is closely related to SR at mean an-nual soil temperature (SRMAT), irrespective of the type of
ecosystem and biome. This is theoretically expected for non water-limited ecosystems within most of the globally occur-ring range of annual temperature variability and sensitivity (Q10). We further show that for seasonally dry sites where
annual precipitation (P ) is lower than potential evapotran-spiration (PET), annual SR can be predicted from wet season
Correspondence to: M. Bahn
(michael.bahn@uibk.ac.at)
SRMATcorrected for a factor related to P /PET. Our finding
indicates that it can be sufficient to measure SRMATfor
ob-taining a well constrained estimate of its annual total. This should substantially increase our capacity for assessing the spatial distribution of soil CO2emissions across ecosystems,
landscapes and regions, and thereby contribute to improving the spatial resolution of a major component of the global car-bon cycle.
1 Introduction
In view of its implications for the climate system, the car-bon (C) cycle has received increasing attention over the recent years (Denman et al., 2007). Recent global esti-mates suggest that soils emit about 98 Pg C per year, which exceeds emission rates from fossil fuel combustion by an order of magnitude (Bond-Lamberty and Thomson, 2010; Denman et al., 2007). While indicating that soils are the
predominant source of CO2from terrestrial ecosystems, such
estimates are still highly uncertain. They are based on a highly restricted dataset, which heavily underrepresents not only many biomes, but also the considerable spatial and tem-poral variability of SR within any given biome. Recently, progress has been made in illuminating factors determining the diurnal, seasonal and interannual variability of SR within ecosystems (Bahn et al., 2010; Davidson et al., 2006a; Var-gas et al., 2010). At the same time we still lack tools per-mitting a rapid assessment of the spatial variability of SR across ecosystems, landscapes and regions – which would be essential for deriving more defensible regional and global estimates of SR.
It is evident that, even within short distance, similar types of ecosystems may exhibit substantial differences in annual SR (Bahn et al., 2008; Curiel Yuste et al., 2004; Kang et al., 2003, Vincent et al., 2006). Spatial assessments of to-tal annual SR (SRannual) are difficult to achieve given a finite
availability of resources and the resulting trade-off between the temporal resolution required for obtaining an annual es-timate and the spatial coverage required for achieving a de-fensible regional up-scaling (Savage and Davidson, 2003). For this reason it has been attempted to identify proxies for estimating SRannual, including monthly air temperature and
precipitation (Raich and Potter, 1995; Raich et al., 2002), lit-terfall (Davidson et al., 2002; Raich and Nadelhoffer, 1989) and productivity indices, such as leaf area index or gross pri-mary productivity (Bahn et al., 2008; Hibbard et al., 2005; Janssens et al., 2001; Reichstein et al., 2003).
Here, we demonstrate that SR measured at mean annual temperature (SRMAT) may be a useful and meaningful
pre-dictor of SRannual. We do so by first outlining a theoretical
framework, suggesting that SRMATis in principle well suited
for estimating SRannualat non water-limited sites within most
of the globally occurring range of annual soil temperature variability and temperature sensitivity of SR (Q10).
Sec-ondly, we apply a Monte-Carlo analysis to test the hypoth-esized relationship between SRMAT and SRannual on a
ran-domly generated dataset. Thirdly, we explore the relation-ship for existing databases of SR for 57 forests, plantations, savannas, shrublands and grasslands from boreal to tropi-cal climates. We show that for seasonally dry ecosystems, where mean annual temperature occurs only in the wet sea-son, SRannualcan be estimated from wet season SRMATand a
correction factor based on the ratio of precipitation to poten-tial evapotranspiration. Finally, based on additional 23 site-years for four temperate forests, we analyse effects of inter-annual variability on estimates of SRannual. Our finding
in-dicates that it is sufficient to measure SRMATfor obtaining a
highly constrained estimate of its annual total, which could help improving future assessments of the spatial distribution of soil CO2emissions across ecosystems, landscapes and
re-gions.
2 Methods
2.1 Annual soil temperature variability across biomes
A global overview of the annual variability of soil temper-ature, expressed as the standard deviation of daily means of soil temperature (Tsd), was obtained from the FLUXNET
data set (http://www.fluxdata.org/default.aspx) and included all sites reporting continuous quality-controlled data for soil temperature which were made available by the site principal investigators. In total 172 sites and 474 site-years were in-cluded in the analysis. Sites were grouped to the following climatic zones: tropical (7 sites), dry (6 sites), subtropical-mediterranean (47 sites), temperate (49 sites), temperate continental (35 sites), boreal (24 sites) and arctic climates (4 sites). For sites reporting multiple years of soil tempera-ture an average Tsdof all reported years was used.
2.2 Soil respiration database
The soil respiration database consisted of 35 sites and 58 site-years for temperate and boreal forests and grasslands, 7 trop-ical forests and plantations, and 15 mediterranean, dry sub-humid and semi-arid forests, savannas, grasslands and shrub-lands, as summarized in Table 1. The database also in-cludes 11 previously unpublished datasets, which were ob-tained using a range of closed and open dynamic soil respi-ration systems on previously installed shallow collars. All these systems are well established systems that are either commercially available (Licor, Lincoln, Nebraska, USA) or have been tested and described in further detail in previous studies (Rayment and Jarvis, 1997; Carbone et al., 2008). Measurements were taken either manually in bi-weekly to monthly intervals or continuously, using automated soil res-piration systems. Details on the systems used at the respec-tive sites, and on sampling frequencies and spatial replication are provided in Table 2. In parallel to soil respiration mea-surements, soil temperature (using soil temperature probes) and soil moisture (using TDR probes) were recorded mostly in 5 cm depth.
SRMAT, i.e. the rates of soil respiration occurring at mean
annual soil temperature, for all sites and years were calcu-lated using the soil temperature – respiration response func-tions reported by the respective studies. The average annual temperature sensitivity of SR, expressed as Q10, has been
listed for all sites in Table 1. For some tropical sites with mi-nor seasonal differences in soil temperature and for several seasonally dry ecosystems no well constrained or meaningful (cf. e.g. Davidson et al., 2006) Q10value could be provided.
Calculated SRMATwas cross-checked against SR values
ac-tually measured at MAT. The annual variability of soil tem-perature (Tsd)was calculated from the original data records
as the standard deviation of daily means of soil temperature for the reported years.
M. Bahn et al.: Soil respiration at mean annual temperature predicts annual total across vegetation types 2149
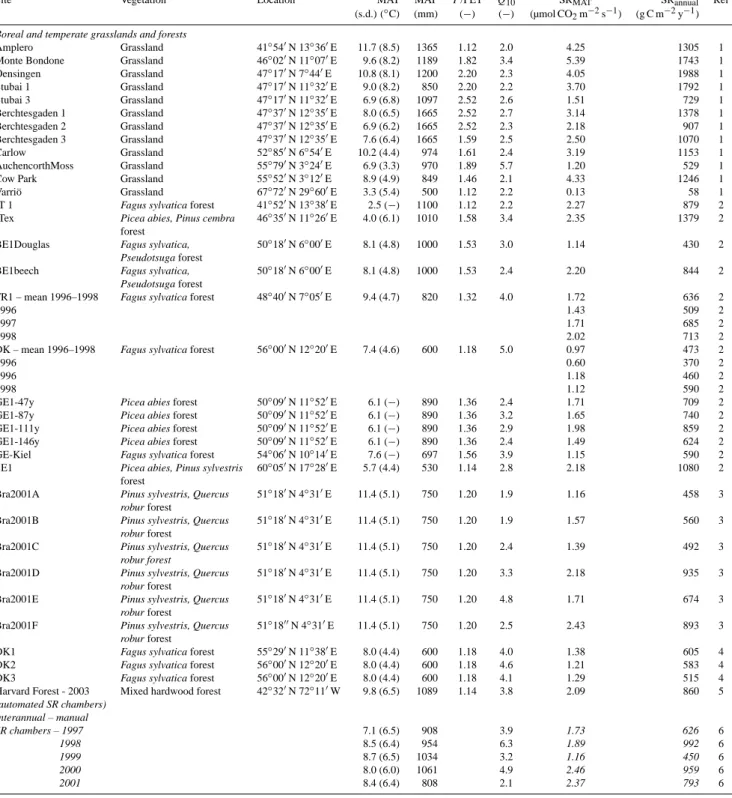
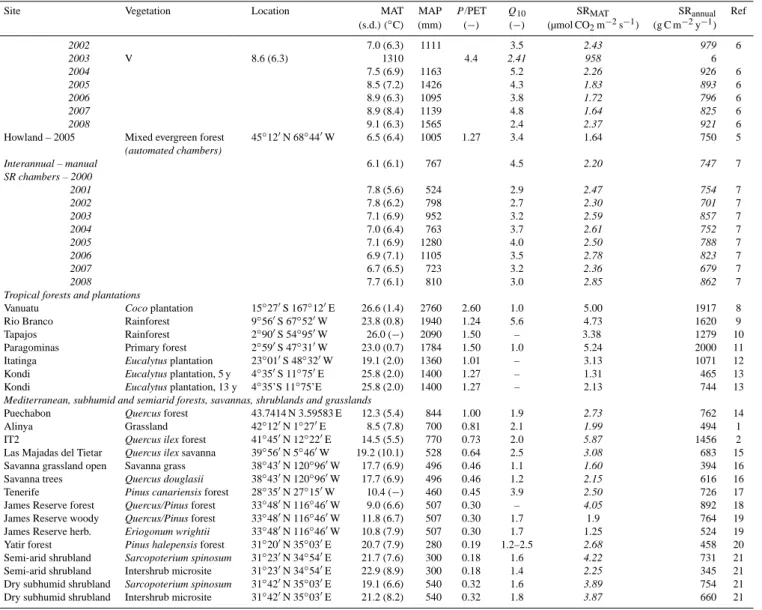
Table 1. Vegetation type, location, mean and standard deviation of annual soil temperature (as based on daily means), mean annual
precip-itation (MAP), ratio of precipprecip-itation/potential evapotranspiration (P /PET), as extracted from a global grid model, Q10of soil respiration,
soil respiration at mean annual temperature (SRMAT– wet season values are set in italics) and annual soil respiration (SRannual) for the
sites included in this study. Sources: 1 . . . Bahn et al., 2008; 2. . . Janssens et al., 2001 and 2003; 3. . . Curiel Yuste et al., 2004; 4. . . Janssens and Pilegaard, 2003; 5. . . Savage et al., 2009; 6. . . Davidson et al. 2006c, and some additional unpublished data from Savage and David-son; 7. . . Davidson et al., 2006b, and some additional unpublished data from Savage and DavidDavid-son; 8...Roupsard and Epron, unpublished ; 9...Salimon et al., 2004; 10. . . Davidson et al., 2008; 11. . . Davidson et al., 2000; 12...Nouvellon and Epron, unpublished; 13...Nouvellon and Epron, unpublished; 14. . . Misson, unpublished; 15. . . Gimeno et al., unpublished; 16...Tang and Baldocchi, 2005; 17. . . Wieser et al., 2009; 18...Carbone and Trumbore, unpublished; 19. . . Vargas and Allen, 2008; 20...Gr¨unzweig et al., 2009; 21. . . Talmon and Gr¨unzweig, unpublished.
Site Vegetation Location MAT MAP P/PET Q10 SRMAT SRannual Ref
(s.d.) (◦C) (mm) (−) (−) (µmol CO2m−2s−1) (g C m−2y−1)
Boreal and temperate grasslands and forests
Amplero Grassland 41◦540N 13◦360E 11.7 (8.5) 1365 1.12 2.0 4.25 1305 1 Monte Bondone Grassland 46◦020N 11◦070E 9.6 (8.2) 1189 1.82 3.4 5.39 1743 1 Oensingen Grassland 47◦170N 7◦440E 10.8 (8.1) 1200 2.20 2.3 4.05 1988 1 Stubai 1 Grassland 47◦170N 11◦320E 9.0 (8.2) 850 2.20 2.2 3.70 1792 1 Stubai 3 Grassland 47◦170N 11◦320E 6.9 (6.8) 1097 2.52 2.6 1.51 729 1 Berchtesgaden 1 Grassland 47◦370N 12◦350E 8.0 (6.5) 1665 2.52 2.7 3.14 1378 1 Berchtesgaden 2 Grassland 47◦370N 12◦350E 6.9 (6.2) 1665 2.52 2.3 2.18 907 1 Berchtesgaden 3 Grassland 47◦370N 12◦350E 7.6 (6.4) 1665 1.59 2.5 2.50 1070 1 Carlow Grassland 52◦850N 6◦540E 10.2 (4.4) 974 1.61 2.4 3.19 1153 1 AuchencorthMoss Grassland 55◦790N 3◦240E 6.9 (3.3) 970 1.89 5.7 1.20 529 1 Cow Park Grassland 55◦520N 3◦120E 8.9 (4.9) 849 1.46 2.1 4.33 1246 1
Varri¨o Grassland 67◦720N 29◦600E 3.3 (5.4) 500 1.12 2.2 0.13 58 1
IT 1 Fagus sylvatica forest 41◦520N 13◦380E 2.5 (−) 1100 1.12 2.2 2.27 879 2
ITex Picea abies, Pinus cembra 46◦350N 11◦260E 4.0 (6.1) 1010 1.58 3.4 2.35 1379 2 forest
BE1Douglas Fagus sylvatica, 50◦180N 6◦000E 8.1 (4.8) 1000 1.53 3.0 1.14 430 2
Pseudotsuga forest
BE1beech Fagus sylvatica, 50◦180N 6◦000E 8.1 (4.8) 1000 1.53 2.4 2.20 844 2
Pseudotsuga forest
FR1 – mean 1996–1998 Fagus sylvatica forest 48◦400N 7◦050E 9.4 (4.7) 820 1.32 4.0 1.72 636 2
1996 1.43 509 2
1997 1.71 685 2
1998 2.02 713 2
DK – mean 1996–1998 Fagus sylvatica forest 56◦000N 12◦200E 7.4 (4.6) 600 1.18 5.0 0.97 473 2
1996 0.60 370 2
1996 1.18 460 2
1998 1.12 590 2
GE1-47y Picea abies forest 50◦090N 11◦520E 6.1 (−) 890 1.36 2.4 1.71 709 2 GE1-87y Picea abies forest 50◦090N 11◦520E 6.1 (−) 890 1.36 3.2 1.65 740 2 GE1-111y Picea abies forest 50◦090N 11◦520E 6.1 (−) 890 1.36 2.9 1.98 859 2 GE1-146y Picea abies forest 50◦090N 11◦520E 6.1 (−) 890 1.36 2.4 1.49 624 2
GE-Kiel Fagus sylvatica forest 54◦060N 10◦140E 7.6 (−) 697 1.56 3.9 1.15 590 2
SE1 Picea abies, Pinus sylvestris 60◦050N 17◦280E 5.7 (4.4) 530 1.14 2.8 2.18 1080 2 forest
Bra2001A Pinus sylvestris, Quercus 51◦180N 4◦310E 11.4 (5.1) 750 1.20 1.9 1.16 458 3
robur forest
Bra2001B Pinus sylvestris, Quercus 51◦180N 4◦310E 11.4 (5.1) 750 1.20 1.9 1.57 560 3
robur forest
Bra2001C Pinus sylvestris, Quercus 51◦180N 4◦310E 11.4 (5.1) 750 1.20 2.4 1.39 492 3
robur forest
Bra2001D Pinus sylvestris, Quercus 51◦180N 4◦310E 11.4 (5.1) 750 1.20 3.3 2.18 935 3
robur forest
Bra2001E Pinus sylvestris, Quercus 51◦180N 4◦310E 11.4 (5.1) 750 1.20 4.8 1.71 674 3
robur forest
Bra2001F Pinus sylvestris, Quercus 51◦1800N 4◦310E 11.4 (5.1) 750 1.20 2.5 2.43 893 3
robur forest
DK1 Fagus sylvatica forest 55◦290N 11◦380E 8.0 (4.4) 600 1.18 4.0 1.38 605 4 DK2 Fagus sylvatica forest 56◦000N 12◦200E 8.0 (4.4) 600 1.18 4.6 1.21 583 4 DK3 Fagus sylvatica forest 56◦000N 12◦200E 8.0 (4.4) 600 1.18 4.1 1.29 515 4 Harvard Forest - 2003 Mixed hardwood forest 42◦320N 72◦110W 9.8 (6.5) 1089 1.14 3.8 2.09 860 5
(automated SR chambers) Interannual – manual SR chambers – 1997 7.1 (6.5) 908 3.9 1.73 626 6 1998 8.5 (6.4) 954 6.3 1.89 992 6 1999 8.7 (6.5) 1034 3.2 1.16 450 6 2000 8.0 (6.0) 1061 4.9 2.46 959 6 2001 8.4 (6.4) 808 2.1 2.37 793 6
Table 1. Continued.
Site Vegetation Location MAT MAP P/PET Q10 SRMAT SRannual Ref
(s.d.) (◦C) (mm) (−) (−) (µmol CO2m−2s−1) (g C m−2y−1) 2002 7.0 (6.3) 1111 3.5 2.43 979 6 2003 V 8.6 (6.3) 1310 4.4 2.41 958 6 2004 7.5 (6.9) 1163 5.2 2.26 926 6 2005 8.5 (7.2) 1426 4.3 1.83 893 6 2006 8.9 (6.3) 1095 3.8 1.72 796 6 2007 8.9 (8.4) 1139 4.8 1.64 825 6 2008 9.1 (6.3) 1565 2.4 2.37 921 6
Howland – 2005 Mixed evergreen forest 45◦120N 68◦440W 6.5 (6.4) 1005 1.27 3.4 1.64 750 5
(automated chambers) Interannual – manual 6.1 (6.1) 767 4.5 2.20 747 7 SR chambers – 2000 2001 7.8 (5.6) 524 2.9 2.47 754 7 2002 7.8 (6.2) 798 2.7 2.30 701 7 2003 7.1 (6.9) 952 3.2 2.59 857 7 2004 7.0 (6.4) 763 3.7 2.61 752 7 2005 7.1 (6.9) 1280 4.0 2.50 788 7 2006 6.9 (7.1) 1105 3.5 2.78 823 7 2007 6.7 (6.5) 723 3.2 2.36 679 7 2008 7.7 (6.1) 810 3.0 2.85 862 7
Tropical forests and plantations
Vanuatu Coco plantation 15◦270S 167◦120E 26.6 (1.4) 2760 2.60 1.0 5.00 1917 8
Rio Branco Rainforest 9◦560S 67◦520W 23.8 (0.8) 1940 1.24 5.6 4.73 1620 9
Tapajos Rainforest 2◦900S 54◦950W 26.0 (−) 2090 1.50 – 3.38 1279 10
Paragominas Primary forest 2◦590S 47◦310W 23.0 (0.7) 1784 1.50 1.0 5.24 2000 11 Itatinga Eucalytus plantation 23◦010S 48◦320W 19.1 (2.0) 1360 1.01 – 3.13 1071 12 Kondi Eucalytus plantation, 5 y 4◦350S 11◦750E 25.8 (2.0) 1400 1.27 – 1.31 465 13 Kondi Eucalytus plantation, 13 y 4◦35’S 11◦75’E 25.8 (2.0) 1400 1.27 – 2.13 744 13
Mediterranean, subhumid and semiarid forests, savannas, shrublands and grasslands
Puechabon Quercus forest 43.7414 N 3.59583 E 12.3 (5.4) 844 1.00 1.9 2.73 762 14 Alinya Grassland 42◦120N 1◦270E 8.5 (7.8) 700 0.81 2.1 1.99 494 1
IT2 Quercus ilex forest 41◦450N 12◦220E 14.5 (5.5) 770 0.73 2.0 5.87 1456 2 Las Majadas del Tietar Quercus ilex savanna 39◦560N 5◦460W 19.2 (10.1) 528 0.64 2.5 3.08 683 15 Savanna grassland open Savanna grass 38◦430N 120◦960W 17.7 (6.9) 496 0.46 1.1 1.60 394 16 Savanna trees Quercus douglasii 38◦430N 120◦960W 17.7 (6.9) 496 0.46 1.2 2.15 616 16 Tenerife Pinus canariensis forest 28◦350N 27◦150W 10.4 (−) 460 0.45 3.9 2.50 726 17
James Reserve forest Quercus/Pinus forest 33◦480N 116◦460W 9.0 (6.6) 507 0.30 – 4.05 892 18
James Reserve woody Quercus/Pinus forest 33◦480N 116◦460W 11.8 (6.7) 507 0.30 1.7 1.9 764 19 James Reserve herb. Eriogonum wrightii 33◦480N 116◦460W 10.8 (7.9) 507 0.30 1.7 1.25 524 19 Yatir forest Pinus halepensis forest 31◦200N 35◦030E 20.7 (7.9) 280 0.19 1.2–2.5 2.68 458 20 Semi-arid shrubland Sarcopoterium spinosum 31◦230N 34◦540E 21.7 (7.6) 300 0.18 1.6 4.22 731 21 Semi-arid shrubland Intershrub microsite 31◦230N 34◦540E 22.9 (8.9) 300 0.18 1.4 2.25 345 21
Dry subhumid shrubland Sarcopoterium spinosum 31◦420N 35◦030E 19.1 (6.6) 540 0.32 1.6 3.89 754 21
Dry subhumid shrubland Intershrub microsite 31◦420N 35◦030E 21.2 (8.2) 540 0.32 1.8 3.87 660 21
2.3 Monte Carlo analysis
Monte Carlo methods are a class of computational algorithms that rely on repeated random sampling to compute their re-sults. Here, we used a Monte Carlo analysis for theoreti-cally testing the hypothesized relationship between SRMAT
and SRannual for random combinations of SRMAT, Tsd and Q10, constrained to a range of values commonly occurring
across the globe (see also Table 1 and Fig. 2). Our anal-ysis was based on 1000 random combinations of SRMAT
(range 0–8.0 µmol m−2s−1), Tsd (2–15◦C) and Q10 (1.0–
6.0). The variables were generated from independent Gaus-sian distributions with the following means and standard de-viations, which were derived from the available field data: 2.66 (s.d.=0.98) for Q10, 2.89 (1.48) for SRMAT, and 6.7
(1.8) for Tsd.
2.4 Aridity index
A generally comparable aridity index for all sites was derived by relating estimates of precipitation (P ) to estimates of po-tential evaporation (PET), which were obtained as follows. Potential evapotranspiration was calculated according to the Modified-Hargreaves method (Droogers and Allen, 2002). This method uses potential radiation (top of atmosphere), av-erage air temperature (2 m), the diurnal temperature range as well as precipitation as predictors. Global monthly grids at 0.5◦ resolution were calculated and extracted for each site from the grid cell closest to the site. Air temperature grids were derived from CRU (Climate Research Unit) climate data (New et al., 2002), homogenized and extended to 2007 ( ¨Osterle et al., 2003). Precipitation data were obtained from the GPCC project (Global Global Preciptiation Climatology
M. Bahn et al.: Soil respiration at mean annual temperature predicts annual total across vegetation types 2151
Table 2. Methods for measuring soil respiration for previously unpublished datasets. References as in Table 1. CDS and ODS refer to closed
and open dynamic system, respectively.
Site (Reference) System and instrumentation Replication, sampling frequency
Vanuatu (7) CDS, Li-6000-09 chamber + Li-6200 64 collars, monthly
(Licor)
Itatinga (11) CDS, Li8100-103 survey chamber 27 collars (20 cm), bi-weekly + Li8100 Licor, (Licor)
Kondi (12) CDS, Li8100-102 survey chamber + 27 collars (10 cm), bi-weekly
Li8100 (Licor)
Puechabon (13) ODS (cf. Rayment and Jarvis, 1997) 4–12 chambers, continuous Las Majadas del Tietar (14) ODS (cf. Rayment and Jarvis, 1997), 6 chambers, continuous
Li6262 (Licor)
James Reserve forest (18) CDS, as in (Carbone et al., 2008) 8 chambers, continuous Semi-arid and dry subhumid CDS, LI-6400-09 + Li-6400 (Licor) 10 collars, bi-weekly to monthly shrublands (20)
Centre; cf. gpcc.dwd.de for documentation). For each loca-tion potential evapotranspiraloca-tion and precipitaloca-tion were ex-tracted for 27 years (1982–2008) and averaged on a monthly and an annual basis. Extracted mean annual precipitation closely matched the values reported for the sites (Table 1; MAPpredicted=1.02·MAPmeasured, R2=0.88).
3 Results and discussion
3.1 Theoretical considerations
Major drivers of SR include abiotic (temperature, soil mois-ture) and biotic (gross primary productivity) factors (Bahn et al., 2009; Davidson et al., 2006a; Trumbore, 2006). Even though differences in SR across sites are largely determined by productivity, both of these fluxes increase with temper-ature. Therefore soil temperature (T ) typically suffices to explain most of the seasonal variation of SR in ecosystems without extended periods of drought (Bahn et al., 2008; Hibbard et al., 2005; Janssens et al., 2001; Reichstein et al., 2003). Thus, SRannualof these sites can be estimated from a
temperature response function, as based on SR at a reference temperature, the temperature sensitivity of SR (Q10, the
fac-tor by which SR is multiplied when the temperature increases by 10◦C) and the seasonal course of T . We define the mean annual temperature occurring at any site as the reference tem-perature, which permits the most generalized testing of our hypothesis across different climates.
Theoretically, if T is constant throughout the year (i.e. its standard deviation is 0), Q10will have no effect on SRannual.
In this case SR at mean annual temperature (SRMAT) scales
directly to SRannual, and their ratio expressed on the same
basis (i.e. mean SRannual/SRMAT) equals 1 (Fig. 1). As the
seasonal amplitude of temperature (Tsd, defined as the
stan-dard deviation of daily mean soil temperature over the course
0 1 2 3 4 5 6 0 2 4 6 8 10 12 14 Tsd (°C) m ean S Ran n u al /S RMA T Q10 = 4 Q10 = 3 Q10 = 2 Q10 = 1 Q10>4 Q10=3-4 Q10=2-3 Q10=1-2 Q10 > 4 Q10 = 3-4 Q10 = 2-3 Q10 = 1-2
Fig. 1. The ratio of mean annual soil respiration (mean SRannual, µmol m−2s−1) over soil respiration at mean annual temperature (SRMAT, µmol m−2s−1) as affected by the annual variation of soil
temperature (Tsd)and Q10of the temperature – soil respiration
re-lationship. Data points indicate values of the non water-limited sites for mean SRannual/SRMAT, Tsdand Q10classes.
of the year) increases, Q10becomes increasingly important
because the temperature response of SR is not linear. Hence the degree to which Q10 affects mean SRannual/SRMAT
in-creases with increasing Tsd (Fig. 1). A recently emerging
global dataset of sites (FLUXNET; http://www.fluxdata.org/ default.aspx; Baldocchi, 2008) indicates that Tsd increases
from tropical to temperate and continental climates (Fig. 2). The median of Tsd was 0.7◦C at tropical sites and between
5.5 and 7.4◦C in all other climates, 95% of all values being lower than 10.1◦C. Exceptionally high values of Tsd
exceed-ing 10.5◦C occurred in three non-forested ecosystems, two of which were burned open shrubland. Thus Tsd normally
Tsd 12.5 10.0 7.5 5.0 2.5 0.0 climate Tsd 12.5 10.0 7.5 5.0 2.5 0.0 climate
Fig. 2. Annual variation of soil temperature (Tsd) in different
cli-matic regions. Boxplots for 172 Fluxnet sites as grouped to the different bioclimatic regions. n=7, 6, 47, 49, 35, 24 and 4 for tropi-cal, dry, subtropical/Mediterranean, temperate, temperate continen-tal, boreal and arctic climates, respectively.
remains well within the range where Q10 exerts a minor
influence on the relationship between SRMAT and SRannual
(Fig. 1).
Q10 values measured in situ have been reported to be
normally in the range of 2–4 (Davidson et al., 2006a; Kirschbaum, 2006). Similarly, for the non-water limited temperate and boreal sites reported in this study Q10 was
between 1.9 and 5.7, 90% of the values ranging between 2 and 5 (Table 1). To visualize the range of Tsd, Q10and mean
SRannual/SRMAT for the non-water-limited sites of our study
in relation to the theoretical relationships, the respective data were included in Fig. 1. For clarity of the graph, Q10 was
grouped to classes of 1–2, 2–3, 3–4 and >4. When the ob-served values match the theoretical relationship very closely, reported Q10 values of 1–2 should thus fall in between the
lines depicted for Q10=1 and 2, and so on. The
correspon-dence between data points and theoretical lines is generally poor. However, Fig. 1 clearly shows that Tsdfalls in a range
where Q10 is theoretically expected to have a minor effect
on mean SRannual/SRMAT. Therefore, we hypothesize that
SRMAT and SRannual are generally well coupled across non
water-limited sites.
Using a Monte Carlo analysis we tested the hypothesized relationship between SRMAT and SRannual for 1000 random
combinations of SRMAT, Tsdand Q10, constrained to a range
of values commonly occurring across the globe (cf. meth-ods). Our results confirm that such a relationship is theoreti-cally likely to exist and indicate that only very few (i.e. ca. 10 out of 1000) random combinations of exceptionally high Tsd
and Q10will result in marked deviations from an overall
re-lationship (Fig. 3). This does not reflect a bias in the Monte Carlo analysis, but is fully consistent with what is to be
0 2000 4000 6000 8000 10000 0 2 4 6 8 10 SRMAT (µmol CO2 m -2 s-1) SR a nnua l (g C m -2 y -1) 6.0_11.1 5.2_10.3 3.9_ 11.2 4.7_ 8.6 3.6_ 11.4 4.0_ 10.8 4.8_ 9.5 4.3_ 10.7
Fig. 3. Hypothetical relationship between soil respiration at mean annual temperature (SRMAT) and total soil annual
respi-ration (SRannual) for 1000 random combinations of SRMAT, Tsd
and Q10, as obtained by a Monte Carlo simulation. Regression:
SRannual=455.8 SR1.0054MAT , R2=0.94, p<0.001. Numbers in graph
indicate Q10and Tsdfor exceptionally high values of SRannual.
theoretically expected (Fig. 1), because of the non-linearity of the respiration response to temperature. However, would the suggested relationship between SRMATand SRannualalso
occur in and across real ecosystems? If so, very few mea-surements of SR around the mean annual temperature would be sufficient to estimate SRannual.
3.2 Inter-site relationships
We tested the hypothesis first on a range of non water-limited ecosystems, including 35 sites of temperate and bo-real forests and grasslands, and a tropical plantation (Ta-ble 1). Across sites we observed a highly constrained, slightly non-linear relationship between SRMATand SRannual
(Fig. 4a). Both theoretical considerations and field observa-tions thus confirm the hypothesis that SRMAT and SRannual
are tightly coupled across non water-limited sites. This strik-ing convergence is in principle related to the inherent rela-tionship between these parameters at likely combinations of
Tsdand Q10(Fig. 1).
To assess the robustness of our analysis we re-calculated the regression for SRMAT versus SRannual for the 36
non-water limited sites leaving out one site at a time (cross-validation approach). The probability density function for the 36 sites is not significantly different from a normal dis-tribution (using a One-Sample Kolmogorov-Smirnov Test). Then we calculated the related bias for these new estima-tions. The mean of all the sites is 1.01±0.159 (s.d.; min-imum =0.69; maxmin-imum =1.4). The site that is underesti-mated is ITex (1998); and the site that is overestiunderesti-mated is Cow Park (UK). The results are not significantly different from the ones that we showed in the initial analysis giving
M. Bahn et al.: Soil respiration at mean annual temperature predicts annual total across vegetation types 2153 0 500 1000 1500 2000 0 500 1000 1500 2000 SRannual predicted (g C m-2 y-1) B 0 500 1000 1500 2000 0 1 2 3 4 5 6 SRMAT (µmol CO2 m-2 s-1) SR annual (g C m -2 y -1 ) A
Fig. 4. (A) Relationship between soil respiration at mean annual temperature (SRMAT, µmol CO2m−2s−1) and total annual soil respiration (SRannual, g C m−2y−1) for 57 forests, plantations, savannas, grasslands and shrublands across boreal, temperate, tropical, mediterranean,
dry sub-humid and semi-arid biomes. The regression is based on all 36 sites where precipitation/potential evapotranspiration (P /PET) exceeds 1 and no distinct dry season occurs (
23
Figure legends
Fig. 1. The ratio of mean annual soil respiration (mean SR
annual, µmol m
-2s
-1) over soil
respiration at mean annual temperature (SR
MAT, µmol m
-2s
-1) as affected by the annual
variation of soil temperature (T
sd) and Q
10of the temperature - soil respiration relationship.
Data points indicate values of the non water-limited sites for mean SR
annual/ SR
MAT, T
sdand
Q
10classes.
Fig. 2. Annual variation of soil temperature (T
sd) in different climatic regions. Boxplots for
172 Fluxnet sites as grouped to the different bioclimatic regions. n = 7, 6, 47, 49, 35, 24 and 4
for tropical, dry, subtropical /mediterranean, temperate, temperate continental, boreal and
arctic climates, respectively.
Fig. 3: Hypothetical relationship between soil respiration at mean annual temperature
(SR
MAT) and total soil annual respiration (SR
annual) for 1000 random combinations of SR
MAT,
T
sdand
Q
10,
as
obtained
by
a
Monte
Carlo
simulation.
Regression:
SR
annual= 455.8 SR
MAT1.0054, R
2= 0.94, p < 0.001. Numbers in graph indicate Q
10and T
sdfor
exceptionally high values of SR
annual.
Fig. 4. (A) Relationship between soil respiration at mean annual temperature (SR
MAT,
µmol CO
2m
-2s
-1) and total annual soil respiration (SR
annual, g C m
-2y
-1) for 57 forests,
plantations, savannas, grasslands and shrublands across boreal, temperate, tropical,
mediterranean, dry sub-humid and semi-arid biomes. The regression is based on all 36 sites
where precipitation/ potential evapotranspiration (P/ PET) exceeds 1 and no distinct dry
season occurs (closed circles:
●
) (SR
annual= 436.2 SR
MAT0.926, R
2= 0.94, p < 0.001). Shaded
and open circles indicate seasonally dry sites where SR
MATwas based on annual (
●
) and wet
(
○
) season data, respectively. (B) Predicted versus observed annual soil respiration for all 80
site-years (SR
annualobserved
= 1.06 SR
annualpredicted
0.988, R
2= 0.94, p < 0.001). For
seasonally dry sites SR
MATwas corrected by an aridity factor (Fig. 5 A) whenever only wet
season SR
MATwas available. Dotted line represents the 1:1 line. Symbols as in Fig. 4 A.
Triangles represent the interannual data for four temperate forest sites, as shown in Fig. 6 (
▲
Harvard 1997-2008,
▲
Howland 2000-2008,
▲
Hesse 1996-1998,
∆ Soroe 1996-1998).
) (SRannual= 436.2 SR0.926MAT, R2=0.94, p<0.001). Shaded and open circles indicate seasonally
dry sites where SRMATwas based on annual (
23
Figure legends
Fig. 1. The ratio of mean annual soil respiration (mean SR
annual, µmol m
-2s
-1) over soil
respiration at mean annual temperature (SR
MAT, µmol m
-2s
-1) as affected by the annual
variation of soil temperature (T
sd) and Q
10of the temperature - soil respiration relationship.
Data points indicate values of the non water-limited sites for mean SR
annual/ SR
MAT, T
sdand
Q
10classes.
Fig. 2. Annual variation of soil temperature (T
sd) in different climatic regions. Boxplots for
172 Fluxnet sites as grouped to the different bioclimatic regions. n = 7, 6, 47, 49, 35, 24 and 4
for tropical, dry, subtropical /mediterranean, temperate, temperate continental, boreal and
arctic climates, respectively.
Fig. 3: Hypothetical relationship between soil respiration at mean annual temperature
(SR
MAT) and total soil annual respiration (SR
annual) for 1000 random combinations of SR
MAT,
T
sdand
Q
10,
as
obtained
by
a
Monte
Carlo
simulation.
Regression:
SR
annual= 455.8 SR
MAT1.0054, R
2= 0.94, p < 0.001. Numbers in graph indicate Q
10and T
sdfor
exceptionally high values of SR
annual.
Fig. 4. (A) Relationship between soil respiration at mean annual temperature (SR
MAT,
µmol CO
2m
-2s
-1) and total annual soil respiration (SR
annual, g C m
-2y
-1) for 57 forests,
plantations, savannas, grasslands and shrublands across boreal, temperate, tropical,
mediterranean, dry sub-humid and semi-arid biomes. The regression is based on all 36 sites
where precipitation/ potential evapotranspiration (P/ PET) exceeds 1 and no distinct dry
season occurs (closed circles:
●
) (SR
annual= 436.2 SR
MAT0.926, R
2= 0.94, p < 0.001). Shaded
and open circles indicate seasonally dry sites where SR
MATwas based on annual (
●
) and wet
(
○
) season data, respectively. (B) Predicted versus observed annual soil respiration for all 80
site-years (SR
annualobserved
= 1.06 SR
annualpredicted
0.988, R
2= 0.94, p < 0.001). For
seasonally dry sites SR
MATwas corrected by an aridity factor (Fig. 5 A) whenever only wet
season SR
MATwas available. Dotted line represents the 1:1 line. Symbols as in Fig. 4 A.
Triangles represent the interannual data for four temperate forest sites, as shown in Fig. 6 (
▲
Harvard 1997-2008,
▲
Howland 2000-2008,
▲
Hesse 1996-1998,
∆ Soroe 1996-1998).
) and wet (
23
Figure legends
Fig. 1. The ratio of mean annual soil respiration (mean SR
annual, µmol m
-2s
-1) over soil
respiration at mean annual temperature (SR
MAT, µmol m
-2s
-1) as affected by the annual
variation of soil temperature (T
sd) and Q
10of the temperature - soil respiration relationship.
Data points indicate values of the non water-limited sites for mean SR
annual/ SR
MAT, T
sdand
Q
10classes.
Fig. 2. Annual variation of soil temperature (T
sd) in different climatic regions. Boxplots for
172 Fluxnet sites as grouped to the different bioclimatic regions. n = 7, 6, 47, 49, 35, 24 and 4
for tropical, dry, subtropical /mediterranean, temperate, temperate continental, boreal and
arctic climates, respectively.
Fig. 3: Hypothetical relationship between soil respiration at mean annual temperature
(SR
MAT) and total soil annual respiration (SR
annual) for 1000 random combinations of SR
MAT,
T
sdand
Q
10,
as
obtained
by
a
Monte
Carlo
simulation.
Regression:
SR
annual= 455.8 SR
MAT1.0054, R
2= 0.94, p < 0.001. Numbers in graph indicate Q
10and T
sdfor
exceptionally high values of SR
annual.
Fig. 4. (A) Relationship between soil respiration at mean annual temperature (SR
MAT,
µmol CO
2m
-2s
-1) and total annual soil respiration (SR
annual, g C m
-2y
-1) for 57 forests,
plantations, savannas, grasslands and shrublands across boreal, temperate, tropical,
mediterranean, dry sub-humid and semi-arid biomes. The regression is based on all 36 sites
where precipitation/ potential evapotranspiration (P/ PET) exceeds 1 and no distinct dry
season occurs (closed circles:
●
) (SR
annual= 436.2 SR
MAT0.926, R
2= 0.94, p < 0.001). Shaded
and open circles indicate seasonally dry sites where SR
MATwas based on annual (
●
) and wet
(
○
) season data, respectively. (B) Predicted versus observed annual soil respiration for all 80
site-years (SR
annualobserved
= 1.06 SR
annualpredicted
0.988, R
2= 0.94, p < 0.001). For
seasonally dry sites SR
MATwas corrected by an aridity factor (Fig. 5 A) whenever only wet
season SR
MATwas available. Dotted line represents the 1:1 line. Symbols as in Fig. 4 A.
Triangles represent the interannual data for four temperate forest sites, as shown in Fig. 6 (
▲
Harvard 1997-2008,
▲
Howland 2000-2008,
▲
Hesse 1996-1998,
∆ Soroe 1996-1998).
) season data, respectively. (B) Predicted versus observed annual soil respiration for all 80 site-years (SRannualobserved =1.06 SRannualpredicted0.988, R2=0.94, p<0.001). For seasonally dry sites SRMATwas corrected
by an aridity factor (Fig. 5a) whenever only wet season SRMATwas available. Dotted line represents the 1:1 line. Symbols as in Fig. 4a.
Triangles represent the interannual data for four temperate forest sites, as shown in Fig. 6 (
23 Figure legends
Fig. 1. The ratio of mean annual soil respiration (mean SRannual, µmol m-2 s-1) over soil
respiration at mean annual temperature (SRMAT, µmol m-2 s-1) as affected by the annual
variation of soil temperature (Tsd) and Q10 of the temperature - soil respiration relationship.
Data points indicate values of the non water-limited sites for mean SRannual/ SRMAT, Tsd and
Q10 classes.
Fig. 2. Annual variation of soil temperature (Tsd) in different climatic regions. Boxplots for
172 Fluxnet sites as grouped to the different bioclimatic regions. n = 7, 6, 47, 49, 35, 24 and 4 for tropical, dry, subtropical /mediterranean, temperate, temperate continental, boreal and arctic climates, respectively.
Fig. 3: Hypothetical relationship between soil respiration at mean annual temperature (SRMAT) and total soil annual respiration (SRannual) for 1000 random combinations of SRMAT,
Tsd and Q10, as obtained by a Monte Carlo simulation. Regression:
SRannual = 455.8 SRMAT1.0054, R2= 0.94, p < 0.001. Numbers in graph indicate Q10 and Tsd for
exceptionally high values of SRannual.
Fig. 4. (A) Relationship between soil respiration at mean annual temperature (SRMAT,
µmol CO2 m-2 s-1) and total annual soil respiration (SRannual, g C m-2 y-1) for 57 forests,
plantations, savannas, grasslands and shrublands across boreal, temperate, tropical, mediterranean, dry sub-humid and semi-arid biomes. The regression is based on all 36 sites where precipitation/ potential evapotranspiration (P/ PET) exceeds 1 and no distinct dry season occurs (closed circles: ●) (SRannual = 436.2 SRMAT0.926, R2 = 0.94, p < 0.001). Shaded
and open circles indicate seasonally dry sites where SRMAT was based on annual (●) and wet
(○) season data, respectively. (B) Predicted versus observed annual soil respiration for all 80 site-years (SRannual observed = 1.06 SRannual predicted0.988, R2 = 0.94, p < 0.001). For
seasonally dry sites SRMAT was corrected by an aridity factor (Fig. 5 A) whenever only wet
season SRMAT was available. Dotted line represents the 1:1 line. Symbols as in Fig. 4 A.
Triangles represent the interannual data for four temperate forest sites, as shown in Fig. 6 (▲
Harvard 1997-2008, ▲ Howland 2000-2008, ▲Hesse 1996-1998, ∆ Soroe 1996-1998).
: Harvard 1997–2008,
23 Figure legends
Fig. 1. The ratio of mean annual soil respiration (mean SRannual, µmol m-2 s-1) over soil
respiration at mean annual temperature (SRMAT, µmol m-2 s-1) as affected by the annual
variation of soil temperature (Tsd) and Q10 of the temperature - soil respiration relationship.
Data points indicate values of the non water-limited sites for mean SRannual/ SRMAT, Tsd and
Q10 classes.
Fig. 2. Annual variation of soil temperature (Tsd) in different climatic regions. Boxplots for
172 Fluxnet sites as grouped to the different bioclimatic regions. n = 7, 6, 47, 49, 35, 24 and 4 for tropical, dry, subtropical /mediterranean, temperate, temperate continental, boreal and arctic climates, respectively.
Fig. 3: Hypothetical relationship between soil respiration at mean annual temperature (SRMAT) and total soil annual respiration (SRannual) for 1000 random combinations of SRMAT,
Tsd and Q10, as obtained by a Monte Carlo simulation. Regression:
SRannual = 455.8 SRMAT 1.0054
, R2= 0.94, p < 0.001. Numbers in graph indicate Q10 and Tsd for
exceptionally high values of SRannual.
Fig. 4. (A) Relationship between soil respiration at mean annual temperature (SRMAT,
µmol CO2 m-2 s-1) and total annual soil respiration (SRannual, g C m-2 y-1) for 57 forests,
plantations, savannas, grasslands and shrublands across boreal, temperate, tropical, mediterranean, dry sub-humid and semi-arid biomes. The regression is based on all 36 sites where precipitation/ potential evapotranspiration (P/ PET) exceeds 1 and no distinct dry season occurs (closed circles: ●) (SRannual = 436.2 SRMAT0.926, R2 = 0.94, p < 0.001). Shaded
and open circles indicate seasonally dry sites where SRMAT was based on annual (●) and wet
(○) season data, respectively. (B) Predicted versus observed annual soil respiration for all 80 site-years (SRannual observed= 1.06 SRannual predicted
0.988
, R2= 0.94, p < 0.001). For seasonally dry sites SRMAT was corrected by an aridity factor (Fig. 5 A) whenever only wet
season SRMAT was available. Dotted line represents the 1:1 line. Symbols as in Fig. 4 A.
Triangles represent the interannual data for four temperate forest sites, as shown in Fig. 6 (▲
Harvard 1997-2008, ▲: Howland 2000–2008, Howland 2000-2008, ▲Hesse 1996-1998, ∆ Soroe 1996-1998).
23 Figure legends
Fig. 1. The ratio of mean annual soil respiration (mean SRannual, µmol m -2
s-1) over soil respiration at mean annual temperature (SRMAT, µmol m-2 s-1) as affected by the annual
variation of soil temperature (Tsd) and Q10 of the temperature - soil respiration relationship.
Data points indicate values of the non water-limited sites for mean SRannual/ SRMAT, Tsd and
Q10 classes.
Fig. 2. Annual variation of soil temperature (Tsd) in different climatic regions. Boxplots for
172 Fluxnet sites as grouped to the different bioclimatic regions. n = 7, 6, 47, 49, 35, 24 and 4 for tropical, dry, subtropical /mediterranean, temperate, temperate continental, boreal and arctic climates, respectively.
Fig. 3: Hypothetical relationship between soil respiration at mean annual temperature (SRMAT) and total soil annual respiration (SRannual) for 1000 random combinations of SRMAT,
Tsd and Q10, as obtained by a Monte Carlo simulation. Regression:
SRannual = 455.8 SRMAT1.0054, R2= 0.94, p < 0.001. Numbers in graph indicate Q10 and Tsd for
exceptionally high values of SRannual.
Fig. 4. (A) Relationship between soil respiration at mean annual temperature (SRMAT,
µmol CO2 m-2 s-1) and total annual soil respiration (SRannual, g C m-2 y-1) for 57 forests,
plantations, savannas, grasslands and shrublands across boreal, temperate, tropical, mediterranean, dry sub-humid and semi-arid biomes. The regression is based on all 36 sites where precipitation/ potential evapotranspiration (P/ PET) exceeds 1 and no distinct dry season occurs (closed circles: ●) (SRannual = 436.2 SRMAT0.926, R2 = 0.94, p < 0.001). Shaded and open circles indicate seasonally dry sites where SRMAT was based on annual (●) and wet
(○) season data, respectively. (B) Predicted versus observed annual soil respiration for all 80 site-years (SRannual observed = 1.06 SRannual predicted0.988, R2 = 0.94, p < 0.001). For
seasonally dry sites SRMAT was corrected by an aridity factor (Fig. 5 A) whenever only wet
season SRMAT was available. Dotted line represents the 1:1 line. Symbols as in Fig. 4 A.
Triangles represent the interannual data for four temperate forest sites, as shown in Fig. 6 (▲
Harvard 1997-2008, ▲ Howland 2000-2008, ▲: Hesse 1996–1998, whiteHesse 1996-1998, ∆ Soroe 1996-1998).
23
Figure legends
Fig. 1. The ratio of mean annual soil respiration (mean SRannual, µmol m-2 s-1) over soil
respiration at mean annual temperature (SRMAT, µmol m-2 s-1) as affected by the annual
variation of soil temperature (Tsd) and Q10 of the temperature - soil respiration relationship.
Data points indicate values of the non water-limited sites for mean SRannual/ SRMAT, Tsd and
Q10 classes.
Fig. 2. Annual variation of soil temperature (Tsd) in different climatic regions. Boxplots for
172 Fluxnet sites as grouped to the different bioclimatic regions. n = 7, 6, 47, 49, 35, 24 and 4 for tropical, dry, subtropical /mediterranean, temperate, temperate continental, boreal and arctic climates, respectively.
Fig. 3: Hypothetical relationship between soil respiration at mean annual temperature (SRMAT) and total soil annual respiration (SRannual) for 1000 random combinations of SRMAT,
Tsd and Q10, as obtained by a Monte Carlo simulation. Regression:
SRannual = 455.8 SRMAT1.0054, R2= 0.94, p < 0.001. Numbers in graph indicate Q10 and Tsd for
exceptionally high values of SRannual.
Fig. 4. (A) Relationship between soil respiration at mean annual temperature (SRMAT,
µmol CO2 m-2 s-1) and total annual soil respiration (SRannual, g C m-2 y-1) for 57 forests,
plantations, savannas, grasslands and shrublands across boreal, temperate, tropical, mediterranean, dry sub-humid and semi-arid biomes. The regression is based on all 36 sites where precipitation/ potential evapotranspiration (P/ PET) exceeds 1 and no distinct dry season occurs (closed circles:
●
) (SRannual = 436.2 SRMAT0.926, R2 = 0.94, p < 0.001). Shadedand open circles indicate seasonally dry sites where SRMAT was based on annual (
●
) and wet(
○
) season data, respectively. (B) Predicted versus observed annual soil respiration for all 80 site-years (SRannual observed = 1.06 SRannual predicted 0.988, R2 = 0.94, p < 0.001). Forseasonally dry sites SRMAT was corrected by an aridity factor (Fig. 5 A) whenever only wet
season SRMAT was available. Dotted line represents the 1:1 line. Symbols as in Fig. 4 A.
Triangles represent the interannual data for four temperate forest sites, as shown in Fig. 6 (▲
Harvard 1997-2008, ▲ Howland 2000-2008, ▲Hesse 1996-1998, ∆ Soroe 1996-1998). : Soroe 1996–1998).
that the mean of the prediction is 1.01 at each particular site when that site is excluded. Therefore this new approach is consistent with our previous results and does not change our conclusions. The 95% confidence interval of the predic-tions made with the reported regressions is between 70% and 132% of the measured annual total.
We extended our analysis to seasonally dry ecosystems, including 6 seasonally dry tropical rainforests and planta-tions, and 15 mediterranean, dry sub-humid and semi-arid forests, savannas, grasslands and shrublands (Table 1). Irre-spective of site aridity the relationship of SRMATand SRannual
persisted when MAT occurred during both dry and wet sea-son, which was typically the case for all tropical sites, but also some semi-arid ecosystems (Fig. 4a). Whenever MAT occurred only during the wet season (i.e. when soil temper-ature exceeded MAT throughout the dry season), observed SRannual was lower than would be estimated from SRMAT.
SRannualis overestimated from SRMATmeasured only during
the wet season, as its direct inference from SRMATdoes not
account for the fact that during the dry season SR may be substantially reduced due to water limitations. This reduc-tion can be corrected for (Fig. 4b), since it is strongly related to site aridity, as expressed by the ratio P /PET (Fig. 5a) or the number of months when P /PET<1 (Fig. 5b). However, it should be noted that a general aridity index does not ac-count for the interannual variability of precipitation, which may decisively alter seasonal patterns and thus the annual to-tal of SR (Ma et al., 2007). Clearly, more studies are needed that corroborate the relationships of site aridity, SRMAT and
SRannualfor seasonally dry ecosystems.
We tested the model output against the observed values (Fig. 4b) using a paired t-test. First, we only used the 36 non water-limited sites with the predicted values from the re-gression without each one of the sites. There were no sig-nificant differences between observed values and predicted (t=−0.032, P =0.974). Then we calculated the changes in the
P/PET correction factor, excluding case by case and recal-culating the equation. Finally, the predicted annual total SR was recalculated accounting for both changes in the P /PET correction factor and the overall relationship of SRMAT and
SRannualoccurring when each of the sites is left out at a time.
Again, a paired t-test did not yield any significant differences between measured and predicted values.
We estimated the prediction uncertainty for the overall dataset by calculating the root mean squared error (RMSE). For the whole dataset RMSE was 625 g C m−2y−1for non water-limited sites, 404 g C m−2y−1 for sites for which an
P/PET correction factor was applied, and 618 g C m−2y−1
for all sites. Stratified by four flux levels RMSE
was 203 g C m−2y−1 (SRannual = 0–500 g C m−2y−1),
191 g C m−2y−1 (SRannual = 500–1000 g C m−2y−1),
300 g C m−2y−1 (SRannual = 1000–1500 g C m−2y−1) and
262 g C m−2y−1 (SRannual = 1500–2000 g C m−2y−1),
corresponding to a relative error of 51, 27, 24 and 14%, respectively. In comparison, within-site uncertainty esti-mates of annual SR have been reported to be in the range of 9–25%, in some instances even up to 40–90% of SRannual
2154 M. Bahn et al.: Soil respiration at mean annual temperature predicts annual total across vegetation types 0.0 0.5 1.0 1.5 2.0 2.5 3.0 -1 1 3 5 7 9 11
number of months with P/PET < 1
B 0.0 0.5 1.0 1.5 2.0 2.5 3.0 0.0 0.5 1.0 1.5 2.0 2.5 P/PET SR a nnu a l pr edi c te d/ S R an n u a l obse rv e d A
Fig. 5. Ratio of predicted to observed annual soil respiration (SRannual) in relation to site aridity, as expressed by (A) the ratio of precipitation to potential evapotranspiration (P /PET) and (B) the number of dry months (P /PET<1). Symbols as in Fig. 4. Regression equations and statistics for (A): SRannualpredicted/observed =−0.601 Ln(P /PET)+1.278, R2=0.82, p<0.001; for (B): SRannualpredicted/observed =1.92 10−3x2.823+0.908, where x is the number of months with P /PET<1 (R2=0.78, p<0.001).
3.3 Interannual variation
It has been demonstrated that cross-site relationships may not reflect well within-site variability and may thus not be well suitable for deriving estimates for individual sites (for below-ground C allocation see e.g. Gower et al., 1996; Litton et al., 2007). As shown above, the inter-site relationship is robust and the 95% confidence interval of the predictions made with the reported regressions is between 70% and 132% of the correct annual total, as based on a cross-validation approach leaving out one site at a time.
Using the cross-site relationship, SRMATobtained across
years within a single site predicts SRannual similarly as
does SRMAT from across sites (Fig. 4b). RMSE for the
two sites with larger number of site years, Howland Forest (9 years) and Harvard Forest (12 years), amounts to 204 and 219 g C m−2y−1, respectively, corresponding to a relative
er-ror of 26% in both cases. Thus, measurement of SRMAT
in any of these years would have provided an estimate of SRannual within the prediction uncertainty of the cross-site
relationship (cf. above). This likely holds also for excep-tionally dry years or seasons, as occurred at Harvard forest in 1997 and 1999 (Fig. 6). Nevertheless, it should again be stressed that at arid sites, a fixed correction factor relating to average site aridity, may fail to account for effects caused by a distinct interannual (i.e. year-to-year) variation in precipi-tation (cf. above).
Figure 6 shows that within-site relationships between SRMATand SRannual, as based on the available site-years for
four temperate forest sites, may or may not follow the trend observed across sites, the slope differing most distinctly for Howland forest, where also only a minor amount of the inter-annual variation was explained by the regression. This may also have to do with the fact that at this site the interannual variation of SRannualwas comparatively small (Fig. 6). Thus,
0 500 1000 0 1 2 3 SRMAT (µmol CO2 m -2 s-1 ) SR a nnua l (g C m -2 y -1 )
Fig. 6. Interannual variation of soil respiration at mean annual
tem-perature (SRMAT, µmol CO2m−2s−1) and total annual soil
respi-ration (SRannual, g C m−2y−1) for four temperate forest sites (
23 Figure legends
Fig. 1. The ratio of mean annual soil respiration (mean SRannual, µmol m-2 s-1) over soil
respiration at mean annual temperature (SRMAT, µmol m-2 s-1) as affected by the annual
variation of soil temperature (Tsd) and Q10 of the temperature - soil respiration relationship.
Data points indicate values of the non water-limited sites for mean SRannual/ SRMAT, Tsd and
Q10 classes.
Fig. 2. Annual variation of soil temperature (Tsd) in different climatic regions. Boxplots for
172 Fluxnet sites as grouped to the different bioclimatic regions. n = 7, 6, 47, 49, 35, 24 and 4 for tropical, dry, subtropical /mediterranean, temperate, temperate continental, boreal and arctic climates, respectively.
Fig. 3: Hypothetical relationship between soil respiration at mean annual temperature (SRMAT) and total soil annual respiration (SRannual) for 1000 random combinations of SRMAT,
Tsd and Q10, as obtained by a Monte Carlo simulation. Regression:
SRannual = 455.8 SRMAT1.0054, R2= 0.94, p < 0.001. Numbers in graph indicate Q10 and Tsd for
exceptionally high values of SRannual.
Fig. 4. (A) Relationship between soil respiration at mean annual temperature (SRMAT,
µmol CO2 m-2 s-1) and total annual soil respiration (SRannual, g C m-2 y-1) for 57 forests,
plantations, savannas, grasslands and shrublands across boreal, temperate, tropical, mediterranean, dry sub-humid and semi-arid biomes. The regression is based on all 36 sites where precipitation/ potential evapotranspiration (P/ PET) exceeds 1 and no distinct dry season occurs (closed circles: ●) (SRannual = 436.2 SRMAT0.926, R2 = 0.94, p < 0.001). Shaded
and open circles indicate seasonally dry sites where SRMAT was based on annual (●) and wet
(○) season data, respectively. (B) Predicted versus observed annual soil respiration for all 80 site-years (SRannual observed = 1.06 SRannual predicted0.988, R2 = 0.94, p < 0.001). For
seasonally dry sites SRMAT was corrected by an aridity factor (Fig. 5 A) whenever only wet
season SRMAT was available. Dotted line represents the 1:1 line. Symbols as in Fig. 4 A.
Triangles represent the interannual data for four temperate forest sites, as shown in Fig. 6 (▲
Harvard 1997-2008, ▲ Howland 2000-2008, ▲Hesse 1996-1998, ∆ Soroe 1996-1998).
: Harvard 1997–2008,
23 Figure legends
Fig. 1. The ratio of mean annual soil respiration (mean SRannual, µmol m-2 s-1) over soil
respiration at mean annual temperature (SRMAT, µmol m-2 s-1) as affected by the annual
variation of soil temperature (Tsd) and Q10 of the temperature - soil respiration relationship.
Data points indicate values of the non water-limited sites for mean SRannual/ SRMAT, Tsd and
Q10 classes.
Fig. 2. Annual variation of soil temperature (Tsd) in different climatic regions. Boxplots for
172 Fluxnet sites as grouped to the different bioclimatic regions. n = 7, 6, 47, 49, 35, 24 and 4 for tropical, dry, subtropical /mediterranean, temperate, temperate continental, boreal and arctic climates, respectively.
Fig. 3: Hypothetical relationship between soil respiration at mean annual temperature (SRMAT) and total soil annual respiration (SRannual) for 1000 random combinations of SRMAT,
Tsd and Q10, as obtained by a Monte Carlo simulation. Regression:
SRannual = 455.8 SRMAT1.0054, R2= 0.94, p < 0.001. Numbers in graph indicate Q10 and Tsd for
exceptionally high values of SRannual.
Fig. 4. (A) Relationship between soil respiration at mean annual temperature (SRMAT,
µmol CO2 m-2 s-1) and total annual soil respiration (SRannual, g C m-2 y-1) for 57 forests,
plantations, savannas, grasslands and shrublands across boreal, temperate, tropical, mediterranean, dry sub-humid and semi-arid biomes. The regression is based on all 36 sites where precipitation/ potential evapotranspiration (P/ PET) exceeds 1 and no distinct dry season occurs (closed circles: ●) (SRannual = 436.2 SRMAT0.926, R2 = 0.94, p < 0.001). Shaded and open circles indicate seasonally dry sites where SRMAT was based on annual (●) and wet
(○) season data, respectively. (B) Predicted versus observed annual soil respiration for all 80 site-years (SRannual observed= 1.06 SRannual predicted 0.988, R2= 0.94, p < 0.001). For
seasonally dry sites SRMAT was corrected by an aridity factor (Fig. 5 A) whenever only wet
season SRMAT was available. Dotted line represents the 1:1 line. Symbols as in Fig. 4 A.
Triangles represent the interannual data for four temperate forest sites, as shown in Fig. 6 (▲
Harvard 1997-2008, ▲: Howland 2000–2008, Howland 2000-2008, ▲Hesse 1996-1998, ∆ Soroe 1996-1998).
23 Figure legends
Fig. 1. The ratio of mean annual soil respiration (mean SRannual, µmol m-2 s-1) over soil
respiration at mean annual temperature (SRMAT, µmol m-2 s-1) as affected by the annual
variation of soil temperature (Tsd) and Q10 of the temperature - soil respiration relationship.
Data points indicate values of the non water-limited sites for mean SRannual/ SRMAT, Tsd and
Q10 classes.
Fig. 2. Annual variation of soil temperature (Tsd) in different climatic regions. Boxplots for
172 Fluxnet sites as grouped to the different bioclimatic regions. n = 7, 6, 47, 49, 35, 24 and 4 for tropical, dry, subtropical /mediterranean, temperate, temperate continental, boreal and arctic climates, respectively.
Fig. 3: Hypothetical relationship between soil respiration at mean annual temperature (SRMAT) and total soil annual respiration (SRannual) for 1000 random combinations of SRMAT,
Tsd and Q10, as obtained by a Monte Carlo simulation. Regression:
SRannual = 455.8 SRMAT 1.0054
, R2= 0.94, p < 0.001. Numbers in graph indicate Q10 and Tsd for
exceptionally high values of SRannual.
Fig. 4. (A) Relationship between soil respiration at mean annual temperature (SRMAT,
µmol CO2 m-2 s-1) and total annual soil respiration (SRannual, g C m-2 y-1) for 57 forests,
plantations, savannas, grasslands and shrublands across boreal, temperate, tropical, mediterranean, dry sub-humid and semi-arid biomes. The regression is based on all 36 sites where precipitation/ potential evapotranspiration (P/ PET) exceeds 1 and no distinct dry season occurs (closed circles: ●) (SRannual = 436.2 SRMAT0.926, R2 = 0.94, p < 0.001). Shaded
and open circles indicate seasonally dry sites where SRMAT was based on annual (●) and wet
(○) season data, respectively. (B) Predicted versus observed annual soil respiration for all 80 site-years (SRannual observed = 1.06 SRannual predicted0.988, R2 = 0.94, p < 0.001). For
seasonally dry sites SRMAT was corrected by an aridity factor (Fig. 5 A) whenever only wet
season SRMAT was available. Dotted line represents the 1:1 line. Symbols as in Fig. 4 A.
Triangles represent the interannual data for four temperate forest sites, as shown in Fig. 6 (▲
Harvard 1997-2008, ▲ Howland 2000-2008, ▲: Hesse 1996–Hesse 1996-1998, ∆ Soroe 1996-1998).
1998,
23
Fig. 1. The ratio of mean annual soil respiration (mean SRannual, µmol m-2 s-1) over soil
respiration at mean annual temperature (SRMAT, µmol m-2 s-1) as affected by the annual
variation of soil temperature (Tsd) and Q10 of the temperature - soil respiration relationship.
Data points indicate values of the non water-limited sites for mean SRannual/ SRMAT, Tsd and
Q10 classes.
Fig. 2. Annual variation of soil temperature (Tsd) in different climatic regions. Boxplots for
172 Fluxnet sites as grouped to the different bioclimatic regions. n = 7, 6, 47, 49, 35, 24 and 4 for tropical, dry, subtropical /mediterranean, temperate, temperate continental, boreal and arctic climates, respectively.
Fig. 3: Hypothetical relationship between soil respiration at mean annual temperature (SRMAT) and total soil annual respiration (SRannual) for 1000 random combinations of SRMAT,
Tsd and Q10, as obtained by a Monte Carlo simulation. Regression:
SRannual = 455.8 SRMAT1.0054, R2= 0.94, p < 0.001. Numbers in graph indicate Q10 and Tsd for
exceptionally high values of SRannual.
Fig. 4. (A) Relationship between soil respiration at mean annual temperature (SRMAT,
µmol CO2 m-2 s-1) and total annual soil respiration (SRannual, g C m-2 y-1) for 57 forests,
plantations, savannas, grasslands and shrublands across boreal, temperate, tropical, mediterranean, dry sub-humid and semi-arid biomes. The regression is based on all 36 sites where precipitation/ potential evapotranspiration (P/ PET) exceeds 1 and no distinct dry season occurs (closed circles:
●
) (SRannual = 436.2 SRMAT0.926, R2 = 0.94, p < 0.001). Shadedand open circles indicate seasonally dry sites where SRMAT was based on annual (
●
) and wet(
○
) season data, respectively. (B) Predicted versus observed annual soil respiration for all 80 site-years (SRannual observed = 1.06 SRannual predicted 0.988, R2 = 0.94, p < 0.001). Forseasonally dry sites SRMAT was corrected by an aridity factor (Fig. 5 A) whenever only wet
season SRMAT was available. Dotted line represents the 1:1 line. Symbols as in Fig. 4 A.
Triangles represent the interannual data for four temperate forest sites, as shown in Fig. 6 (▲
Harvard 1997-2008, ▲ Howland 2000-2008, ▲Hesse 1996-1998, ∆ Soroe 1996-1998). : Soroe 1996–1998). Data for Harvard forest include two exceptionally dry summers (marked by red outlines). The dot-ted line indicates the cross-site relationship between SRMAT and
SRannualdata, as shown in Fig. 4a.
the cross-site relationship between SRMATand SRannualmay
not be well suited for estimating the interannual variation of SRannual, though it may provide an indication of trends if this
variation is large. However, such trends are likely obscured by the comparatively large overall prediction uncertainties discussed above.