Publisher’s version / Version de l'éditeur:
Vous avez des questions? Nous pouvons vous aider. Pour communiquer directement avec un auteur, consultez la Questions? Contact the NRC Publications Archive team at
[email protected]. If you wish to email the authors directly, please see the first page of the publication for their contact information.
https://publications-cnrc.canada.ca/fra/droits
L’accès à ce site Web et l’utilisation de son contenu sont assujettis aux conditions présentées dans le site LISEZ CES CONDITIONS ATTENTIVEMENT AVANT D’UTILISER CE SITE WEB.
nter-Noise 2011: 4 September 2011, Osaka, Japan [Proceedings], pp. 1-6,
2011-09-04
READ THESE TERMS AND CONDITIONS CAREFULLY BEFORE USING THIS WEBSITE.
https://nrc-publications.canada.ca/eng/copyright
NRC Publications Archive Record / Notice des Archives des publications du CNRC :
https://nrc-publications.canada.ca/eng/view/object/?id=b71575b7-9f5b-45ac-b26d-a7901d200e74 https://publications-cnrc.canada.ca/fra/voir/objet/?id=b71575b7-9f5b-45ac-b26d-a7901d200e74
NRC Publications Archive
Archives des publications du CNRC
This publication could be one of several versions: author’s original, accepted manuscript or the publisher’s version. / La version de cette publication peut être l’une des suivantes : la version prépublication de l’auteur, la version acceptée du manuscrit ou la version de l’éditeur.
Access and use of this website and the material on it are subject to the Terms and Conditions set forth at
Dependency between standardized heavy impact sound pressure level
and receiving room properties
De pe nde nc y be t w e e n st a nda rdize d he a vy im pa c t sound pre ssure
le ve l a nd re c e iving room prope rt ie s
N R C C - 5 4 4 7 6
S c h o e n w a l d , S . ; Z e i t l e r , B . ; N i g h t i n g a l e , T .
S e p t e m b e r 2 0 1 1
A version of this document is published in / Une version de ce document se trouve dans:
Inter-noise 2011, Osaka, Japan, September 4-7, 2011, pp. 1-6
http://www.nrc-cnrc.gc.ca/irc
The material in this document is covered by the provisions of the Copyright Act, by Canadian laws, policies, regulations and international agreements. Such provisions serve to identify the information source and, in specific instances, to prohibit reproduction of materials without written permission. For more information visit http://laws.justice.gc.ca/en/showtdm/cs/C-42
Les renseignements dans ce document sont protégés par la Loi sur le droit d'auteur, par les lois, les politiques et les règlements du Canada et des accords internationaux. Ces dispositions permettent d'identifier la source de l'information et, dans certains cas, d'interdire la copie de documents sans permission écrite. Pour obtenir de plus amples renseignements : http://lois.justice.gc.ca/fr/showtdm/cs/C-42
1
Dependency between Standardized Heavy Impact Sound Pressure
Level and Receiving Room Properties
Stefan Schoenwald1, Berndt Zeitler2, and Trevor Nightingale3
1,2,3
National Research Council – Institute for Research in Construction 1200 Montreal Road, Building M-27, Ottawa (Ontario) K1A 0R6 Canada
ABSTRACT
Low frequency impact sound is a common problem in residential buildings. Japan and Korea acknowledge this issue in their standards (JIS 1418-2, KS F 2810-2) with test protocols for measuring low frequency impact sound using two unique heavy impact sources. One is a well-defined small car tire - the “bang-machine” - and the other is a rubber ball. Both are dropped from defined heights on the floor under investigation. In the receiving room the fast-weighted maximum sound pressure level of the generated sound impulse is averaged over several drop and receiver positions. As opposed to the light impact standards (JIS 1418-1, KS F 2810-1), the receiving room properties, namely volume and absorption, are not taken into account during post processing of measurement data. Results of a recent study, in which nominally identical floors were tested in two facilities that differ grossly in volume and absorption, are be presented in this paper. A dependency between the measured heavy impact sound pressure levels and the receiving room properties was established. Thus, measured data must be normalized to volume and absorption to allow a comparison of heavy impact sound ratings of different facilities or in-situ. For the normalization to the room volume, an existing method of other protocols (ISO 10140 for quasi-stationary impact sound) was applied to heavy impact sound data and validated. However, for absorption the existing methods failed. A new normalization term was derived theoretically for the fast-weighted maximum sound pressure level of a sound impulse and validated with heavy impact sound measurements.
Keywords: Impact Sound Insulation, Impact Sound Measurement, Impact Sound Normalization
1. INTRODUCTION
Currently, different methods of measuring and rating impact sound insulation of floors are defined in national and international standards. Even though the methods are all based on a common measurement principal, i.e. the floor under test is excited mechanically in the source room and the generated sound is measured in a receiving room, there are mayor differences regarding impact sources and data processing.
The most common method is defined in ISO 10140-3 and ISO 140-7. Here, a standard tapping machine is used to excite the floor with hammers that are driven by an electric motor and produce quasi-stationary noise in the receiving room, where the time averaged sound pressure level is measured. For stationary noise events, it is well understood that the sound pressure level depends on the receiving room properties, namely room size and room absorption. Thus, the measured levels are normalized by the room volume and reverberation time to obtain an independent quantity - the so-called normalized impact sound pressure level - that enables comparison of impact sound insulation performance of floors measured in different laboratories and the field.
In the Japanese JIS A 1418-2 and Korean KS F 2810-2 standards a different approach is used. Here the floor is struck with a standardized heavy soft impact source, a tire of a small car (“bang-machine”), or a rubber ball that are dropped from 85 cm and 100 cm respectively. The rubber ball source and measurement procedure was also recently introduced in an informative annexe of ISO-standards as an alternative impact source. Both sources excite the floor especially in the low frequency range and the generated noise impulse is intended to simulate people walking barefoot or children jumping. Further, data acquisition and processing for heavy sources also differ from the quasi-stationary sources, since the time averaged sound pressure level is not suitable to describe the sound power in the room due to a transient event, as it depends also on the chosen averaging time. Thus, the maximum F(ast)-weighted sound pressure level of the impact Li,F,max is measured in octave bands from 63 Hz to 1 [email protected] 2 [email protected] 3 [email protected]
500 Hz and directly used to rate the impact sound insulation. The receiving room properties are not taken into account in the measurement procedure as it is assumed that the maximum F-weighted sound pressure level is independent of room volume and absorption.
However, this paper shows that this assumption does not hold as it was already suggested by other authors [1-2]. Hence, heavy impact sound insulation ratings measured in different laboratories or in rooms in the field with different furnishing conditions cannot be compared using the current standardized measurement procedure. Therefore, two normalization methods of F-weighted sound pressure level to room volume and room absorption are proposed and validated in this paper.
2. Measurement Set-Up
In the first part of this paper the influence of the receiving room volume and reverberation time on the measured sound pressure level are investigated experimentally. All measurements were carried out in the NRC-IRC Flanking Facility. The facility consists of an outer shell with high sound isolation. The space inside the shell is divided by 4 floor and 8 wall assemblies into eight rooms (around 40 m3 each) with four rooms on two floors. The walls and floors under test are connected as in real buildings to characterize direct and flanking transmission. However, in this study measures were taken to suppress flanking sufficiently so that the data presented here are reasonable estimates of the direct transmission through the floor-ceiling assembly.
The rubber “ball” was used in this study because it is easier to use than the “bang machine”. Nevertheless, results and findings of this paper are valid for both sources, bang machine as well as rubber ball, since test procedure and signal processing are identical. For each test the ball was dropped at nine positions (one in the centre, 2 on each room diagonal and 4 in-between the points on the diagonals) in the upper source rooms. The facility is equipped with an automated data acquisition system with a robot in each room that moves a microphone to nine fixed measurement positions. The sound pressure level is measured in all 8 rooms simultaneously.
3. Receiving Room Volume Study
3.1 Test Methodology
For the receive volume study a common wood frame floor and wall assembly was installed as test specimen. Three tests were carried out and the receiving room volume was systematically increased between the tests by simply removing gypsum board and cavity absorption of the partition walls between the room directly under the source room and adjacent rooms on the lower level. The impact sound pressure level in each of subsequently larger receiving rooms is the average of two or three rooms respectively. Fortunately, by removing the walls only the volume was increased and the change of the reverberation time was negligible because the sound absorption in this facility is mostly due to absorption by facility surfaces forming the room boundaries and the surface to volume ratio of the rooms was comparable. Thus, the measured change of the impact sound pressure level can be related directly to the change of the room volume from 43.7 m3 to 81.4 m3 and to 115.8 m3.
3.2 Test Results and Analysis
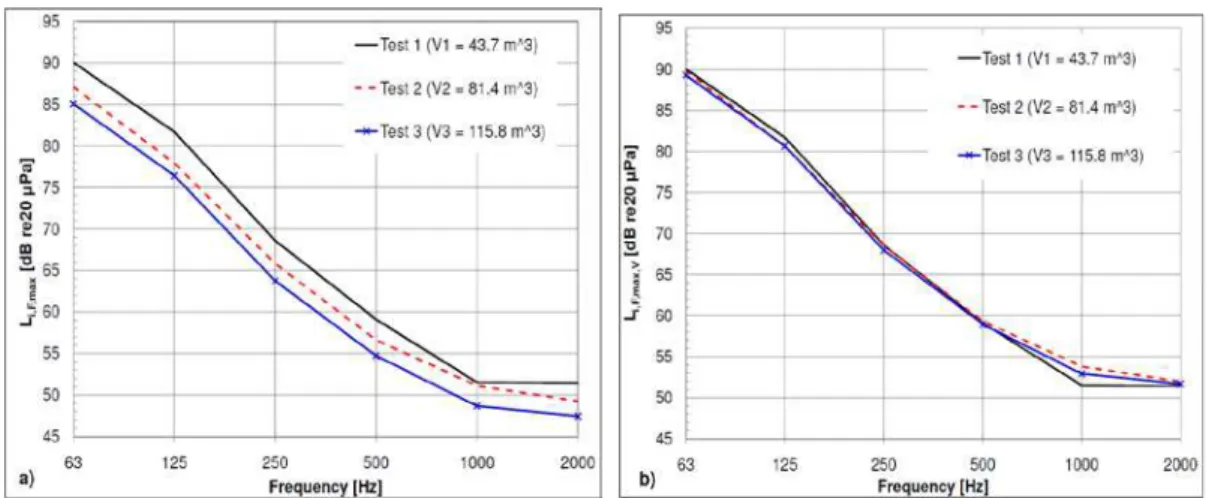
The impact sound pressure levels measured in the three receive rooms of different volume are presented in Figure 1a. Since reverberation time was equal for all measurements, the graphs clearly indicate a bias associated with receiving room volumes – impact sound pressure level Li,F,max decreases with increasing receive room volume. The effect is largely frequency independent. The difference of the results of test 1 (receive room volume: 43.7 m3) and test 2 (receive room volume: 81.4 m3) is about 3 dB suggesting the level scales with the ratio of the volume.
Thus, Equation 1 is applied to the measurement results analogously to the normalization procedure of steady state signals to a reference room volume in ISO 10140. The last term on the right hand side is neglected in this receiving room volume study, since reverberation time T is similar for all room volumes.
(
1 2)
1
2
L
10
lg
V
V
L
S=
S+
⋅
(1)The adjusted impact sound pressure levels are shown in Figure 1b and the difference of the impact sound pressure levels is much less than 1 dB in most of the frequency range.
3
Figure 1 - Change of Li,F,max with receiving room volume - a) measured Li,F,max, b) levels normalized to V1 Thus, impact sound pressure levels measured according to JIS 1418-2 depend on the receiving room volume and results measured with grossly different receiving room volumes must be corrected according to Equation 1 before comparison.
4. Receiving Room Absorption Study
4.1 Test Methodology
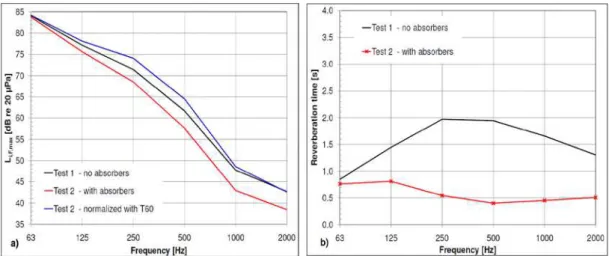
During the absorption study a different wood frame flanking specimen was installed in the facility and the impact sound pressure level was measured twice between the same room pair. For the second measurement several 50 mm thick foam panels were placed on the floor and on facility walls of the receiving room to increase the sound absorption and to shorten the reverberation time, especially in the mid and high frequency range. Unfortunately, the absorbers were not very effective in the low frequency range, and it was not possible to use thicker absorbers because movement of the microphone positioning system limited the available space in the chamber.
4.2 Test Results
Figure 2a shows the measured impact sound pressure levels, while Figure 2b shows the reverberation time T, for the two absorption conditions. The measured impact sound pressure level Li,F,max is much lower in the mid- and high frequency range where the reverberation time of the situation with absorbers is much shorter. Thus, the assumption that Li,F,max is independent of room absorption clearly does not hold. Normalization to both, room volume, and absorption, is necessary if impact sound pressure levels are to be compared.
As a first trial, the blue curve in Figure 2a shows the sound pressure level of Test 2 with absorption that was normalized according to Equation 1 as for steady-state sources with the reverberation time of Figure 2b. The normalized results agree well with reference Test 1 in the high frequency and low frequency range where the room absorption did not change significantly. In-between the normalized results overestimate the impact sound pressure level by about 3 dB and hence the simple normalization according to Equation 1 is not ideal.
4.3 Theoretical analysis on change of Li,F,max as function of reverberation time, T
The relationship between Li,F,max and the reverberation time was further investigated theoretically. A detailed analysis with derivation of all equations is out of the scope of this paper and presented in Reference [3]. Here only the process and mayor results are outlined and discussed. The analysis investigates only the effect of the time weighting which is independent of frequency and thus derived results are valid for all frequency bands. Time-weighted levels are a running average of a time variant signal derived from RC-averaging circuits of analog level meters. The time-constants are chosen to simulate the reaction of human hearing on noise events to be properly displayed on the sound level meter. F(ast)-weighting is originally used for noise with constant and slowly changing amplitude, but it was found that it is also suitable for short impulses.
Distortion of the signal due to ringing of band filters was not investigated further as it is negligible in the frequency range considered for heavy impact measurement if octave band filters are used.
Figure 2. Change of Li,F,max with receive room absorption - a) Li,F,max, b) reverberation time T 4.3.1 F-weighting of a Room Impulse Response
First, an analytical function for an ideal decay of the sound pressure in a room with reverberation time T that was excited by an ideal impulse causing an un-weighted peak sound pressure pPeak at t = 0 s was derived. The instantaneous F-weighted sound pressure level LF of this time variant signal is given theoretically as the convolution integral of the squared time variant sound pressure decay with the impulse response function of the exponential time-weighting filter. This integral was solved analytically after some simple manipulations as it is shown by Schoenwald et al. [3] resulting in Equation 2. The instantaneous F-weighted sound level LF in a room is given as function of time t, peak pressure pPeak, reference pressure p0 = 20 µPa, reverberation time T, and the exponential fast time weighting constant RC = 0.125 s.
(
)
(
)
[
] [
]
[
]
{
2}
0 2 Peak F(
t
)
10
lg
exp
13
.
82
t
T
exp
t
RC
1
13
.
82
RC
T
p
p
L
=
−
−
−
−
⋅
⋅
(2) 0 0.4 0.8 1.2 1.6 2 2.4 2.8 3.2 0 10 20 30 40 50 60 70 LF [dB re (2 0µPa) 2] T ime [s] T = 12.8 s T = 6.4 s T = 3.2 s T = 1.6 s T = 0.05 sPeak Level LPeak
L
F,max
Figure 3. F-weighted sound pressure level LF of ideal impulse responses with T from 0.05 s to 12.8 s LF calculated according to Equation 2 is presented in Figure 3 for reverberation times ranging from 0.05 s to 12.8 s. The dashed red line indicates the linear peak level LPeak of 60 dB that is equal for all room impulse responses at t = 0s with a peak pressure of pPeak = 20 mPa. LF is always smaller than LPeak. The maximum LF,max occurs with some time delay and both, LF,max and time delay, increase with longer reverberation times. The time delay indicates that LF,max takes into account the direct wave front from the source but to some degree also early reflections that are attenuated by the room absorption. Thus, LF,max is function of reverberation time of the considered room.
The rise of LF versus time has a much steeper absolute slope before LF,max than the decay has after LF,max for all reverberation times. For longer reverberation times of T ≥ 1.8 s, the decay rate of the level is determined by the room absorption, whereas for T ≤ 1.8 s the decay rate is equal to the equivalent decay time of the exponential time filter.
5
The graphs in Figure 3 are characteristic for time-variant voltages in RC-circuits. Charging and discharging of a capacitor smoothes and delays the actual change of the voltage. Analogously to the sound level, if the voltage is not applied long enough the capacitor will not be fully charged and hence the peak voltage will not be reached.
4.3.2 LF,max as Function of T
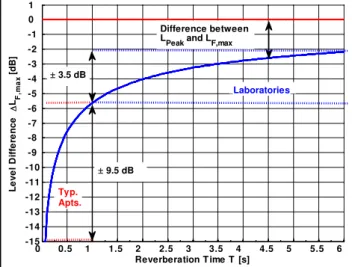
LF,max is the maximum of Equation 2 that can be easily obtained analytically from the zeros of its time derivative. In Figure 4 the difference, ΔLF,max, of the invariant LPeak and LF,max is plotted as a function for typical values of reverberation time T. The gradient of ΔLF,max is greatest for room impulse responses with very short reverberation times and even approaches -∞ for T → 0. For long reverberation times the gradient of ΔLF,max is smaller and LF,max asymptotically approaches LPeak for T → ∞.
Ranges of reverberation times in typical rooms are marked in Figure 4. In a furnished North American living room the reverberation time usually ranges from 0.2 s to 1 s in all frequency bands [4]. In this range LF,max has a spread of about 9.5 dB and thus, the measured heavy impact sound pressure level Li,F,max depends on the reverberation time of the receive room. In laboratories the rooms are unfurnished with hard wall and floor surfaces and tend to have a much higher reverberation times with a much larger range - usually between 1 s to 6 s. However, the resulting spread of Li,F,,max is only 3.5 dB in laboratories.
The influence of room absorption is more important for heavy impact sound pressure measurements in furnished apartments than for measurements in laboratories. However, results measured in laboratories with long reverberation times can not directly be applied to predict sound isolation in a building situation. Heavy impact sound pressure levels might be grossly overestimated – by up to 13 dB going from T = 6 s in the lab to T = 0.2 s in the field - if room volume is kept equal.
0 0.5 1 1.5 2 2.5 3 3.5 4 4.5 5 5.5 6 -15 -14 -13 -12 -11 -10 -9 -8 -7 -6 -5 -4 -3 -2 -1 0 1 Le ve l D iffe re nce ∆ LF ,m a x [dB] Reverberation T ime T [s] Typ. Apts. ± 9.5 dB ± 3.5 dB Difference between LPeak and LF,max
Laboratories
Figure 4 - Difference of LPeak and LF,max of ideal impulse responses as function of T 4.4 Normalization Term for Li,F,max
A new term for adjustment of Li,F,max to a particular room size or furnishing condition is given by Equation 3. The volume term is equal to that from Equation 1 for steady state levels, but the term in Equation 4 for the adjustment of the reverberation time, CorrT, is different and was derived analytically from Equation 2.
)
Corr
(
lg
10
V
V
lg
10
L
L
T 2 1 1 S max, , F , i 2 S max, , F , i=
+
−
(3) ( )(
)
( )(
)
,
with
C
T
(
13
.
82
RC
)
C
C
C
C
C
1
C
1
Corr
Tj j C 1 2 T C 1 2 T C 1 1 T C 1 1 T 1 1 T 1 2 T T 1 1 2 T 1 2 T 1 1 1 T 1 1 T⋅
=
−
−
⋅
−
−
=
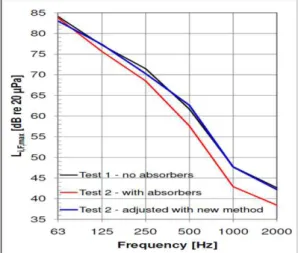
− − − − − − − − − − − − − − (4)Again the results of Figure 2 are used to assess the accuracy of Equation 7 and raw data as well as the adjusted are presented in Figure 5. The agreement of Li,F,max without absorbers to the adjusted results with absorbers is very good in the low frequency range below 1000 Hz that determines the single number rating for lightweight assemblies. The difference is much less than 1 dB in this
frequency range whereas it is slightly bigger than 1 dB above, overall still believed to be lower than the repeatability error of heavy impact tests.
Figure 5 - Adjustment of impact sound pressure levels to receive room sound absorption
5. Conclusions
The maximum F-weighted sound pressure level Li,F,max is dependent on receiving room volume and absorption. Thus, an assumption implicit to JIS 1418-2 and KS F 2810-2 does not hold.
The important consequence is measurement results from different test facilities or measured in dwellings with different size and furnishing conditions cannot be compared directly. Further, it is shown that the simple normalization according to ISO 10140 for steady state sources is only valid for the room volume. Normalization using the reverberation time, T, and this method will fail and will usually overestimate the effect of the room absorption. A theoretical analysis on the F-weighting of an ideal room impulse response with arbitrary reverberation time revealed that the Li,F,max is measured with some time delay after the peak level. Thus, Li,F,max takes into account the besides the peak level due to the direct sound wave from the impact also the early reflection that depend on the absorption in the room. Li,F,max is indeed a function of reverberation time the change is not linear and for short reverberation times much greater than for longer ones.
Therefore, test standards should be changed and require reporting room volume and reverberation times along with Li,F,max. The analytically derived correction term for the reverberation time that was proposed and validated in this paper should also be introduced in the standards, since it is very useful to compare results for Li,F,max from different facilities or to predict the performance of an tested assembly in the field to achieve a cost effective building design. Desirable would also be normalization of the measurement results to a common reference values for volume and reverberation time, similar to the reference absorption area of 10 m2 for light impact and airborne sound insulation according to ISO 10140.
REFERENCES
[1] H. Takahashi, H. Yasuoka “Experimental study on relating between sound absorbing material and floor impact sound in laboratory”, Proceedings of INCE-Japan, 2006
[2] S. Hirota, H. Suzuki, M. Tanaka “Study report on sound insulation performance between upper and lower floors with ceiling crawl space of wood frame construction”, The Third (2006) Tsuboi Memorial Research Grant, March 2007.
[3] S. Schoenwald, B. Zeitler, T.R.T. Nightingale “Influence of receive room properties on impact sound pressure level measured with heavy impact sources”, NRC-IRC Research Report 303, 2010
[4] Bradley, J.S. “Acoustical measurements in some Canadian homes”, Canadian Acoustics/Acoustique Canadienne, 14, (4), pp. 19-21, 24-25. 1986