Publisher’s version / Version de l'éditeur:
Vous avez des questions? Nous pouvons vous aider. Pour communiquer directement avec un auteur, consultez la
première page de la revue dans laquelle son article a été publié afin de trouver ses coordonnées. Si vous n’arrivez
Questions? Contact the NRC Publications Archive team at
PublicationsArchive-ArchivesPublications@nrc-cnrc.gc.ca. If you wish to email the authors directly, please see the first page of the publication for their contact information.
https://publications-cnrc.canada.ca/fra/droits
L’accès à ce site Web et l’utilisation de son contenu sont assujettis aux conditions présentées dans le site LISEZ CES CONDITIONS ATTENTIVEMENT AVANT D’UTILISER CE SITE WEB.
ICETECH 2010: 9th International Conference and Exhibition on Performance of
Ships and Structures in Ice [Proceedings], 2010-09-20
READ THESE TERMS AND CONDITIONS CAREFULLY BEFORE USING THIS WEBSITE. https://nrc-publications.canada.ca/eng/copyright
NRC Publications Archive Record / Notice des Archives des publications du CNRC :
https://nrc-publications.canada.ca/eng/view/object/?id=7f67b1b8-6f5d-4e67-9e47-d438f59255e3
https://publications-cnrc.canada.ca/fra/voir/objet/?id=7f67b1b8-6f5d-4e67-9e47-d438f59255e3
NRC Publications Archive
Archives des publications du CNRC
This publication could be one of several versions: author’s original, accepted manuscript or the publisher’s version. / La version de cette publication peut être l’une des suivantes : la version prépublication de l’auteur, la version acceptée du manuscrit ou la version de l’éditeur.
Access and use of this website and the material on it are subject to the Terms and Conditions set forth at
Operational limitations of conventional lifeboats operating in sea ice
Operational Limitations of Conventional Lifeboats Operating in Sea Ice
Allison Kennedy
Memorial University of Newfoundland St. John’s, NL, Canada Allison.Kennedy@nrc-cnrc.gc.ca
Antonio Simões Ré
Institute for Ocean Technology, National Research Council St. John’s, NL, Canada
Antonio.Simoes_Re@nrc-cnrc.gc.ca
Brian Veitch
Memorial University of Newfoundland St. John’s, NL, Canada
bveitch@mun.ca
ABSTRACT
Conventional lifeboats have not been designed to withstand ice impactloads. It is uncertain if these boats have the structural capacity to withstand a collision with either level or concentrated pack ice. The main objective of the research reported here is to determine the structural limitations of conventional lifeboats in order to help devise safe operating procedures for lifeboats in ice.
KEY WORDS: Lifeboat; ice interaction; limitation; load;
impact.
INTRODUCTION
Aim of Work
The aim of this work is to assess key performance limitations of lifeboats operating in ice. Of particular interest are the structural limitations in various ice conditions. To gain insight into this, laboratory and field experiments were conducted and used in the development of a simple semi-empirical model to represent a conventional lifeboat interacting with ice. This work can provide insight into the design of an ice-capable lifeboat.
Scope of Work
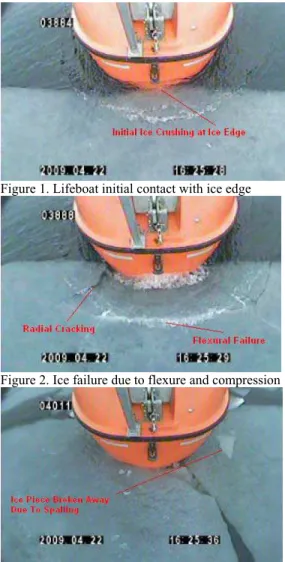
Ice failure can occur in different modes depending on loading speed, loading magnitude and contact geometry. Ice can exhibit continuum behavior as well as fracture behavior. Continuum behavior is apparent for small strain rates and thus does not describe the typical behavior of ice upon contact with a lifeboat. Ice fracture behavior includes several modes, such as crushing, flexural failure, radial cracking and spalling (Sanderson, 1988). These modes are represented in Figures 1-3, which illustrate a typical lifeboat interaction with level ice.
Figure 1. Lifeboat initial contact with ice edge
Figure 2. Ice failure due to flexure and compression
Upon initial contact, crushing occurs at the ice edge. The ice continues to fail due to crushing until either the lifeboat comes to a stop or the ice flexural limit is exceeded. In the case that the ice flexural limit is exceeded, the ice fails due to flexural failure and an ice cusp forms. An ice cusp is shown forming around the lifeboat in Figures 1 and 2. Interactions involving thick ice are likely to have all energy consumed in ice crushing or structural failure before the flexural capacity is reached.
The limitations of a lifeboat in ice are a function of the laminate strength, the ice conditions and the ice failure mechanism. The failure mode is directly linked to the ice conditions: strength, thickness and type. Lifeboats are typically constructed of laminate material. The extent to which the hull deforms plays a role in the magnitude of the impact force from an ice collision.
EXPERIMENTATION
Laboratory experiments and field tests were conducted to explore lifeboat-ice interaction. Tensile tests were conducted to determine the effect of parameters on lifeboat laminate strength. Hydraulic ram tests were performed to define the impact limitations of lifeboat laminate. Pendulum tests involving ice spheres impacting a full-scale lifeboat were executed to determine empirical values required for modeling and to prepare a data acquisition system for field testing. Level and pack ice impact data were collected during field trials performed in Triton, Newfoundland, and used for comparison with modeling predictions.
Tensile Tests
There are a number of factors that are thought to affect the tensile strength of fiberglass. The factors that were assessed in this study include material lay-up, specimen temperature, heat treatment, submergence and pre-stress. A set of tests were conducted to determine which of these factors significantly affected the tensile strength of fiberglass. The tensile tests followed ASTM standards (1996). The test results were analyzed using methods of design of experiments.
Factor Selection
A primary consideration of the tensile tests was the effect of material lay-up on fiberglass tensile strength. Limitations in the quantity of actual lifeboat material available prevented all laboratory testing from being completed on the same material. Replicated lifeboat laminate panels were prepared in accordance with the lay-up and materials used in the lifeboat. The laminate lay-up of the resin and cloth was selected based on the results of a burn test completed on a piece of the original lifeboat laminate. To compare the strength test results of replicated and actual lifeboat fiberglass, an assessment was made concerning the reaction of each material to loading. The remaining four factors selected for assessment in the study were temperature, heat treatment, submergence and pre-stress, which are factors that lifeboats are regularly subjected to in their life cycle and may affect the material strength.
Specimen Preparation
This section describes the preparation of the tensile samples prior to testing. The tensile samples were cut to standard test size, then milled to their requisite thickness in a milling machine, and subjected to treatments.
Specimen Temperature
Chilled and room temperature specimens were considered. The chilled specimens were cooled to –20oC in a freezer and then transferred to the test site in an insulated carrier. Prior to testing the temperature of the specimens was measured using a digital thermometer. The tests were
conducted at a temperature of –10oC. The room temperature tests were done at 22oC.
Specimen Heat Treatment
The heat treatment of specimens involved the following four steps. First the specimens were cooled to approximately –20oC and left at this temperature for 24 hours. The specimens were then removed from the cold room and warmed to room temperature for approximately 8 hours. They were then returned to the cold room again for an additional 24 hours to cool at –20oC. The specimens were removed from the cold room and allowed to adjust to room temperature.
Specimen Submergence
The specimens were submerged in fresh water at 18oC for seven hours. After immersion the specimens were dried prior to any other treatments and prior to testing.
Specimen Pre-Stress
Each specimen was pre-stressed by hanging a 5 kg mass from its midpoint for 21 hours. While the weights were in place the specimens were supported at each endpoint leaving the mid section unsupported.
Tensile test conclusions
The tensile tests showed that heat treatment and pre-stress were significant factors. The material-type did not significantly influence the tensile strength. This indicated that replicated laminate material was representative of actual lifeboat laminate at least in terms of tensile strength.
Hydraulic Ram Tests
In the hydraulic ram tests, a fiberglass panel was impacted with a steel ram head until puncture occurred. Various sized fiberglass panels at both cold and warm temperatures were impacted. The purpose of the tests was to determine the limiting loads of lifeboat hull material and to establish the effect of panel size and temperature. The hydraulic ram tests followed ISO standards (2000).
Data Acquisition System
The data acquisition system for the hydraulic ram tests included three video cameras and a dynamometer that was contained within the hydraulic ram itself. The dynamometer measured both the impact force and the deflection of the panel. One camera was positioned on the side of the panel and lights were arranged so that clear pictures could be obtained of the experiments. A second video camera was positioned in front of the panel viewing both the hydraulic ram and the panel while a third small video camera was positioned underneath the panel to obtain an underside view of the deformation. Force and displacement were sampled at 20 Hz.
Hydraulic Ram Test Findings
The main findings from the analysis of the hydraulic ram tests are outlined below. These conclusions are all related to the impact behavior of lifeboat fiberglass.
1. The temperature of the panels did not have a significant effect on maximum force.
2. Panels tested at lower temperatures had higher maximum displacement.
3. A change in panel temperature significantly affected the impact energy relating to ultimate failure of fiberglass. 4. An increase in panel size resulted in an increase in the
maximum displacement of fiberglass prior to fracture. 5. An increase in panel size lead to a decrease in panel failure
6. Panel size variation had a negligible effect on maximum force.
7. Impactor shape affected the panel deformation pattern. 8. Replicated lifeboat laminate panels differed from actual
lifeboat panels in terms of maximum impact force and displacement, but were similar in terms of panel failure energy.
Pendulum Tests
A set of experiments were designed and conducted using a modified 20-person Totally Enclosed Motor Propelled Survival Craft (TEMPSC). The lifeboat modifications included the installation of port and starboard acrylic impact panels to the hull. These panels were mounted on force dynamometers in the bow area of the TEMPSC. To accommodate the panels and force dynamometers, two sea chests were manufactured and incorporated into the hull structure. These sea chests were water proofed and sealed to the inside of the vessel, totally enclosing the dynamometers as well as internal video cameras.
The experiments involved suspending ice spheres from a line acting as a pendulum. The sphere was then set at a specified angle and allowed to follow in the pendulum’s natural arc until impact with the panel. There were three main objectives of the pendulum tests. The first was to calibrate ice loads for field conditions. The second was to ensure that the modified lifeboat was prepared for field trials. The final objective was to determine the coefficient of restitution between the lifeboat hull and ice.
Test Set Up
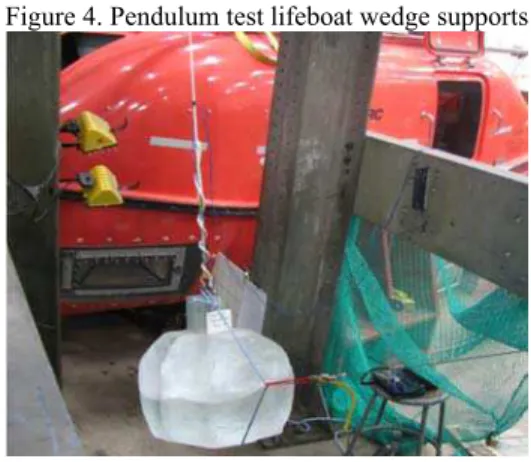
The lifeboat was placed in chocks and braced using a strap over the bow which was secured to two wedge-shaped concrete supports on either side of the craft. The strap was tightened to limit the motion of the lifeboat upon impact. The support wedges were located in close proximity to the hull to restrict motion and were of sufficient weight to hold the lifeboat in place. Twelve sand bags weighing 22.7 kg (50 lbs) each were positioned inside the lifeboat for added weight during the impact tests.
The main frame support for suspending the pendulum consisted of four I-beams. The frame was placed perpendicular to the panel being tested to ensure that the ice specimen would impact normal to the panel and limit sliding along the panel.
The ice spheres used as impact objects in these tests were grown as two independent halves and then frozen together with a metal rod in between. At one end of each rod there was an eye hook and at the other end, there was a flat plate with a bolt pattern. The ice was frozen around the metal bar such that the eye hook protruded from the bottom and the flat plate was flush with the top. The eye hook was used as means of raising the ice sphere prior to release while the flat plate was used to bolt the pendulum to the sphere. Figures 4 and 5 illustrate the set up used for the pendulum tests.
Figure 4. Pendulum test lifeboat wedge supports
Figure 5. Pendulum test set up
Instrumentation
The dynamometer inside each panel was made up of six U2B Force Transducers. These load cells were connected with flex links, minimizing cross-talk between the load cells. There were three load cells with 10 kN capacity, and three with 50 kN capacity. The three 50 kN load cells measured force into the panel, or across the beam of the lifeboat. Two of the 10 kN load cells measured force along the length of the lifeboat and the other measured the vertical force. A right hand coordinate system was used, in which the x direction runs positively along the length of the ship towards the bow, the y direction runs positively across the beam from starboard to port and the z direction is in the vertical direction with positive direction upwards.
Inside the lifeboat there was an inertial sensing system (MotionPakTM) that measured the accelerations in the x, y and z directions of the lifeboat. It was mounted internally on the centerline towards the bow of the boat. This device measured global accelerations due to ice impact. Mounted to each ice specimen were two surface-mount micro-machined accelerometers. These accelerometers measured the acceleration of the pendulum in the x and y directions from release to impact. The accelerometers were in an aluminum box to prevent damage during impact.
There were two LVDT’s (GCD-SE Series Precision Gage) used during testing to measure the movement of the boat during an impact. A 6.4 mm (0.25”) LVDT was placed inside the lifeboat against the sea chest that held the impact panel in order to record how much the panel moved during impact. A 12.7 mm (0.5”) LVDT was placed outside the lifeboat against the opposite panel, to record global movement of the lifeboat during impact.
A high-speed camera was used to record each impact in order to determine the contact area and impact speed. The camera was located at a position perpendicular to the impact. The camera used was a Photron Ultima APX-RS which was equipped with an automatic trigger.
Pendulum Test Findings
The coefficient of restitution was determined by assessing the ratio of ice velocity after the pendulum swing impact to the velocity prior to impact. The lifeboat was impacted at four different drop angles: 15, 20, 25 and 30 degrees corresponding to measured impact speeds that ranged from 0.5 to 3.4 m/s.
The coefficient of restitution was found as a function of increasing impact energy. The results showed that at low impact energy values, the coefficient of restitution was highest and as the impact energy
increased the coefficient of restitution leveled off to a value of approximately 0.2.
Field Trials
Full scale trials were completed in which a lifeboat was driven into pack ice and level first year ice. The trials took place in Triton, Newfoundland, during April, 2009. The purpose of these tests was to measure ice impact force magnitudes as well as to test lifeboat performance in various ice conditions.
Lifeboat Description
The lifeboat used in field trials was the same as that used in pendulum testing. The lifeboat had an overall length of 5.28 m, a breadth of 2.20 m and a moulded depth of 1.10 m. The lifeboat was fabricated of single skinned fiberglass with an internal layer of polyurethane foam. The hull and canopy were created as individual sections each having different thicknesses. The lifeboat had a displacement during trials of 3800 kg corresponding to a full complement. It was equipped with a 29 Hp engine and a three bladed propeller inside a steerable nozzle.
Instrumentation
During field trials the lifeboat was equipped with all of the same data acquisition system (DAS) components that were used in the pendulum tests plus additional components. The additional DAS components included external video cameras, a DGPS and a remote control system. A total of six external cameras were secured to the lifeboat to get a complete view of the lifeboat surroundings, the local ice conditions and the ice impacts. There were also two internal cameras positioned in the sea chest for viewing the ice thickness. A digital global positioning system (DGPS) was used to take measurements of the lifeboat position. There was an LVDT mounted behind each of the impact panels to record panel displacement caused by ice impact (at a rate of 8000 Hz). During field testing the lifeboat was outfitted such that it could be driven externally using remote control. This remote system was used for a portion of the tests. The remote control system consisted of a DC powered servo fixed to the throttle and a linear actuator attached to the rudder. These pieces of equipment were wirelessly connected to an external control station. The external control station contained one screen that monitored shaft rotation and throttle percentage, a second screen showed the lifeboat camera views from the external cameras, a steering wheel to direct the lifeboat, and a set of pedals to control the speed. For these trials, the external control station was set up in the cabin of a fishing trawler that served as the standby vessel.
Field Trial Findings
There were approximately 100 ice impacts analyzed from the data collected during field trials. These impacts were separated into two categories: level and pack ice. Pack ice refers to individual pieces of ice as well as broken level ice. The data indicated a rise in impact force with rising impact speed.
The peak pack ice impact registered was approximately 18.2 kN while the peak level ice impact was around 10.0 kN. The highest ice impact speed registered during testing was 2.7 m/s. This speed was tested in both the level and pack ice conditions. The peak pack ice impact force occurred at an impact speed of approximately 2.6 m/s while the peak level ice impact occurred at a speed of around 1.3 m/s.
Ice temperature, salinity and conductance were measured periodically throughout the test period. These results were used to estimate the ice compressive and flexural strengths. The compressive strength of ice was found to range from 1.36 MPa to 1.44 MPa, while the flexural
strength ranged from 0.27 MPa to 0.39 MPa. The ice thickness was measured directly from small pieces of pack ice and indirectly from observations of video recordings taken from inside the impact panel. The ice thickness during field testing ranged from 5 cm to 20 cm. The ice mass was approximated based on ice dimensions estimated from video observations and an ice density assumed to be 900 kg/m3. The pack ice mass ranged from approximately 50 kg to 4600 kg.
MATH MODEL
The purpose of developing a model of a conventional lifeboat impacting ice was to predict operational limitations.
Description of Model
The semi-empirical model developed to represent a small craft, in this case a conventional lifeboat, impacting ice was based on Popov (1967). The original Popov model was developed for large ships and calculates the normal force resulting from a rigid vessel impacting ice. This is done by first reducing the masses and velocities to the line of impact and then using a conservation of energy approach to solve the problem of a collision between two bodies.
A weakness of the Popov model is that the assumption of hull rigidity does not hold for the flexible hull of a lifeboat. Modifications were made to the original Popov model to incorporate hull flexibility. The modified model is termed here as the extended Popov model.
The extended Popov model includes a panel deformation term. A modeling idealization is made that relates the ice crushing force to the compressive strength and nominal contact area. There were two separate cases considered: level ice and pack ice. The pack ice condition assumes that ice failure occurs in compression. The level ice case considers both compressive and flexural failure. The variables involved in the collision force prediction equations include:
H = Ice thickness (m)
σc = Ice compressive strength (MPa)
σf = Ice flexural strength (MPa)
R = Lifeboat bow radius (m)
vn = Normal lifeboat velocity at collision point (m/s)
K = Panel stiffness
me = Effective mass of lifeboat at collision point (kg)
mice = Mass of ice (kg)
e = Coefficient of restitution between lifeboat and ice
Other variables include the craft particulars, bow angles and added mass terms. Each variable involved in the model can be changed to represent different ice conditions, impact location along the hull or craft type. This leads to a general model capable of representing a range of ice interaction situations.
The ice force prediction model makes several assumptions. The first assumption is that the lifeboat contacts level ice, penetrates some distance and then comes to a complete stop. This process was evident during lifeboat field trials.
The nominal contact area between the lifeboat and the ice edge was represented as the contact area between a vertical cylinder and an ice edge. The bow area of the conventional lifeboat, in the ice belt region, was approximated, in terms of geometry, as a vertical cylinder. Contact area as a function of ice indentation was represented as by Daley (1999).
An assumption that hull deflection is linearly proportional to impact force was used as a means to incorporate panel deformation into the
model. The panel stiffness was found from analyzing the linear portions of force versus displacement curves that resulted from the hydraulic ram tests.
Model Comparison
The model was used to predict ice impact forces typical of those observed during field testing and then compared to measured loads. The mode value of each ice parameter observed during trials was input into the prediction model. Predictions were made for a range of impact speeds relating to the operational speed range of the lifeboat. The model predictions and measured impact forces are shown in Figures 6 and 7 below. The value of each ice parameter used in the prediction model is shown in the legends.
Pack Ice Predictions and Measured Impacts
0 2000 4000 6000 8000 10000 12000 14000 16000 18000 20000 0 0.5 1 1.5 2 2.5 3 Impact Speed (m/s) Forc e ( N )
Pack Ice - Measured Pack Ice - Predicted
Compressive Strength 1.44 Mpa Ice Thickness 0.14 m Ice Mass 3800 kg
Figure 6. Pack Ice Comparison
Level Ice Predictions and Measured Impacts
0 2000 4000 6000 8000 10000 0 0.5 1 1.5 2 2.5 3 Impact Speed (m/s) Fo rc e ( N )
Level Ice - Measured Level Ice - Predictedt
Compressive Strength 1.44 Mpa Flexural Strength 391 kPa Ice Thickness 0.14 m
Figure 7. Level Ice Comparison
The field trial measurements were diverse. This is in large part due to the fact that each independent measurement corresponds to specific ice and vessel parameters.
The predicted pack and level ice impact forces compare well with the measured data. The prediction lines lay within the pack and level ice measurements. This was expected since the mode values of the ice parameters were used in the predictions.
To further compare the model predictions to the field trials measurements the bounds of the ice parameters were considered. The model was used to predict impact forces with ice representative of the upper bounds of strength, thickness and mass as well as the lower bounds. The model predictions and field measurements for the pack and level ice cases are shown in Figures 8 and 9 below.
Pack Ice Predictions and Measured Impacts
0 5000 10000 15000 20000 25000 30000 0 0.5 1 1.5 2 2.5 Impact Speed (m/s) Forc e ( N ) Pack Ice_Measured Pack Ice Predictions Low Pack Ice Predictions High
Low Bound Values Compressive Strength 1.36 Mpa Ice Thickness 0.05 m Ice Mass 50 kg High Bound Values Compressive Strength 1.44 Mpa Ice Thickness 0.20 m Ice Mass 4600 kg
Figure 8. Pack Ice Boundary Consideration
Level Ice Predictions and Measured Impacts
0 2000 4000 6000 8000 10000 0 0.5 1 1.5 2 2.5 3 Impact Speed (m/s) Fo rc e ( N ) Level Ice_Measured
Level Ice Predictions Low Level Ice Predictions High
Low Bound Values Compressive Strength 1.36 Mpa Flexural Strength 0.27 MPa Ice Thickness 0.05 m High Bound Values Compressive Strength 1.44 Mpa Flexural Strength 0.39 MPa Ice Thickness 0.20 m
Figure 9. Level Ice Boundary Consideration
The majority of the measured data points lie within the bounds of the prediction model.
OBSERVATIONS
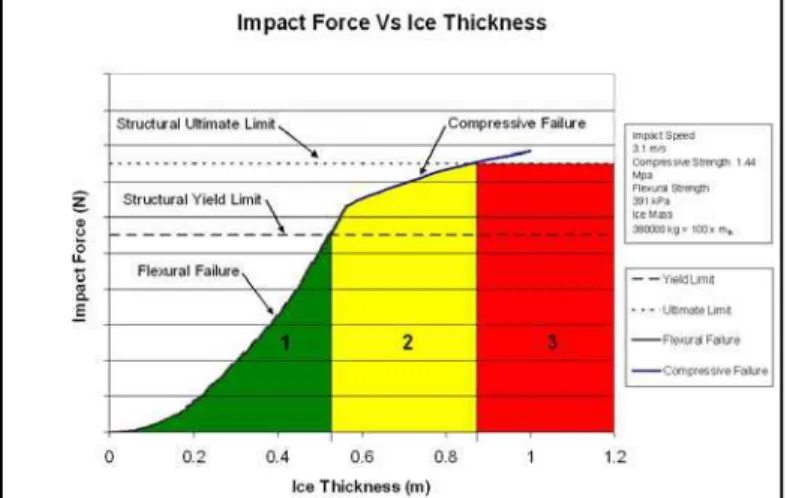
Operational maps were developed by finding the intersection of the prediction curves with the yield and ultimate structural limits defined by hydraulic ram testing. For illustrative purposes an example is considered in which the conventional lifeboat impacts ice with strength typical of that observed during field testing. Model predictions were made for a range of ice thicknesses from 0 to 1.0 m. The impact speed considered in this example is 3.1 m/s. The operational map for this situation is shown in Figure 10.
The area is divided into three sections indicated as 1, 2 and 3. Section 1 represents ice collisions that would result in an impact force below the force required to cause structural yielding. Section 2 is representative of ice collisions that would result in an impact load above the structural yield force but below the force required to cause ultimate structural failure. The third section represents ice collisions that would result in an impact force above the force required to cause ultimate structural failure.
Operational guidance plots similar to Figure 10 could be made for a variety of different interaction situations by adjusting the parameters in the prediction model accordingly.
Figure 10. Operational Guidance
CONCLUSIONS AND RECOMMENDATIONS
A simple model has been developed to predict the impact forces arising from a conventional lifeboat colliding with ice. This model contains empirical components such as the coefficient of restitution and panel stiffness defined from laboratory experimentation. The model considers two ice failure modes: compression and flexure.
A key element of this model is that it considers hull deformation due to ice impact. The consideration of hull flexibility is appropriate for lifeboats as they have non-rigid hulls.
The model contains variables relating to hull geometry, added mass, ice strength and ice size. Each variable can be adjusted to represent a variety of different impact situations. The model has the generality required of a predictive model.
The model was used to predict ice impact loads typical of field trial conditions. The model predictions compared well to the ice loads measured during field trials.
The research presented in this paper can provide insight into the structural design of an ice-capable lifeboat. It could also be incorporated into performance based standards that govern lifeboat operation in ice environments. The approach taken for the operational guidance plot can be extended to help define safe and unsafe conditions for any small craft operating in ice. We have already begun to incorporate this information in training simulators to teach operators safe practices in ice.
ACKNOWLEDGEMENTS
The financial support of the Institute for Ocean Technology (IOT), Memorial University of Newfoundland (MUN) and Natural Resources Canada’s Program of Energy Research and Development (PERD) is greatly appreciated.
REFERENCES
American Society for Testing and Materials (ASTM), “Standard Test Method for Tension-Tension Fatigue of Polymer Matrix Composite Materials”, D3479 / D 3479M, 1996.
Daley, C., “Energy Based Ice Collision Forces”, Proceedings of the 15th International Conference on Port and Ocean Engineering under Arctic Conditions (POAC), Finland, 1999.
Popov, Y. N., Faddeyev, O. V., Kheysin, D. Y., Yakovlev, A. A., “Strength of Sailing Ships in Ice”, Sudostroyeniye Publishing House, Leningrad, 1967.
Sanderson, T.J., “Ice Mechanics”, The Dorset Press, Great Britain, 1988.
International Organization for Standardization (ISO), “Plastics – Determination of puncture impact behavior of rigid plastics”, 6603-2, 2000.