First International Conference on Bio-based Building Materials June 22nd - 24th 2015
Clermont-Ferrand, France
PROPERTIES OF BIO-BASED INSULATION MATERIALS AND THEIR
POTENTIAL IMPACT ON INDOOR AIR QUALITY
D.Maskell1*, C. F. da Silva1, K. Mower2, C. Rana2, A. Dengel2, R. J. Ball1, M. P. Ansell1, P. J. Walker1, A Shea1
1 BRE CICM, University of Bath, Bath, UK 2 BRE, Watford, UK
*Corresponding author; e-mail: D.Maskell@bath.ac.uk
Abstract
Significantly decreasing energy consumption in buildings requires more air-tight construction combined with much higher insulation levels. A potential unintended consequence of this approach has been deterioration in the indoor air quality, resulting from significantly reduced ventilation rates and the accumulation of airborne pollutants, and this has proven to be a bottleneck to successful implementation of legislation. The use of natural bio-based insulation materials has increased in recent years, largely driven by concerns over the embodied energy and whole-life environmental impact of insulation materials. This has led to their increased use, typically within breathable wall constructions. A breathable wall construction allows the insulation material to directly contribute to the indoor air quality. Volatile Organic Compounds (VOCs) having boiling points within the range 60-280 °C contribute to the indoor air contamination in buildings, and at certain concentrations can contribute to building-related illnesses. This paper presents some findings from the early stages of a phased experimental study to explore use of bio-based insulation materials, including hemp-lime and sheep’s wool, to reduce VOCs from the room atmosphere. There are many different volatile organic compounds and this study will consider the Total Volatile Organic Compound (TVOC) emissions expressed as toluene, as well as the formaldehyde emissions separately. Insulation specimens with nominal dimensions 200 x 60 x 50 mm were prepared and placed in horizontally mounted cylindrical chambers. Air maintained at 23 °C (±2 °C) and 50 % (±5 %) RH was fed in coaxially to one end of the cylinder. The exhaust air was sampled for VOCs and for formaldehyde following 3 and 28 day of exposure. The results of this paper will help inform the design of holistic indoor environments that consider more than just the hygrothermal properties of insulation materials.
Keywords:
Volatile Organic Compounds, PassivHaus, Formaldehyde, Health
1 INTRODUCTION
By 2020, a European Union (EU) directive (2010/31/EU) will require all new buildings within the EU to be nearly zero-carbon. A nearly zero-carbon building is defined as one that has very high energy performance, with the energy requirement covered by renewable sources. Space heating accounts for 55% - 67% of a European domestic houses’ fuel consumption (Economidou et al., 2011). The current focus for building performance is to reduce the loss of heat energy through increased levels of insulation and reduced infiltration through air-tight construction. A potential unintended consequence of the air-tight approach has been deterioration in the indoor air quality, resulting from significantly reduced ventilation rates and the accumulation of airborne pollutants (Crump et al., 2009).
Indoor air quality (IAQ) is strongly influenced by the emission of Volatile Organic Compounds (VOCs) including odorants which have a direct influence on people’s well-being and health. Uncommon or intense odours may have a negative psychological influence on occupants. The suppression of VOCs may be achieved by ventilation, the specification of low emission materials or the use of materials with air purification properties, all of which improve air quality indoors. Indoor air pollutants include very-VOCs (such as formaldehyde), very-VOCs (such as benzene, aldehydes and ketones, fragrance compounds), semi-VOCs (such as PAHs, flame retardants), inorganic pollutants (such as particles and fibres), allergens, radioactive gases such as radon, and pollutants of microbiological origin such as moulds or fungi (including spores and endotoxins). Pollutants can originate from outdoor sources, such as traffic and other forms of combustion (CO, NOx, SOx), or from indoor
sources, such as people, their activities, tobacco smoke, building and furnishing materials, electronic equipment, cleaning products or heating, ventilation and air-conditioning (HVAC) systems. There is growing literature on the effects of exposure to the various compounds with the World Health Organization (WHO, 2010) commenting that while combined exposure is inevitable, there is limited data on the quantified effects. However, for ease of analytical measurements and comparing levels the amounts of VOCs are summed and expressed as Total Volatile Organic Compounds (TVOC). Mølhave et al., (1997) provided an approximate guideline on the potential impacts on health associated with levels of TVOC as given in Table 1.
Table 1: Impact of TVOC (Mølhave et al., 1997)
Values of TVOC Health impact
< 200 µg m-3 No irritation or discomfort expected
200 – 3,000 µg m-3 Irritation and discomfort may be possible
3,000 – 25,000 µg
m-3 Discomfort expected and headache possible
> 25,000 µg m-3 Toxic range where other neurotoxic effects may occur
The associated symptoms of the building related illness that can be caused by the deteoration of IAQ can include:
• headaches;
• eye, nose or throat irritations; • dry coughs;
• allergy reactions; • dry and itching skin; • nonspecific hypersensitivity; • insomnia;
• dizziness and nausea;
• difficulty in concentrating and tiredness. To address these issues there are two European directives that consider VOCs:
• The Solvent Emission Directive (SED) 1999/13/EC. This directive has been fully implemented since 2007.
• The Products Directive (PD or DECO) 2004/42/EC. This introduces VOC limits for 2010 that relate to specific products and materials (such as paints) containing VOCs.
The adoption of natural insulation materials, as studied here, is driven by reducing the embodied energy and carbon impact of construction. As buildings use less operational energy to comply with the EU directives, the proportion that is attributed to the embodied impact becomes increasingly important, and could account for up to 95% of the full life-cycle carbon footprint (Sturgis and Roberts, 2010).
The use of natural materials for building construction has become increasingly prevalent in recent years in response to the thermal performance requirement and consideration of the embodied impact. However, the bio-based nature of the building materials means that organic compounds are present. There is significant variation in types of bio-based insulation material, including differing processing techniques, use of
binding agents and various solvents that are known to be the source of VOCs. The material emissions are related to the nature and chemical composition of the material, production and climate conditions, (Baumann et al., 2000, Koivula, 2005, Yu & Crump, 1998, Haghighat & Bellis, 1998 and Wolkoff, 1998). Wolkoff (1999) divided VOCs emissions in two types; primary and secondary emissions. Primary emissions are classified as non-bound VOCs that can originate from solvent additives, unreacted raw materials or by-products. Whereas secondary emissions are classified as chemically or physically bound VOCs emitted or formed as a consequence of oxidation, degradation, sorption processes and reactions between primary VOCs and ozone. Bio-based insulation materials are often used as part of breathable (water vapour permeable) wall construction. So called ‘breathing wall construction’ allows the diffusion of water vapour, but may also allow for the transportation of VOCs generated by the internal makeup of the wall construction. The emission rate of VOCs has been shown to be greatest during the initial construction period (Wolkoff, 1999). If onsite construction is used where the insulation is installed in-situ and remains exposed to the internal environment then this will cause an increase of VOCs within the internal environment. Therefore, it is important to understand the VOC emissions of natural insulation materials. This paper will present VOC emission results from a range of different bio-based insulation materials.
2 MATERIALS AND METHODS 2.1 Materials
Seven insulation materials were chosen for this study and are presented in Figure 1. All materials are commercially available, with five manufactured in a production line and two hemp lime mixes with differing densities that would typically be cast in-situ. The insulation material can be divided into two categories: flexible and rigid. The majority of the specimens are flexible, while the hemp lime mixes and the wood fibre board insulation materials have been classified as rigid. The cellulose flakes are particulate in nature and would typically by applied using a mechanical blower to distribute the material. For this study the material was prepared by hand to the specified density.
Factory manufactured insulation materials were supplied directly from the production line. The hemp lime mixes were prepared under laboratory conditions following mixing guidelines. The insulation materials were manufactured and prepared to a standard thickness of 50 mm.
Figure 1: Insulation specimens
As constituent materials and manufacturing processes can vary significantly, the results cannot
be considered more broadly representative of all similar products. The influence of material and manufacturing variations on performance are outside the scope of this paper.
2.2 Methods
Material characterisation
The physical, chemical and thermal properties of the insulation materials were investigated together with VOC emission tests. All measurements were carried out in triplicate. The density and thermal conductivity of the seven insulation materials was measured for reference. Temperature dependent thermal conductivity of the insulation materials was measured using a heat flow meter apparatus following ISO 8301:1991. Fourier Transform Infrared spectroscopy (FT-IR) was used for chemical characterisation of the insulation materials. An FT-IR spectrometer Perkin-Elmer Frontier equipped with a MIRacle™ Single Reflection ATR (Attenuated Total Reflectance) with a diamond crystal from PIKE technologies was used. The IR spectroscopy was carried out over a wavenumber range between 4000 and 600 cm-1, with 2 cm-1 of resolution at a rate of 0.5 cm.s-1 scan speed.
IAQ - TVOCs and formaldehyde emissions test
Standard methods for the determination of the emission of VOCs from building products exist (ISO 16000 series). A Field Laboratory Emissions Cell (FLEC), as per ISO 16000-10:2006, is typically used for the emission testing of materials. This technique introduces air at the circumference of a circular plate, which forms a seal with the specimen. This air is then forced in close contact with the surface of the specimen, and is extracted from the centre of the circle. This technique has two main disadvantages specific to insulation materials. Firstly, not all materials tested are amenable to be studied by the FLEC as they do not make a good seal, and are difficult to cut into thin disks. Secondly, the FLEC is purely a surface technique; any emission/adsorption results may be difficult to relate to any studies when the experiments are scaled up. An alternative method was developed at the BRE using ‘two-litre’ chambers. The chamber method has been used in previous studies for emissions testing at BRE (Crump et al., 1996, Brown et al., 1993 and Yu & Crump, 1998). Specimens with nominal dimensions 200 x 60 x 50 mm were prepared. These were placed in horizontally mounted cylindrical chambers, with nominal internal dimensions of 300 mm long and 90 mm diameter, giving a nominal volume of approximately 1.9 litres, commonly referred to as ‘Two-litre chambers’ (Figure 2).
Figure 2: Two-litre chamber schematic
Air maintained at 23 °C (± 2 °C) and 50 % (± 5 %) RH is fed in one end of the cylinder and through a baffle to induce turbulence. The air stream is then allowed to flow over the specimen with the exhaust vented through a stainless steel screw cap (with a non-emitting rubber sealing washer) at the other end of the cylinder. The exhaust air was sampled for
VOCs and formaldehyde after 3 and 28 day of exposure.
The VOCs were sampled using Tenax TA 60-80 mesh sorbent tubes, and analysed according to ISO 16000-6:2011. The concentrations of VOCs and TVOC were analysed by thermal desorption and Gas Chromatography (ATD/GC) using a Flame Ionisation Detector (FID) for quantification of compounds. The principal compounds were identified by Mass Spectrometry (MS) and quantified. Formaldehyde was sampled using 2,4-dinitrophenylhydrazine cartridges, which were then solvent extracted and analysed by HPLC according to ISO 16000-3:2011.
The emissions testing experiments have been carried out with the sides and bottom of the specimen enclosed by a metal ‘boat’, so that only one long surface of the material was considered. This provided specific emission rates of VOCs and formaldehyde as follows:
• By surface area exposed (expressed as µg m-2 h);
• Through the surface exposed, by weight of test specimen (expressed as µg kg-1 h); • Through the surface exposed, by volume
of test specimen (expressed as µg m-3 h).
The actual diffusion rate of air through the surface is expected to be proportional to the packing density of the fibres. Any attempts to calculate or measure the concentration of any compound on the surface could be flawed, as the effective surface area will be proportional to the two-dimensional surface area and the porosity of the material. There will be a concentration gradient from the top-most part of the specimen to the depth where diffusion ceases. However measurement of the diffusion depth or the porosity of the material is outside the scope of this research.
3 RESULTS AND DISCUSSION 3.1 Characterisation of the material
The density and temperature dependent thermal conductivity measurements of the seven bio-based insulation materials are presented in Table 2. The test equipment used was a LaserComp Fox 600 heat flow meter. The unit permits testing of samples of varying size up to a maximum of 600 x 600 x 200 mm. Each dry specimen was placed horizontally in the apparatus, with upwards heat flow and a temperature difference of 20K. The edges of the specimen are insulated from the room ambient temperature and the uncertainty in the measurements of thermal conductivity is estimated to be ±3%. The FT-IR spectra of the six insulation materials are presented in Figure 3 allowing for chemical characterisation of the material. The wool is essentially composed of a fibrous protein called keratin that is characterised by a large chain of amino acids including, cysteine, glycine, serine and tyrosine (Darcy, 1990, Vasconcelos, 2008 and Wojciechowska, 1999).
Table 2: Density and thermal conductivity results.
Material Density Temperature dependent thermal conductivity [kg m-3] [°C ] [W m-1K-1] Cellulose flakes 45.0 10.01 0.0498 30.01 0.0532 Wool 22.6 10.01 0.0362 20.02 0.0382 30.02 0.0398 Hemp fibre 43.7 10.01 0.0392 20.02 0.0409 30.02 0.0428 Wood fibre 68.8 10.01 0.0376 20.02 0.0390 30.02 0.0405 Hemp lime 330kg/m³ mix 360.5 10.01 0.0784 20.02 0.0804 30.02 0.0824 Hemp lime 275kg/m³ mix 305.8 10.01 0.0685 20.02 0.0610 30.02 0.0720 Wood fibre board 205.0 10.01 0.0426 20.02 0.0439 30.02 0.0454
The spectrum recorded from wool showed the typical bands from the amino acids that compose keratin. Bands at 3060 and 1513 cm-1 are related to the amide group COHN and NH respectively with bands at 2940 and 1441 cm-1 representing the
presence of CH2 bonds and a band at 2880 cm-1
due to the presence of CH bonds (Wojciechowska, 1999).
The presence of a C=O bond is characterised by the band at 1710 cm-1 (Vasconcelos, 2008). Hemp
fibre, wood fibre and rigid wood showed expected bands indicating the presence of cellulose, hemicellulose and lignin (Dai, 2010), summarised in Table 3. The two mixes of hemp lime also showed bands from cellulose, hemicellulose and lignin, although they are not as notable as with the wood based samples. This could be related due to the presence of calcite within the lime composite as detected at 1394, 872 and 712 cm-1, (NIST, 2009).Water molecules adsorbed on the fibres are shown as bands at 3280 and 1634 cm-1, (NIST, 2009). The insulation materials that showed, through FT-IR, higher amount of adsorbed water molecules were wool and hemp fibre, indicating the potential of both to adsorb water compared with the other materials.
3.2 IAQ - TVOCs and formaldehyde emissions The specific emission rates of TVOCs and formaldehyde from the seven bio-based insulation materials are presented in Tables 4 and 5 respectively. While the impact of these emissions on the air quality of the indoor environment will vary depending on volume of the space, exposed surface area, ventilation and many other factors, these results can be considered against the “European Standard Room” (CEN/TS 16516). This standard room has a volume of 30 m3 with nominal
dimensions of 4 m by 3 m by 2.5 m high and an air change rate of 0.5 air changes per hour (ach). The room gives a wall surface area of 31.4 m2, not including the door and window, which allows for an approximation of the concentration of VOCs within the room. With no ventilation present the concentration of VOCs within the indoor environment would increase per hour. At 0.5 ach this would reduce to two thirds of the product of surface area and emission, as a total volume of 45 m3 of air would dilute the emissions within the hour
of time.
Table 3: Typical absorption wavenumbers for cellulose based materials.
Peak wavenumber (cm-1) Bonds Sources
3340-3330 OH stretching Cellulose, hemicellulose 2882 C-H symmetrical stretching Cellulose, hemicellulose
1423 CH2 symmetric bending Cellulose
1362 In the plane CH bending Cellulose, hemicellulose
1310 CH2 rocking vibration Cellulose
1243 C=O Lignin
1096 Skeletal vibrations C-O
1043-1016 C-C, C-OH, C-H ring and side group vibrations Cellulose, hemicellulose
1016 C-O
890 C-O-C, C-C-O and C-CH deformation and stretching Cellulose
Figure 3: FT-IR spectra of bio-based insulation materials
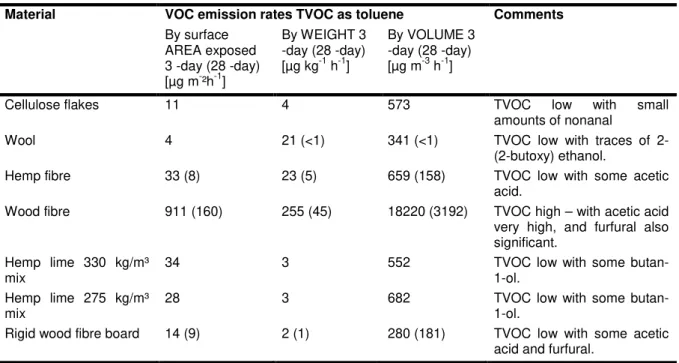
Table 4: VOC emission rates. TVOC is quantified as toluene
Material VOC emission rates TVOC as toluene Comments
By surface AREA exposed 3 -day (28 -day) [µg m-²h-1] By WEIGHT 3 -day (28 -day) [µg kg-1 h-1] By VOLUME 3 -day (28 -day) [µg m-3 h-1]
Cellulose flakes 11 4 573 TVOC low with small amounts of nonanal
Wool 4 21 (<1) 341 (<1) TVOC low with traces of 2-(2-butoxy) ethanol.
Hemp fibre 33 (8) 23 (5) 659 (158) TVOC low with some acetic acid.
Wood fibre 911 (160) 255 (45) 18220 (3192) TVOC high – with acetic acid very high, and furfural also significant.
Hemp lime 330 kg/m³
mix 34 3 552 TVOC low with some butan-1-ol. Hemp lime 275 kg/m³
mix 28 3 682 TVOC low with some butan-1-ol. Rigid wood fibre board 14 (9) 2 (1) 280 (181) TVOC low with some acetic
Table 5: Formaldehyde emission rates
Material Formaldehyde emission rates Comments
By surface AREA exposed 3 -day (28 --day) [µg m-²h-1] By WEIGHT 3 -day (28 -day) [µg kg-1 h-1] By VOLUME 3 -day (28 -day) [µg m-3 h-1]
Cellulose flakes 17 (14) 5 (5) 861 (769) Formaldehyde emissions reasonably low
Wool 1 (1) 6 (7) 100 (107) Formaldehyde emissions low Hemp fibre 1 (3) 4 (2) 115 (54) Formaldehyde emissions low Wood fibre 7 (6) 2 (2) 134 (121) Formaldehyde emissions
reasonably low Hemp lime 330 kg/m³
mix 4 0.5 77 Formaldehyde emissions low.
Hemp lime 275 kg/m³
mix 4 0.3 80 Formaldehyde emissions low
Rigid wood fibre board 19 (12) 2 (1) 374 (242) Formaldehyde emissions reasonably low
The values for the area specific emission rates of TVOC are generally low across six of the seven types of insulation materials tested, with no values above 34 µg m-2 h-1 recorded at 3 days. These
levels generally decreased or remained at a similar level at 28 days. Individual VOCs identified were comprised mainly of unsaturated hydrocarbons, aldehydes, acetic acid and alcohols. In the case of the wood fibre material the emission rate was much higher than other materials at 911 µg m-2 h-1 at 3 days, reducing to 160 µg m-2 h-1 at 28 days. High
concentrations of acetic acid and furfural were detected on the wood fibre sample. The peaks 2916 and 2849 cm-1 shown in the spectrum of wood fibre are characteristic of the aldehyde group from furfural, (Wang, 2012 and NIST, 2009), indicating good agreement between results from chemical characterisation and emission tests. Both Hemp lime mixes showed emissions of alcohol butan-1-ol which can be related to the presence of calcite in the lime itself.
The presence of formaldehyde emissions in wood based materials without adhesive resins is likely to be associated with mechanisms of oxidative, thermal, enzymatic and microbial degradation of the wood based material (Baumann, 2000). In this study, formaldehyde area specific emission rates are shown to be generally low across the seven types of insulation materials tested, ranging from 1-19 µg m-2 h-1 at 3 days, Table 5. The material with the lowest formaldehyde emission was the wool - emitting 1 µg m-2 h-1 at 28 days and containing no wood cellulosic material. Rigid wood fibre board emitted 19 µg m-2 h at the same time, which is expected considering the density of the material. Generally, the wood-based materials showed high emission rates of VOCs and formaldehyde, and the type of chemicals emitted are comparable with those found in the literature, (Baumann et al., 2000 and Koivula et al., 2005).
The highest emission rates determined for seven of the materials here would give rise to concentrations in air of up to 607 µg m-3 TVOC and 13 µg m-3 formaldehyde in the “European Standard Room”, where all four walls are covered entirely by the
exposed material. In the case of the wood fibre the TVOC levels would be of slight concern exceeding the current IAQ guidelines, which are 200-500 µg m
-3 for TVOC and 100 µg m-3 for formaldehyde, (WHO,
2000). The levels of the other insulation materials are well below the recommended guidelines, exhibiting a maximum TVOC emission of 23 µg m-3. Of the currently available materials used for the manufacture of insulation, the VOC reactivity of wool has been the most researched, primarily due to the amine groups and their reactivity with organic compounds. Haung et al. (2007) demonstrated the potential for wool to purify the air through the removal of formaldehyde. The reaction mechanisms based on the amino groups of lysine and arginine, and the amido groups of glutamine and asparagine with the formaldehyde are suggested to be the cause of the purification properties (Wortmann et
al., 2005). There is therefore significant potential for
these bio-based insulation materials to adsorb various VOCs in order to ensure healthy levels of indoor air quality.
4 SUMMARY AND CONCLUSIONS
Bio-based insulation materials can offer comparable thermal conductivity with a lower environmental impact compared to conventional insulation materials. However, due their inherent carbon-based chemical structure, there is the increased potential for VOC emissions. It is the characterisation of these materials and their related emissions that will allow for further development of bio-based insulation materials.
Seven bio-based insulation materials were characterised chemically and their VOCs and formaldehyde emissions were analysed and discussed. Specific emission rates by surface area, weight and volume of VOCs and formaldehyde were measured over 3 and 28 days. These results indicate that the majority of the bio-based insulation materials are classed as low emitting in terms of TVOC and formaldehyde. Under standardised room conditions, the emissions are not expected to cause any impacts on health and wellbeing based on
current guidelines. A single wood-fibre based insulation did show a significantly higher emission of VOCs that would potentially raise concerns under certain circumstances.
The results from the FT-IR analysis confirm that the expected chemical make-ups are in agreement with the emissions detected. This indicates that it is the fundamental chemical makeup, that could include either the biological material itself or as a result of the manufacturing process, that causes the VOC emissions.
This paper has presented data for the initial emissions of the bio-based insulation materials. It is the potential of these materials to adsorb or react with VOCs and formaldehyde, effectively removing them from the indoor environment that promises the greatest benefit of the bio-based insulation materials, regardless of their initial emissions. The effectiveness of the transportation of the VOCs through a breathable layer is the subject of further work that will impact both the emissions and adsorption of the insulation materials.
5 ACKNOWLEDGMENTS
This project has received funding from the European Union’s Seventh Framework Programme for research, technological development and demonstration under grant agreement no 609234. This authors would like to thank Black Mountain Insulation, UK, Claytec, Germany and BCB, France for their support in providing of materials in kind. 6 REFERENCES
2010/31/EU, European Parliament, Council Directive 2010/31/EU of the European Parliament and of the Council of 19 May 2010 on the energy performance of buildings, 2010
Baumann, M. G. D., Lorenz, L. F., Batterman, S. A., Zhang, G. Z. (2000). Aldehyde emissions from particleboard and medium density fiberboard products. Forest Products Journal, 50(9), 75-82. Brown, V., Crump, D., Yu, C. (1993). The use of Chamber Methods to measure the emission of Volatile Organic Compounds from building a consumer products. Proceedings of International Conference on VOCs, London 27-8 October 1993, 283-293.
CEN/TS 16516 Construction products. Assessment of release of dangerous substances. Determination of emissions into indoor air.
Commission of the European Communities (CEC), 1992. Guideline for Ventilation Requirements in Buildings. Indoor Air Quality and its Impact on Man. Commission of the European Communities, Luxembourg.
Crump, D. R., Yu, C. W. F., Squire, R., and Atkinson M. (1996). Small Chamber Methods for Characterising Formaldehyde Emission from Particleboard. Characterising Sources of Indoor Air
Pollution and Related Sink Effects, ASTM STP 1287, American Society for Testing and Materials,
211-224.
Crump, D., Dengel, A., Swainson, M. (2009). Indoor Air Quality in Highly Energy Efficient Homes. NHBC
Foundation Research Review NF18. IHS BRE Press. ISBN 978 1 84806 104 0.
Dai, D., Fan, M. (2010). Characteristic and Performance of Elementary Hemp Fibre. Materials
Sciences and Applications, 1, 336-342.
Darcy, J. B. (1990). Sheep management and wool technology. New South Wales University Press
LTD. ISBN 0 86840 036
Economidou, M., Atanasiu, B., Despret, C., Maio, J., Nolte, I., & Rapf, O. (2011). Europe's Buildings under the Microscope. A Country-by-Country Review of the Energy Performance of Buildings.
Buildings Performance Institute Europe (BPIE).
Haghighay, F., Bellis, L. (1998). Materials emission rates: Literature Review, and the impact of indoor
air temperature and relative humidity. Building and Environment, 33(5), 261-277.
Huang, X., Wang, Y. J., & Di, Y. H. (2007). Experimental study of wool fiber on purification of indoor air. Textile Research Journal, 77(12), 946-950.
ISO 8301:1991. Thermal insulation -- Determination of steady-state thermal resistance and related properties - Heat flow meter apparatus. Internal Standardization Organization (ISO).
ISO 16000. Indoor Air. Internal Standardization Organization (ISO).
ISO 16000-3:2011. Indoor air - Part 3: Determination of formaldehyde and other carbonyl compounds in indoor air and test chamber air - Active sampling method. Internal Standardization Organization (ISO).
ISO 16000-10:2011. Indoor air - Part 6: Determination of volatile organic compounds in indoor and test chamber air by active sampling on Tenax TA sorbent, thermal desorption and gas chromatography using MS or MS-FID. Internal Standardization Organization (ISO).
ISO 16000-10:2006. Indoor air - Part 10: Determination of the emission of volatile organic compounds from building products and furnishing -- Emission test cell method. Internal Standardization Organization (ISO).
Koivula, M., Kymalainen, H., Virta, J., Hakkarainen, H., Hussein, T., Komulainen, J., Koponen, H., Hautala, M., Hameri, K., Kanerva, P., Pehkonen, A., Sjoberg, A. (2005). Emissions from thermal insulations – part 2: evaluation of emissions from organic and inorganic insulations. Building and
Environment, 40, 803-814
Mølhave, L., Clausen, G., Berglund, B., Ceaurriz, J. D., Kettrup, A., Lindvall, T. & Younes, M. (1997). Total volatile organic compounds (TVOC) in indoor air quality investigations*. Indoor Air, 7(4), 225-240. NIST Chemistry WebBook (2009) National Institute of Standards and Technology – NIST Standard Reference Data Program. United States.
Sturgis, S., & Roberts, G. (2010). Redefining zero: Carbon profiling as a solution to whole life carbon emission measurement in buildings. RICS research,
Royal Institute of Chartered Surveyors, London.
Vasconcelos, A., Freddi, G. & Cavaco-Paulo, A. (2008). Biodegradable Materials Based on Silk Fibroin and Keratin. Biomacromolecules, 9(4), 1299-1305.
Wang, C., Sun J., Liu, X., Sudo, A., Endo, T. (2012). Synthesis and copolymerization of fully bio-based benzoxazines from guaiacol, furfurylamine and stearylamine. Green Chemistry, 14, 2799-2806. WHO, (2000). WHO Air quality guidelines for
Europe 2nd Ed. ISBN 92 890 1358 3.
WHO, (2010). WHO guidelines for indoor air quality:
selected pollutants. ISBN 978 92 890 0213 4.
Wojciechowska, E., Wlochowicz, A., Weselucha-Birczynska, A. (1999). Application of Fourier-transform infrared and Raman spectroscopy to study degradation of the wool fiver keratin, Journal
of Molecular Structure, 511-512, 307-318.
Wolkoff, P. (1998). Impact of air-velocity, temperature, humidity, and air on long-term VOC
emissions from building products. Atmospheric
Environment, 32(14/15), 2659-2668.
Wolkoff, P. (1999). How to measure and evaluate volatile organic compound emissions from building products. A perspective. The Science of the Total
Environment, 227, 197-213.
Wortmann, G., Zwiener, G., Sweredjuk, R., Doppelmayer, F., & Wortmann, F. J. (1999). Uptake and bonding of indoor pollutants by wool exemplified with formaldehyde. DWI Reports, 122, 590-595.
Yu, C., Crump, D. (1998). A review of the emission of VOCs from Polymeric Materials used in Buildings.