HAL Id: hal-00318062
https://hal.archives-ouvertes.fr/hal-00318062
Submitted on 21 Dec 2005
HAL is a multi-disciplinary open access
archive for the deposit and dissemination of
sci-entific research documents, whether they are
pub-lished or not. The documents may come from
teaching and research institutions in France or
abroad, or from public or private research centers.
L’archive ouverte pluridisciplinaire HAL, est
destinée au dépôt et à la diffusion de documents
scientifiques de niveau recherche, publiés ou non,
émanant des établissements d’enseignement et de
recherche français ou étrangers, des laboratoires
publics ou privés.
Concurrent study of bottomside spread F and plasma
bubble events in the equatorial ionosphere during solar
maximum using digisonde and ROCSAT-1
C.-C. Lee, S.-Y. Su, B. W. Reinisch
To cite this version:
C.-C. Lee, S.-Y. Su, B. W. Reinisch. Concurrent study of bottomside spread F and plasma bubble
events in the equatorial ionosphere during solar maximum using digisonde and ROCSAT-1. Annales
Geophysicae, European Geosciences Union, 2005, 23 (11), pp.3473-3480. �hal-00318062�
Annales Geophysicae, 23, 3473–3480, 2005 SRef-ID: 1432-0576/ag/2005-23-3473 © European Geosciences Union 2005
Annales
Geophysicae
Concurrent study of bottomside spread F and plasma bubble events
in the equatorial ionosphere during solar maximum using digisonde
and ROCSAT-1
C.-C. Lee1, S.-Y. Su2, and B. W. Reinisch3
1General Education Center, Ching-Yun University, Jhongli City, Taoyuan County, Taiwan
2Institute of Space Science and Center for Space and Remote Sensing Research, National Central University, Jhongli City,
Taoyuan County, Taiwan
3Center for Atmospheric Research, University of Massachusetts Lowell, Massachusetts, USA
Received: 18 July 2005 – Revised: 7 October 2005 – Accepted: 26 October 2005 – Published: 21 December 2005
Abstract. Data from the Jicamarca digisonde and the ROCSAT-1 satellite are employed to study the equatorial ionosphere on the west side of South America during April 1999–March 2000 for the concurrent bottomside spread F (BSSF) and plasma bubble events. This study, using digisonde and ROCSAT-1 concurrently, is the first attempt to investigate the equatorial spread F. Results show that BSSF and plasma bubble observations appear frequently respec-tively in the summer (January, February, November, and De-cember) and in the equinoctial (March, April, September, and October) months, respectively, but are both rarely ob-served in the winter (May–August) months. The upward drift velocity during the concurrent BSSF and bubble obser-vations has been determined to study the driving mechanism. This analysis shows that large vertical drift velocities favor BSSF and bubble formations in the equinoctial and sum-mer months. Conversely, the smaller upward velocities dur-ing the winter months cause fewer BSSF and bubble rences. For the geomagnetic effect, the BSSF/bubble occur-rence decreases with an increasing Kpvalue in the
equinoc-tial months, but no such correlation is found for the summer and winter months. Moreover, the anti-correlations between
Kp and dh0F/dt are apparent in the equinoctial months, but
not in the summer and winter months. These results indi-cate that in the equinoctial months the BSSF/bubble gener-ations and the pre-reversal drift velocity can be suppressed by geomagnetic activity, because the disturbance dynamo ef-fects could have decreased the eastward electric field near sunset. However, BSSF and bubble occurrences may not be suppressed by the geomagnetic activity in the summer and winter months.
Keywords. Ionosphere (Ionospheric irregularities;
Equato-rial ionosphere)
Correspondence to: C.-C. Lee
(cclee@cyu.edu.tw)
1 Introduction
Plasma irregularities and inhomogeneities in the equatorial F region caused by plasma instabilities are called the equato-rial spread F (ESF) (e.g. Kelley, 1989). Many investigators (Tsunoda et al., 1982; Zalesack et al., 1982; Kelley, 1989; Sultan, 1996) have proposed that the instability processes, in-volving the gravitational Rayleigh-Taylor (GRT) and E×B instabilities, could have started with irregularities in the bot-tomside F-layer (botbot-tomside spread F, BSSF). Further, the nonlinear development of instabilities will form the vertical elongated wedges of plasma depletions (bubbles) that drift upward from the bottomside F-layer to altitudes as high as 1500 km (e.g. Kelley, 1989; Sultan, 1996). According to the previous investigations (e.g. Aarons, 1993; Whalen, 2002), the irregularities of the equatorial BSSF are usually confined to below the F-peak. Therefore, BSSF, which maps via the geomagnetic field to a narrow band of latitude, is observed only by sounders near the dip equator. On the other hand, plasma bubbles can extend to a wider latitudinal coverage, because the flux tubes in a vertical wedge are typical depleted along their north-south extent (Whalen, 1997, 2002).
Since the original description of the equatorial BSSF and bubble by Woodman and La Hoz (1976), the two have been interesting subjects of many studies (e.g. Whalen, 1997, 2002; Fejer et al., 1999; Huang, 2001; Su et al., 2001). The past results indicate that the occurrences of both BSSF and bubble depend on season, longitude, solar cycle, and geo-magnetic activity (Maruyama and Matuura, 1984; Whalen, 1997, 2002; Fejer et al., 1999; Huang, 2001; Lee at al., 2005). Nevertheless, little work has been published exam-ining the simultaneous occurrence of BSSF and bubble in the equatorial ionosphere (Whalen, 1997, 2002). In his first report, Whalen (1997) compared the monthly occurrence of bubble with that of BSSF during solar maximum, using a chain of ionospheric sounders in the western American sec-tor. He found that the BSSF and bubble occurrences were
3474 C.-C. Lee et al.: Bottomside spread F and plasma bubble events in the equatorial ionosphere
Fig. 1. The location of Jicamarca digisonde (black dot) and the
area for ROCSAT-1 data selection (shaded area). The solid circle represents the wide beam of the digisonde transmit antenna at 600-km altitude. The shaded area is through ±15◦ dip latitudes and 355±5◦geomagnetic longitudes. An example of a ROCSAT-1 pass (solid line) and the associated ion density measurement (red line) is during 03:50–04:02 UT on 24 March 2000.
greater in the summer (December) and equinoctial (April and September) months, and had a minimum in the winter (July) months. Then Whalen (2002) employed the same data set to study the dependence of BSSF and bubble occurrences on season, the geomagnetic activity, and the E×B drift veloc-ity. He suggested that bubble occurrence is associated with the magnitude of the drift velocity, and the BSSF/bubble gen-eration is suppressed by the geomagnetic activity.
Although Whalen (1997, 2002) simultaneously investi-gated the BSSF and bubble formations in the equatorial iono-sphere, he did not use satellite data or estimated the vertical drift velocity from his data set. The vertical drift velocity has been known to greatly affect the occurrences of the BSSF and plasma bubble (Fejer et al., 1999). Therefore, to study the BSSF and bubble more thoroughly, we employ the Jica-marca (12◦S, 76.9◦W, dip latitude: 1.2◦N) digisonde data and the ROCSAT-1 observations of plasma bubbles, to study the equatorial ionosphere from April 1999 to March 2000. In particular, the vertical E×B drift derived from the minimum virtual height of the F-layer (h0F )on the observed ionogram is used in this study. Moreover, we have used these data to examine the dependence of the BSSF and bubble occurrences on season, the E×B drift velocity, and the geomagnetic ac-tivity (Kp) in the current study.
Fig. 2. Two ionogram examples of Jicamarca BSSF at (a) 03:30 and (b) 04:00 UT on 24 March 2000.
2 Experiment setup
The Jicamarca digisonde (12◦S, 76.9◦W, dip latitude: 1.2◦N, geomagnetic longitude: 355◦, see Fig. 1) observes the ionosphere near the dip equator. The solid circle in Fig. 1 represents a wide beam illuminating an area of ∼500-km ra-dius at 600 km altitude of the digisonde transmit antenna. The ionogram data with a time interval of 30 min during April 1999–March 2000, which is close to the peak of solar cycle 23 which is in April 2000, are used for this study. No-tice that in this period, the monthly smoothed sunspot num-bers are between 85.5–119.9 and the monthly average values of F10.7 solar flux are 118.0–206.1. The presence/absence of a BSSF and other ionospheric parameters, for example,
h0F (minimum virtual height of the F layer), foF2 (maxi-mum frequency of F-layer), RF (range spread in km), were obtained by the ARTIST program (Reinisch, 1996) and man-ual works. For example, two ionograms of BSSF at 03:30 and 04:00 UT of 24 March 2000 are displayed in Figs. 2a and b, respectively. Because we focus on the pre-midnight BSSF, only BSSF that occurred between 18:00 and 24:00 LT (LT=UT–5 h) is included in the statistical analysis. More-over, we deduced the value of dh0F/dt from the temporal rate (the time interval is 30 min) of h0F. Notably, the value
C.-C. Lee et al.: Bottomside spread F and plasma bubble events in the equatorial ionosphere 3475
Fig. 3. Illustration of the bubble distribution in altitude and in relation to the geomagnetic fields. An equatorial bubble can rise to high
altitudes and extent via the geomagnetic field to high latitudes as ∼16◦ dip latitude (gray area) where the crest of equatorial ionization anomaly is located. When a bubble intersects the anomaly crest, it is detectable at 600 km between ±15◦dip latitude by the ROCSAT-1.
Table 1. Numbers of BSSF day, digisonde day, bubble day, and ROCSAT-1 day for each month during April 1999–March 2000.
month Jan Feb Mar Apr Mai Jun Jul Aug Sep Oct Nov Dec BSSF day (days) 17 26 30 20 12 7 9 14 21 21 25 23 digisonde day (days) 17 28 31 26 27 22 20 29 26 25 26 24
bubble day (days) 6 9 9 3 0 0 0 1 4 6 3 5
ROCSAT-1 day (days) 16 25 17 15 12 12 12 14 12 13 11 20
of dh0F/dt can describe the E×B drift velocity, according to Bittencourt and Abdu (1981). Since E×B drift generally reaches its maximum value before the onset of a BSSF (e.g. Fejer et al., 1999; Whalen, 2002; Lee et al., 2005), we uti-lize the maximum value of dh0F/dt (hereafter described as dh0F/dt) between 18:00 LT and the time of BSSF onset in
the following analysis.
Bubbles are recorded by the ion trap (IT) on board ROCSAT-1 orbiting at a 600-km altitude with a 35◦
inclina-tion (see Yeh et al. (1999) for detail). For a concurrent study with the Jicamarca BSSF, we chose the plasma bubbles that appear in the area inside ±15◦dip latitudes and 355±5◦ ge-omagnetic longitudes (shaded area in Fig. 1) during 18:00– 24:00 LT. The ±15◦dip latitude limit is chosen because it is near the location of the crests of the equatorial ionization anomaly in both the north and south hemispheres (dark el-lipse in Fig. 3) where bubbles can be extended via the geo-magnetic field (Whalen, 1997, 2002). The region of 355±5◦ geomagnetic longitudes is chosen because of the coverage of the beam width of the Jicamarca digisonde. Therefore,
a bubble that appears in the gray area of Fig. 1 during pre-midnight can be associated with bubbles that are over the top of the Jicamarca BSSF. An example of a ROCSAT-1 bubble (red line) that appears simultaneously with the Jica-marca BSSF (shown in Fig. 2) and the associated satellite pass (solid line) during 03:50–04:02 UT on 24 March 2000 are shown in Fig. 1.
3 Results and discussion
3.1 Seasonal occurrences of BSSF and bubble formation In each month, the number of days (BSSF day) on which at least one pre-midnight BSSF event is observed on that day and the number of days of digisonde observation (digisonde day) are shown in Table 1. For the bubble events, the num-ber of days (bubble day) on which at least one pre-midnight bubble event is observed in the chosen area (Fig. 1) on that day and the number of days (ROCSAT-1 day) on which the
3476 C.-C. Lee et al.: Bottomside spread F and plasma bubble events in the equatorial ionosphere
Fig. 4. The seasonal variations in the BSSF (solid line) and bubble
(dashed line) occurrences during March 1999–April 2000.
ROCSAT-1 passes over the chosen area during pre-midnight are also displayed in Table 1.
Figure 4 shows the seasonal variation in the occurrence probabilities of BSSF (solid line) and bubble (dashed line) between April 1999 and March 2000. The occurrence prob-ability of BSSF is the ratio of BSSF day to digisonde day. For the occurrence of BSSF, the highest (100%) and lowest (32%) probabilities of occurrence fall in January (summer) and in June (winter), respectively. During the equinoctial months (March, April, September, and October), the occur-rence probabilities are more than 75%. Generally, the BSSF occurrence is higher in the summer (November, December, January, and February)/the equinoctial months, than in the winter months (May, June, July, and August). The seasonal variation of the Jicamarca BSSF occurrence is similar with that in the Huancayo (12◦S, 75.3◦W) BSSF occurrence rate reported by Whalen (2002) for 1958. He found that the high-est and lowhigh-est occurrence rates of total BSSF (his Fig. 4) are in December and July, respectively.
For the bubble event, the occurrence probability is the ra-tio of bubble day to ROCSAT-1 day. It is found that in Fig. 4 the highest occurrence probability for bubbles does not exist in the summer months. Two peaks of high bubble occurrence probability are noticed in March (53%) and October (46%), with the lowest occurrence in the winter months. Notably, only one bubble has been observed by ROCSAT-1 in August and none during May-July (0%). Such distribution for the two-peak variation in bubble occurrence has also been pro-posed by Huang et al. (2001) and Whalen (2002). Huang et al. (2001) showed that DMSP F9 measured the highest occurrences of the equatorial plasma bubble over Huancayo (their Fig. 7) in March and October. In addition, Whalen (2002) concluded that the two peaks of bubble occurrence
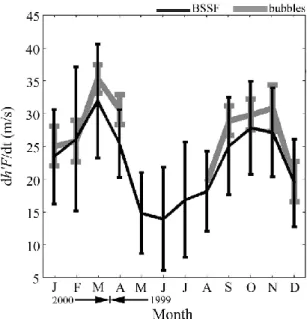
Fig. 5. The seasonal variations in the monthly mean dh0F/dt of the BSSF (black line) and bubble (gray line) events. The error bar represents the standard deviation of the mean dh0F/dt in the BSSF and bubble events.
are in April and September (his Fig. 4). It is now known that the seasonal variation in the BSSF occurrence is related to the magnitude of the maximum pre-reversal drift velocity and the late reversal time of the vertical velocity (Fejer et al., 1999; Whalen, 2002). However, the reason for the seasonal variation in the bubble occurrence is still not clear. Although Whalen (2002) suggested that the bubble occurrence is asso-ciated with the magnitude of the maximum pre-reversal drift velocity, he did not compare the probability of bubble occur-rence with the vertical drift velocity of his data set. Thus, it is necessary to study the relationship between the BSSF/bubble occurrence and the associated vertical drift velocity.
3.2 Seasonal variation in dh0F/dt
In this section, we examine the seasonal variations in the monthly mean value of dh0F/dt (Fig. 5). The mean value of dh0F/dt for the BSSF (black line)/bubble (gray line) events in a month is the average of the maximum pre-reversal drift velocities of days on which at least a pre-midnight BSSF/bubble is observed. For the BSSF event, the mean dh0F/dt peaks in March (32 m/s) and in October (28 m/s).
During the summer and winter months, the mean dh0F/dt
are 20–27 and 14–18 m/s, respectively. Regarding the bub-ble event, there are also two peaked values found, one in March (35 m/s) and the other in October (33 m/s). The val-ues of the mean dh0F/dt are 20–31 and 20 m/s in the sum-mer months and in August, respectively. During the months from May to July, no dh0F/dt is calculated because no bub-ble appeared in these months. These seasonal variations are close to what Fejer et al. (1999) found (his Fig. 8). They claimed that the largest and smallest vertical velocities are
C.-C. Lee et al.: Bottomside spread F and plasma bubble events in the equatorial ionosphere 3477 found at the equinox and the June solstice, respectively. The
values of the maximum vertical velocity during the high so-lar activity period obtained by Fejer et al. (1999) are 33–48, 28–34, and 18 m/s in the equinoctial, summer, and winter months, respectively. Notably, in Fig. 5, the values of mean dh0F/dt (standard deviation) are generally larger (smaller) for the bubble event than for the BSSF event.
For the BSSF events, the seasonal variation in the mean dh0F/dt is different from that in the BSSF occurrence (solid line in Fig. 4). During the equinoctial months, a larger dh0F/dt and a higher BSSF occurrence rate indicate that a larger upward drift lifts the F-layer to higher altitudes, which not only results in a favorable condition for the GRT insta-bility but also causes an E×B drift instainsta-bility (Maruyama, 1988; Kelley, 1989). In contrast, the small dh0F/dt value
and the lower occurrence in the winter months suggest that the F-layer is not raised to an altitude high enough to gener-ate instabilities. These relations between the mean value of dh0F/dt and the BSSF occurrence distribution indicate that the pre-reversal E×B drift plays an important role in the seeding mechanism of developing BSSF (Sultan, 1996; Fejer et al., 1999; Whalen, 2002; Lee et al., 2005). Additionally, during the summer months, the highest BSSF occurrence and the mean values of dh0F/dt, 20–27 m/s, suggest that another mechanism would also help the BSSF formation. In addition, the late reversal time of the upward drift velocity should be another reason to account for the highest occurrence proba-bility at December solstice, because the late reversal time is favorable for the development of strong scattering layers in the F-region (Maruyama, 1988; Fejer et al., 1999).
For the bubble events, the mean dh0F/dt and the probabil-ity occurrence (dashed line in Fig. 4) both show peaks oc-curring in March and October. This coincidence between the two demonstrates that the magnitude of the maximum pre-reversal velocity is a principle mechanism for the bubble generation. Furthermore, the result obtained in this obser-vation supports the report of Whalen (2002), who compared the bubble occurrence with the maximum pre-reversal drift velocity of Fejer et al. (1999).
3.3 Geomagnetic effect on the occurrence of BSSF and bubble formation
The occurrence of BSSF/bubbles was examined for each day in relation to the geomagnetic activity of that day, which is taken as the average value of Kprecorded during the 6 h prior
to the BSSF onset (e.g. Fejer et al., 1999; Whalen, 2002). Notice that the average Kp(hereafter referred simply as Kp)
is generally derived from the interval of 18:00-24:00 UT (13:00-19:00 LT). The numbers of BSSF day, digisonde day, bubble day, and ROCSAT-1 day for each Kpin the
equinoc-tial, summer, and winter months are displayed in Tables 2, 3, and 4, respectively.
The occurrence probabilities of BSSF (black bar) and bub-bles (gray bar) observed are categorized by season and plot-ted versus Kp in Fig. 6. The occurrence probability in each Kpfor the BSSF (bubble) event is the ratio of BSSF (bubble)
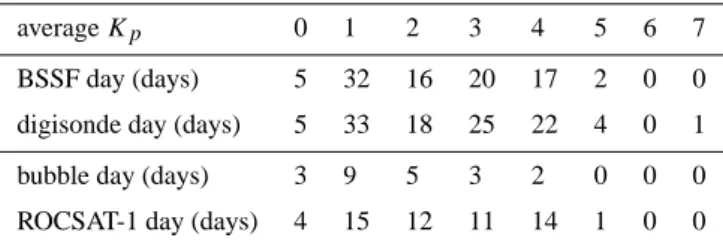
Table 2. Numbers of BSSF day, digisonde day, bubble day, and
ROCSAT-1 day for each average Kpin the equinoctial months.
average Kp 0 1 2 3 4 5 6 7
BSSF day (days) 5 32 16 20 17 2 0 0 digisonde day (days) 5 33 18 25 22 4 0 1 bubble day (days) 3 9 5 3 2 0 0 0 ROCSAT-1 day (days) 4 15 12 11 14 1 0 0
Table 3. Numbers of BSSF day, digisonde day, bubble day, and
ROCSAT-1 day for each average Kpin the summer months.
average Kp 0 1 2 3 4 5 6 7
BSSF day (days) 6 18 23 28 14 2 0 0 digisonde day (days) 6 19 24 28 14 3 1 0 bubble day (days) 1 4 7 6 4 1 0 0 ROCSAT-1 day (days) 5 15 13 23 12 3 1 0
Table 4. Numbers of BSSF day, digisonde day, bubble day, and
ROCSAT-1 day for each average Kpin the winter months.
average Kp 0 1 2 3 4 5 6 7
BSSF day (days) 9 11 10 8 2 1 0 1 digisonde day (days) 12 30 26 20 7 2 0 1 bubble day (days) 0 0 0 0 1 0 0 0 ROCSAT-1 day (days) 7 14 12 9 5 2 0 1
day to digisonde (ROCSAT-1) day. In the equinoctial months (Fig. 6a), BSSF occurs frequently or less frequently when
Kp is 0 or 5, respectively. The occurrence probability for
a BSSF event tends to decrease with increasing Kp in this
season. Such a descending trend in occurrence probability for Kp=0 to 4 also appears for the bubble events. On the
other hand, during the summer and winter months, no de-scending trend from Kp=0 to 5 is found in the distribution
of the BSSF and bubble events (Figs. 6b and c). Note that since there was only a single event, the descending trend in the bubble event cannot be identified for the winter months. Based on Fejer et al. (1999) and Whalen (2002), the descend-ing trend in the equinoctial months indicates that increasdescend-ing the geomagnetic activity would progressively suppress the BSSF and bubble developments in this season. However, these results are different from the report by Whalen (2002) (his Fig. 5), who reported that the descending trends in the to-tal BSSF and macroscopic bubble occurrences are observed
3478 C.-C. Lee et al.: Bottomside spread F and plasma bubble events in the equatorial ionosphere
Fig. 6. Occurrence probabilities of BSSF (black bar) and bubble (gray bar) for equinoctial (a), summer (b), and winter (c) months plotted as
a function of Kpdetermined as the average during the 6 h prior to measurement.
Fig. 7. Scatter plots of Kp and dh0F/dt for the BSSF and bubble events in the equinoctial (a, d), summer (b, e), winter (c) months.
The correlation coefficient and 95% corresponding confidence interval (C. I.) are displayed in the upper-left corner. The solid line is the least-squares straight line fitting to the points.
in the equinoctial and summer months, but not in the winter months. This difference might be related to the geomagnetic effect on the pre-reversal vertical velocity.
Consequently, the scatter plots of Kp and dh0F/dt for
the BSSF and bubble events in the equinoctial, summer, and winter months are shown in Fig. 7. In the equinoc-tial months (Figs. 7a and d), the correlation coefficients
(–0.57 and –0.72) and 95% corresponding confidence in-tervals – (–0.71, –0.39) and (–0.93,–0.52) mean that Kp
and dh0F/dt are moderately and well anti-correlated in
the BSSF and bubble events, respectively. Notice that the 95% corresponding confidence interval is obtained by the Fisher’s z-transformation with a normal approxima-tion (David, 1938). The least-squares straight lines fitting
C.-C. Lee et al.: Bottomside spread F and plasma bubble events in the equatorial ionosphere 3479 to the points are given by Kp= –0.09×dh0F/dt+4.95 and
Kp= –0.14×dh0F/dt+6.24 for the BSSF and bubble events,
respectively. The moderate and well anti-correlations reveal that the geomagnetic activity in this season would inhibit the maximum pre-reversal velocity, and further suppress the BSSF and bubble generations (Fig. 6a). This suppression ef-fect is due to the disturbance dynamo electric fields which decrease the upward drift velocity near the sunset terminator (Scherliess and Fejer, 1997; Fejer et al., 1999). Moreover, the greater value of the absolute coefficient in Fig. 7d sug-gests that the suppression effect of geomagnetic activity is more effective for bubble than for BSSF development.
For the summer months, the correlation coefficients (–0.49 and –0.28) and the least-squares straight lines (Kp= –0.08×dh0F/dt+4.77 and Kp= –0.04×dh0F/dt+3.93)
of the BSSF and bubble events are displayed in Figs. 7b and e. The moderate anti-correlation of –0.49 indicates that the geomagnetic activity could suppress the vertical veloc-ity in the BSSF event. However, the poor anti-correlation (–0.28) indicates that the geomagnetic suppression effect on dh0F/dt is not evident in the bubble event. Recall that the descending trend is not obvious in Fig. 6b; the geomag-netic suppression effects on the vertical velocity, and the BSSF and bubble formations are not evident in this sea-son. Similarly, in the winter months (Fig. 7c), the moderate anti-correlation is –0.45 and the least-squares straight line is
Kp= –0.12×dh0F/dt+4.66. Notice that the descending trend
in the plot of BSSF days versus Kpis not evident in Fig. 6c.
Therefore, in this season, the geomagnetic suppression due to the disturbance dynamo electric fields does not affect either the vertical drift velocity or the BSSF generation.
4 Summary and conclusion
We have analyzed one year of data of BSSF and bubble ob-servations in the equatorial ionosphere. This analysis is the first attempt to investigate concurrently the equatorial BSSF and bubble occurrences, respectively, obtained by the Jica-marca digisonde and ROCSAT-1 during April 1999–March 2000. The occurrence dependences of BSSF and bubble for-mation on season, dh0F/dt, and Kp were also examined in
the work.
For the BSSF events, the higher occurrence probabilities correlate well with a larger mean dh0F/dt (>20 m/s) in the
equinoctial and summer months. This result confirms that a larger pre-reversal velocity will lift the F-layer to higher al-titudes, and, in turn, help to develop the bottomside F-layer irregularities in these seasons. In contrast, a lower occur-rence probability and a smaller vertical velocity in the win-ter months indicates that the small pre-reversal velocity can-not raise the F-layer high enough to generate irregularities. For the bubble events, the two-peak distribution with maxi-mums in March and October is coincidentally observed in the seasonal variations for both the bubble occurrence and the mean dh0F/dt. This propounds that the bubble generation is
associated with the magnitude of the maximum pre-reversal drift velocity.
For the geomagnetic activity, we have demonstrated that the number of days for a BSSF/bubble event decreases with increasing Kpin the equinoctial months, but not in the
sum-mer and winter months. The fact of this anti-correlation sug-gests that the geomagnetic activity progressively suppresses the BSSF and bubble developments in that season. Addi-tionally, well to moderate anti-correlations between Kp and
dh0F/dt show that the pre-reversal drift velocity could be in-hibited by the geomagnetic activity, likely as a result of the disturbance dynamo effects. In contract, the BSSF and bub-ble generations may not be suppressed by the geomagnetic activity in the summer and winter months.
Acknowledgements. C.-C. Lee was supported by the grant of
Na-tional Science Council NSC 93-2119-M-231-002 and NSC 94-2111-M-231-001. S.-Y. Su was supported by the grant of Na-tional Science Council NSC 93-2111-M-008-023-AP, and NSC 94-NSPO(B)-IPEI-FA07-01. B. W. Reinisch was supported by the grant of AF grant #F19628-02-C-0092. The authors would like to thank the National Geophysical Data Center (NGDC) (www.ngdc. noaa.gov) for providing data of Kp, sunspot number, and F10.7
so-lar flux.
Topical Editor M. Pinnock thanks K. Shiokawa and another ref-eree for their help in evaluating this paper.
References
Aarons, J.: The longitudinal morphology of equatorial F-layer ir-regularities relevant to their occurrence, Space Sci, Rev., 63, 209–243, 1993.
Bittencourt, J. A. and Abdu, M. A.: A theoretical comparison be-tween apparent and real verical ionization drift velocities in the equatorial F region, J. Geophys. Res., 86, 2451–2454, 1981. David, F. N.: Tables of the Correlation Coefficient, in: Tables for
Statistics 1976, edited by: Hartley, H. O. and Pearson, E. S., reprinted in Biometrika, vol. I., 3rd edition, Cambridge Univer-sity Press, Cambridge, 1938.
Fejer, B. G., Scherliess, L., and de Paula, E. R.: Effects of the verti-cal plasma drift velocity on the generation and evolution of equa-torial F, J. Geophys. Res., 104, 19 859–19 869, 1999.
Huang, C. Y., Burke, W. J., Machuzak, J. S., Gentile, L. C., and Sultan, P. J.: DMSP observations of equatorial plasma bubbles in the topside ionosphere near solar maximum, J. Geophys. Res., 106, 8131–8142, 2001.
Kelley, M. C.: The Earth’s Ionosphere, Int. Geophys. Ser., vol. 43, Academic, San Diego, Calif, 1989.
Lee, C. C., Liu, J. Y., Reinisch, B. W., Chen, W. S., and Chu, F. D.: The effects of the pre-reversal E×B drift, the EIA asymmetry, and geomagnetic activity on the equatorial spread F during solar maximum, Ann. Geophys., 23, 745–751, 2005,
SRef-ID: 1432-0576/ag/2005-23-745.
Maruyama, T.: A diagnostic model for equatorial spread F 1, Model description and application to electric field and neutral wind ef-fects, J. Geophys. Res., 93, 14 611–14 622, 1988.
Maruyama, T. and Matuura, N.: Longitudinal variability of annul changes in activity of equatorial spread F and plasma depletions, J. Geophys. Res., 89, 10 903–10 912, 1984.
3480 C.-C. Lee et al.: Bottomside spread F and plasma bubble events in the equatorial ionosphere
Reinisch, B. W.: Modern ionosondes, in: Modern Radio Science, edited by: Kohl, H., Ruester, R., and Schlegel, K., European Geophysical Society, Katlenburg-Lindau, Germany, 440–458, 1996.
Scherliess, L. and Fejer, G. B.: Storm time dependence of equatorial disturbance dynamo zonal electric fields, J. Geophys. Res., 102, 24 037–24 046, 1997.
Su, S. Y., Yeh, H. C., and Heelis, R. A.: ROCSAT-1 IPEI observa-tions of equatorial spread F-some early transitional scale results, J. Geophys. Res., 106, 29 153–29 159, 2001.
Sultan, P. J.: Linear theory and modeling of the Rayleigh-Talor in-stability leading to the occurrence of equatorial F, J. Geophys. Res., 101, 26 875–26 891, 1996.
Tsunoda, R. T., Livington, R. C., McClure, J. P., and Hanson, W. B.: Equatorial plasma bubbles: Vertical elongated wedges from the bottomside F layer, J. Geophys. Res., 87, 9171–9180, 1982.
Whalen, J. A.: Equatorial bubbles observed at the north and south anomaly crests: Dependence on season, local time and dip lati-tude, Radio Sci, 32, 1559–1566, 1997.
Whalen, J. A.: Dependence of the equatorial bubbles and bot-tomside spread F on season, geomagnetic activity, and E×B drift velocity during solar maximum, J. Geophys. Res., 107, doi:10.1029/2001JA000039, 2002.
Woodman, R. F. and La Hoz, C.: Radar observations of F region equatorial irregularities, J. Geophys. Res., 81, 5447–5466, 1976. Yeh, H. C., Su, S. Y., Yeh, Y. C., Wu, J. M., Heelis, R. A., and Holt, B. J.: Scientific mission of the IPEI payload onboard ROCSAT-1, Terr. Atmos. Ocean. Sci., suppl., 19–42, 1999.
Zalesack, S. T., Ossalow, S. L., and Chaturvedi, P. K.: Nonlinear equatorial spread F: the effect of neutral winds and background Pederson conductivity, J. Geophys. Res., 87, 151–166, 1982.