Frank T. C. Tschirch Anja Struwe Henrik Petrowsky Irini Kakales Borut Marincek Dominik Weishaupt Received: 18 November 2007 Revised: 12 January 2008 Accepted: 27 January 2008 Published online: 28 March 2008 # European Society of Radiology 2008
Contrast-enhanced MR cholangiography
with Gd-EOB-DTPA in patients with liver
cirrhosis: visualization of the biliary ducts
in comparison with patients with normal liver
parenchyma
Abstract The purpose of this study was to assess the quality of biliary duct visualization using
Gd-EOB-DTPA-enhanced magnetic reso-nance cholangiography (EOB-MRC) in patients with liver cirrhosis. Forty adult patients with liver cirrhosis (cir-rhosis group) and 20 adult individuals with normal liver parenchyma (control group) underwent EOB-MRC using T1-weighted GRE imaging up to 180 min after Gd-EOB-DTPA admin-istration. Two observers assessed the visualization of each biliary structure and the overall anatomical visualiza-tion of the biliary tree. Child-Pugh, MELD score and laboratory findings were compared. The grade of visual-ization for each evaluated biliary structure was statistically different in the two groups (P=0.004 to <0.001). The overall EOB-MRC quality was rated as sufficient for anatomical visualization of the biliary tree in all individuals of the control group 20 min after Gd-EOB-DTPA applica-tion, but in only 16/40 patients (40%)
of the cirrhosis group within 30 min after application. Analysis of the ROC curves revealed that the cut-off values, for non-sufficient visualization of the biliary tree 20 min after
Gd-EOB-DTPA application, were MELD
scores≥11 and total serum bilirubin
levels≥30 μmol/l. Consecutively,
EOB-MRC in patients with liver cir-rhosis resulted in a decreased or even non-visualization of the biliary tree in a substantial percentage of patients. Keywords Gd-EOB-DTPA . Cholangiography . MR . Liver cirrhosis
Introduction
Contrast-enhanced magnetic resonance cholangiography (MRC) using hepatobiliary contrast agents, in combina-tion with T1-weighted two-dimensional (2D) or three-dimensional (3D) gradient-echo (GRE) sequences, is considered an alternative to conventional techniques for
the evaluation of the biliary tree [1,2]. Recent studies have
shown that contrast-enhanced MRC is particularly useful for the evaluation of biliary tract abnormalities in healthy
individuals (e.g., potential living liver donors), and in
patients suspected to have a biliary leak [1,3–5]. Although
contrast-enhanced MRC is increasingly used by radiolo-gists, there is paucity of data in the literature with regard to the degree and extent of biliary excretion of hepatobiliary contrast agents. To the best of our knowledge, all of these studies were performed in patients with healthy liver
parenchyma and normal liver function [1,6–9]. However,
since hepatobiliary contrast agents are excreted into the bile ducts by a cellular process at the level of the F. T. C. Tschirch . A. Struwe .
I. Kakales . B. Marincek . D. Weishaupt Institute of Diagnostic Radiology, University Hospital Zürich, Rämistrasse 100,
8091 Zürich, Switzerland H. Petrowsky
Department of Visceral and Transplantation Surgery, University Hospital Zürich, Rämistrasse 100, 8091 Zürich, Switzerland F. T. C. Tschirch (*) Institute of Radiology, Hospital Zimmerberg, Asylstrasse 19, 8810 Horgen, Switzerland e-mail: [email protected] Tel.: +41-44-7281111 Fax: +41-44-7281115
hepatocyte, it might be hypothesized that the degree of biliary excretion of the contrast agent is dependent on liver function. This is of particular interest in patients with liver cirrhosis who have impaired liver function.
Hence, the purpose of this study was to assess the quality of visualization of the biliary ducts in Gd-EOB-DTPA (gadoxetic acid)-enhanced MRC (EOB-MRC) with liver cirrhosis patients and in comparison with individuals with normal liver parenchyma and normal liver function.
Materials and methods
The study was approved by the local ethics committee and written informed consent was obtained from all participat-ing patients before their MR examination.
Patients
During a 15-month period (October 2005 to December 2006), 40 consecutive adult patients (nine female, 31 male, mean age 52.9 years) with liver cirrhosis were included in this prospective study (cirrhosis group). Patients were included only if the liver cirrhosis was histologically proven by biopsy and if the patients had no previous hepatic or biliary surgery with exception of cholecystec-tomy. None of the patients had undergone transarterial
chemoembolization, percutaneous ethanol injections,
radiofrequency ablation, or implantation of a transjugular intrahepatic stent-shunt. All patients were referred to our institution for work-up before a possible liver transplant and fulfilled the Milan criteria (one nodule <5 cm, or two to three nodules all <3 cm, and without macroscopic vascular invasion) [10]. Exclusion criteria were age under 18 years, general contraindications for MR examinations (i.e., car-diac pacemakers, neurostimulators, ferromagnetic im-plants, etc.), pregnancy, breast feeding, contraindications for the use of contrast agents containing gadolinium (i.e., known previous reactions, etc.), application of another liver-specific or gadolinium-containing contrast agent in the last 2 weeks, creatinine clearance below 30 ml/min, and simultaneous participation in another study.
The underlying causes of liver cirrhosis were hepatitis C (13 patients), hepatitis B (seven patients), alcohol abuse (seven patients), primary biliary sclerosing cholangitis (five patients), autoimmune hepatitis (two patients), cryp-togenic cirrhosis (three patients), and primary biliary cirrhosis (one patient). In two patients the reason for the liver cirrhosis was unknown. Cirrhosis was classified as Child-Pugh class A in 19 patients, Child-Pugh class B in 15 patients, and Child-Pugh class C in six patients.
The cirrhosis group was compared to a control group of 20 prospectively consecutive adult individuals (five
fe-male, 15 fe-male, mean age 44.8 years) with normal liver function, which were referred for clinical reasons during the study period. Individuals were included in the control group only if there was no clinical history, clinical signs, imaging findings, or laboratory parameters of liver dys-function (i.e., normal serum values of blood coagulation parameters, liver enzymes, and total bilirubin). Patients with focal liver lesions were included as long as they had ≤4 lesions, which were each ≤3 cm in diameter. Exclusion criteria were the same as stated for the cirrhosis group. The indications for liver MR imaging were evaluation of potential living liver donors, follow-up examinations of focal liver lesions, and assessment of unclear focal liver lesions previously detected by other imaging modalities. The focal liver lesions proven by either histology or imaging follow-up were hemangiomas (seven individuals), focal nodular hyperplasia (five individuals), cysts (five individuals), metastases (five individuals), focal steatosis or sparing (three individuals), and adenomas (one indivi-dual). In one individual no focal or diffuse liver pathology was found.
MR imaging
All individuals underwent MR imaging of the liver using a 1.5-Tesla MR system (Signa EchoSpeed EXCITE HD; GE Healthcare, Milwaukee, Wis., USA). For signal reception in all examinations an eight-channel anteroposterior phased-array surface coil was placed around the individual and covered the entire liver.
Imaging protocols for both of the groups included unenhanced sequences (coronal single-shot fast spin-echo (SSFSE), transaxial T2-weighted fast specho (FSE), in-and out-of-phase gradient-echo (GRE) sequences), dynam-ic GRE sequences in the arterial, portal-venous and extracellular phase, as well as delayed sequences (see below). Each individual received an intravenous bolus injection of gadolinium-ethoxybenzyl-dietylenetriamine pentaacetic acid (Gd-EOB-DTPA; gadoxetic acid, Primo-vist, Bayer Schering Pharma, Berlin, Germany) as contrast
agent at a dose of 25μmol/kg body weight at a flow rate of
2 ml/s, followed by a 20-ml saline flush. The dynamic as well as the delayed imaging was performed using a fat-suppressed 3D T1-weighted GRE sequence using parallel
imaging (LAVA EFGRE ASSET breathhold: TR/
TE=3.1 ms/1.4 ms; flip angle,15°; field of view, 42× 42 cm; matrix, 384×256, interpolated to 512×512; thickness, 4 mm; overlap 2 mm, ASSET acceleration, 2.0). Whereas the dynamic GRE imaging was performed in the transaxial plane, the delayed imaging (so-called MRC) was performed at different time points up to 180 min after bolus application of Gd-EOB-DTPA in the transaxial as well as in the coronal planes. All individuals of both groups
had delayed MR imaging at 10, 20, and 30 min after bolus application of Gd-EOB-DTPA. Additional delayed MR imaging at 60, 120, and 180 min after bolus application of Gd-EOB-DTPA were performed only if the visualization of the biliary ducts was not sufficient for anatomical diagnosis within 30 min after application of Gd-EOB-DTPA (defi-nition of the criteria see below). The attending radiologist made the decision whether additional delayed MR imaging at 60, 120, and 180 min had to be performed. This radiologist was not involved in the image analysis of the study.
Image analysis
Two experienced radiologists (D.W. and F.T.C.T., with 12 and 5 years of experience in abdominal MR imaging, respectively), blinded to all clinical and radiological data, evaluated all MR images of the delayed phase of imaging (MRC) in random order and in consensus. Randomization was performed with regard to patients, cirrhosis versus control group, and the different time points when imaging was performed. For imaging evaluation, the transaxial as well as coronal planes of the MRC for each time point were available. The source images as well as the reformatted images [maximum intensity projections (MIPs)] were evaluated electronically on an interactive workstation (Advantage Windows Workstation 4.2; GE Medical Systems Europe, Buc, France). The readers themselves performed the MIPs.
The readers were asked to evaluate all image sets (i.e., EOB-MRC of each time point) with regard to the grade of visualization of the bile ducts. For the purpose of the study, the biliary tree was divided into the following different anatomical parts: the common bile duct, cystic duct, gallbladder, common hepatic duct, right and left hepatic duct and second order division ducts. The grade of visualization of the different parts of the biliary tree was assessed separately at each time point using the following three-point scale: grade 0, no visualization; grade 1, poor visualization; grade 2, good visualization. Grade 0 or 1 was applied if no or only little contrast media could be identified in the examined portion of the biliary tree. Bile ducts classified as grade 2 were completely and sufficiently filled by the intrabiliary contrast agent.
In addition to the grading of visualization of the individual anatomical structures of the biliary tree, an overall rating taking into account the entire biliary tract was performed. Visualization of the biliary tree was deemed sufficient for anatomical diagnosis if visualization of the common bile duct, common hepatic duct, and left and right hepatic ducts was rated as good (grade 2) at the same time point.
Comparison with liver-function parameters
Patients’ charts were reviewed and various blood serum
parameters were recorded as long as they were available and not older than 1 week before or after MR imaging. Since all included patients were referred from our liver transplant unit and imaging was performed for work-up prior to a possible liver transplant, laboratory investigations were performed for clinical reasons. The following serum parameters were recorded: platelet count, quick prothrombin time (PT), international normalized ratio (INR), partial thromboplastin time (PTT), total bilirubin, protein, albumin, ceruloplasmin, aspartate aminotransferase (ASAT), alanine aminotransfer-ase (ALAT), gamma-glutamyl transpeptidaminotransfer-ase (GGT), alka-line phosphatase (AP), transferrin, ferritin, and creatinine. In addition, the Child-Pugh class and the model for end-stage liver disease (MELD) score of each patient were determined. The MELD score is based on the formula: 9.57 ×
loge[creatinine (mg/dl)] + 3.78 × loge[total bilirubin
(mg/dl)] + 11.2 × loge(INR) + 6.43 and calculated using an
online worksheet available over the internet at http://www. mayo clinic.org/gi-rst/mayomodel5.html. Although calcula-tion of MELD score is only meaningful in patients with impaired liver function, for the purpose of this study we calculated this score also for patients with normal liver function (so-called theoretical MELD score).
The blood serum parameters as well as the Child-Pugh class and the MELD score were compared with the grade of visualization of the bile ducts in both groups at each time point.
Statistics
Statistical analysis was performed using SPSS 12.0.1 for Windows (SPSS, Chicago, USA). Comparisons between the grade of visualization of the bile ducts in both groups and the various liver function parameters were performed by using the Mann-Whitney test. Cut-off values for single liver function parameters were determined by means of
receiver-operating characteristic (ROC) curves. Fisher’s
exact test (for overall anatomical visualization of the biliary tree) and the Mann-Whitney test (for liver function parameters) were used to compare the two patient groups. Mann-Whitney test with exact P values and Bonferroni correction for multiple testing (for three examined time points) was performed to compare the frequency distribu-tion of the grade of visualizadistribu-tion of each of the evaluated biliary structures of the biliary tree 10, 20 and 30 min after contrast application in the two patient groups, so statistical significance was accepted if P<0.0167 (0.05/3). For all other tests statistical significance was accepted if P<0.05. ROC curves and graphs were plotted using MedCalc 9.3.0.0 for Windows (MedCalc Software, Mariakerke, Belgium).
T able 1 Overview of the blood serum parameters in the cirrhosis and control group (PT prothrombin time, INR international normalized ratio, PTT partial thromboplastin time, ASA T aspartate aminotransferase, ALA T alanine aminotransferase, GGT gamma-glutamyl transpeptidase, AP alkaline phosphatase, SD standard deviation) Laboratory test, units (normal range) Platelets, 1,000/ μ l (143 –400) Quick PT , % (70 –120) INR (<1.2) PTT , s (26 –36) Bilirubin μmol/l (<17) Protein g/l (65 –82) Albumin g/l (35 –52) Ceruloplasmin ng/l (200 –600) ASA T , U/l (<52) ALA T , U/l (<50) GGT , U/l (<66) AP , U/l (<104) T ransferrin, μmol/l (25 –50) Ferritin, μg/l (30 –400) Creatinine, μmol/l (70 –105) Cirrhosis group Mean 1 10.59 74.94 1.29 36.44 54.71 73.70 34.65 275.38 84.00 72.68 156.12 180.94 28.60 218.62 84.85 ±SD 72.40 22.91 0.45 10.74 59.03 10.61 6.70 98.25 71.57 76.29 227.81 162.58 7.10 186.40 22.04 Control group Mean 252.67 101.06 0.95 27.00 9.13 71.00 43.55 301.33 23.06 23.47 39.62 72.47 28.25 181.50 77.17 ±SD 58.69 5.27 0.06 2.00 5.32 4.18 4.16 95.30 5.73 12.77 40.13 32.73 2.87 220.23 13.94 T able 2 Overview of the frequency distribution of the image quality score within the first 30 min after administration of Gd-EOB-DTP A in patients with liver cirrhosis and in individuals with normal liver parenchyma Time after intravenous administration of Gd-EOB-DTP A 10 min 20 min 30 min Cirrhosis group (n = 40) Control group (n = 20) Cirrhosis group (n = 40) Control group (n = 20) Cirrhosis group (n = 40) Control group (P = 20) Grade of visualization a 0 1 2 0 1 2 01 20 1 2 0 120 1 2 Common bile duct 28(70) 7(18) 5 (13) 2(10) 13(65) 5(25) 15(38) 9(23) 16(40) 0(0) 0(0) 20(100) 13(33) 1 1(28) 16(40) 0(0) 6(30) 14(70) Cystic duct b 33(92) 2(6) 1(3) 10(50) 8(40) 2(10) 21(58) 7(19) 8(22) 5 (25) 5(25) 10(50) 18(50) 10(28) 8(22) 4 (20) 4(20) 12(60) Gallbladder b 35(97) 1(3) 0(0) 10(50) 10(50) 0(0) 24(67) 10(28) 2(6) 4(20) 15(75) 1(5) 21(58) 13(36) 2(6) 2(10) 15(75) 3(15) Common hepatic duct 25(63) 7(18) 8(20) 1(5) 7(35) 12(60) 12(30) 6(15) 22(55) 0(0) 0(0) 20(100) 9(23) 7(18) 24(60) 0(0) 2(10) 18(90) Right hepatic duct 24(60) 10(25) 6(15) 1(5) 2(10) 17(85) 12(30) 8(20) 20(50) 0(0) 0(0) 20(100) 12(30) 6(15) 22(55) 0(0) 3(15) 17(85) Left hepatic duct 27(68) 6(15) 7(18) 3(15) 8(40) 9(45) 13(33) 6(15) 21(53) 0(0) 0(0) 20(100) 1 1(28) 6(15) 23(58) 0(0) 3(15) 17(85) Second order division ducts 31(78) 8(20) 1(3) 5(25) 9(45) 6(30) 19(48) 7(18) 14(35) 3(15) 7(35) 10(50) 16(40) 6(15) 18(45) 3(15) 8(40) 9(45) Numbers represent individuals; numbers in par entheses represent percentages a Grade 0 = no visualization; grade 1 = low visualization; grade 2 = good visualization b In 4/40 patients (10%) of the cirrhosis group a cholecystectomy had been performed before MR imaging
Results
There were no statistically significant differences in terms of age and gender between the cirrhosis and the control group.
Liver-function parameters
The mean values ± standard deviation of the serum
parameters in both patients groups are listed in Table1.
The serum parameters of the control group were all within a normal range. There were significant differences between both groups regarding platelet count (P<0.001), quick PT (P<0.001), INR (P<0.001), PTT (P=0.032), total bilirubin (P<0.001), albumin (P=0.001), ASAT (P<0.001), ALAT (P=0.007), GGT (P=0.02), and AP (P=0.001).
The mean MELD score ± standard deviation in the cirrhosis group was 12.4±5.86. The theoretical mean MELD score ± standard deviation in the control group was 6.3±0.57. This difference was highly statistically signif-icant (P<0.001).
Visualization of the bile ducts
The frequency distribution of the grade of visualization of each evaluated part of the biliary tree, in both groups 10, 20, and 30 min after intravenous administration of
Gd-EOB-DTPA, is displayed in Table2.
The frequency distribution of the grade of visualization was statistically significantly different for each of the
evaluated biliary structures 10, 20 and 30 min after administration of contrast medium, when comparing the cirrhosis with the control group (P=0.004 to <0.001). The visualization of each of the evaluated biliary structures was graded with a lower score in the cirrhosis group compared with the control group.
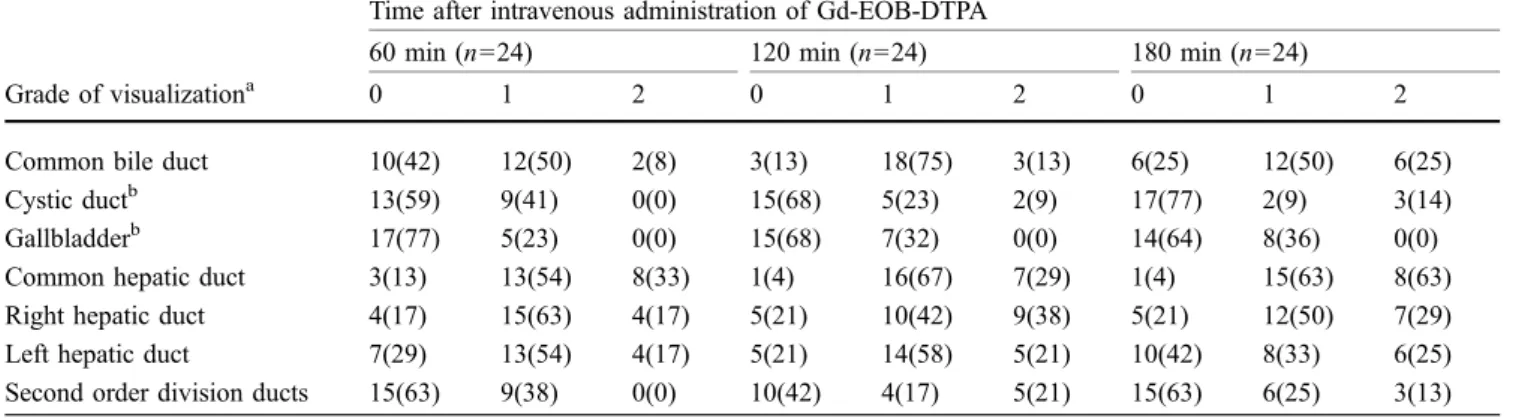
The frequency distribution of the grade of visualization of each of the evaluated parts of the biliary tree in the 24 cirrhotic patients, where additional imaging was required after 60, 120 and 180 min of application of
Gd-EOB-DTPA, is displayed in Table3.
Only 16/40 patients (40%) from the cirrhosis group reached sufficient visualization of the biliary tree for anatomical diagnosis within 30 min after application of
Gd-EOB-DTPA (Fig. 1), whereas the visualization of the
biliary tree was rated sufficient in 20/20 individuals (100%) from the control group after 20 min and in
14/20 individuals (70%) after 30 min (Fig. 2). The
24/40 patients (60%) from the cirrhosis group with insufficient overall visualization of the biliary tree for anatomical diagnosis within 30 min after contrast administration were followed up to 180 min. Only five of these 24 patients (21%) had a sufficient visualization of the biliary tree at a later time point (in two patients 60 min and in three patients 180 min after contrast application). In the remaining 19/24 patients (79%), the visualization of the biliary system remained insufficient for anatomical diagnosis, even up to 180 min after
contrast administration (Figs. 3, 4). This means that in
19/40 patients (48%) sufficient visualization of the biliary tree for anatomical diagnosis was not reached even up to 180 min after i.v. administration of Gd-EOB-DTPA.
Table 3 Overview of the frequency distribution of the image quality score 60, 120 and 180 min after administration of Gd-EOB-DTPA in patients with liver cirrhosis and non-sufficient
visualiza-tion of the biliary tree, within the 30 minutes after administravisualiza-tion of Gd-EOB-DTPA
Time after intravenous administration of Gd-EOB-DTPA
60 min (n=24) 120 min (n=24) 180 min (n=24)
Grade of visualizationa 0 1 2 0 1 2 0 1 2
Common bile duct 10(42) 12(50) 2(8) 3(13) 18(75) 3(13) 6(25) 12(50) 6(25)
Cystic ductb 13(59) 9(41) 0(0) 15(68) 5(23) 2(9) 17(77) 2(9) 3(14)
Gallbladderb 17(77) 5(23) 0(0) 15(68) 7(32) 0(0) 14(64) 8(36) 0(0)
Common hepatic duct 3(13) 13(54) 8(33) 1(4) 16(67) 7(29) 1(4) 15(63) 8(63)
Right hepatic duct 4(17) 15(63) 4(17) 5(21) 10(42) 9(38) 5(21) 12(50) 7(29)
Left hepatic duct 7(29) 13(54) 4(17) 5(21) 14(58) 5(21) 10(42) 8(33) 6(25)
Second order division ducts 15(63) 9(38) 0(0) 10(42) 4(17) 5(21) 15(63) 6(25) 3(13)
Numbers represent individuals; numbers in parentheses represent percentages a
Grade 0 = no visualization; grade 1 = low visualization; grade 2 = good visualization b
The effect of liver function on biliary visualization In the cirrhosis group, patients with insufficient biliary tree visualization for anatomical diagnosis 20 and 30 min after contrast application had a significant higher INR (P= 0.015/0.041), PTT (P=0.005/0.046), and total bilirubin
(P≤0.001) compared with patients with sufficient biliary
tree visualitzation. The other tested laboratory findings did not show statistically significant difference. Analysis of the
ROC curves (Figs. 5 and6) revealed a cut-off value for
total bilirubin ≥30 μmol/l / ≥1.8 mg/dl (sensitivity 0.75,
specificity 0.93, area under the curve 0.85) for insufficient visualization of the biliary tree for anatomical diagnosis 20 min after contrast application. In the cirrhosis group, patients with insufficient biliary tree visualization for anatomical diagnosis 20 and 30 minutes after contrast
application had a significant higher MELD score (P≤
0.001) compared to patients with sufficient biliary tree Fig. 1a–f EOB-MRC on a 51-year-old man with histologically
proven hepatitis C liver cirrhosis (MELD score 10, total bilirubin 20 μmol/l / 1.2 mg/dl). Fat-suppressed 3D T1-weighted GRE images (3.1/1.4, 15° flip angle) in the coronal (a–c) and transaxial plane (d–f) demonstrate the excretion of Gd-EOB-DTPA over time. After 10 min (a, d) no enhancement (grade 0) of any of the
evaluated biliary structures is visible. Following 20 (b, e) and 30 min (c, f) the common bile duct (small arrow), common hepatic duct (large arrow), left and right hepatic ducts (arrowheads) are well visualized (grade 2). Hence, the visualization of the biliary tree was rated as sufficient for anatomical diagnosis
Fig. 2a–c EOB-MRC on a 34-year-old man with normal liver function. Fat-suppressed 3D T1-weighted GRE images (3.1/1.4, 15° flip angle) in the coronal plane show a sufficient overall visualiza-tion of the biliary tree 10 (a), 20 (b), and 30 (c) min after applicavisualiza-tion
of Gd-EOB-DTPA. This means that the visualization of the common bile duct (small arrow), common hepatic duct (large arrow) and the left and right hepatic ducts (arrowheads) was rated as good (grade 2) at the same time point
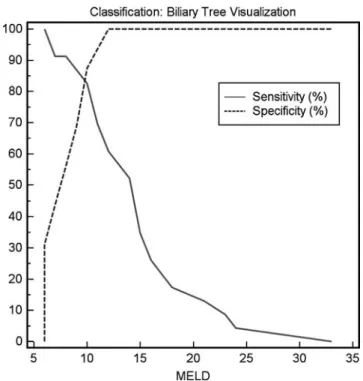
visualization. Analysis of the ROC curves (Figs.5and7),
revealed a cut-off MELD score of ≥11 (sensitivity 0.79,
specificity 0.86, area under the curve 0.87) for insufficient visualization of the biliary tree for anatomical diagnosis 20 min after contrast application.
In the cirrhosis group, the comparison between the degree of visualization of the biliary tree and the Child-Pugh class revealed no statistical significance.
Discussion
Recent studies have shown the utility of contrast-enhanced MRC especially in visualizing non-dilatated bile ducts (e.g., in living liver donors) and biliary leaks [4, 5, 11]. Currently, three different hepatobiliary
contrast agents are available for contrast-enhanced
MRC: mangafodipir trisodium (Mn-DPDP; Teslascan; GE Healthcare, Oslo, Norway), gadobenate dimeglumine (Gd-BOPTA; MultiHance, Bracco Imaging, Milan, Italy), and gadolinium-ethoxybenzyl-diethylenetriamine pentaace-tic acid (Gd-EOB-DTPA, gadoxepentaace-tic acid; Primovist, Bayer Schering Pharma, Berlin, Germany).
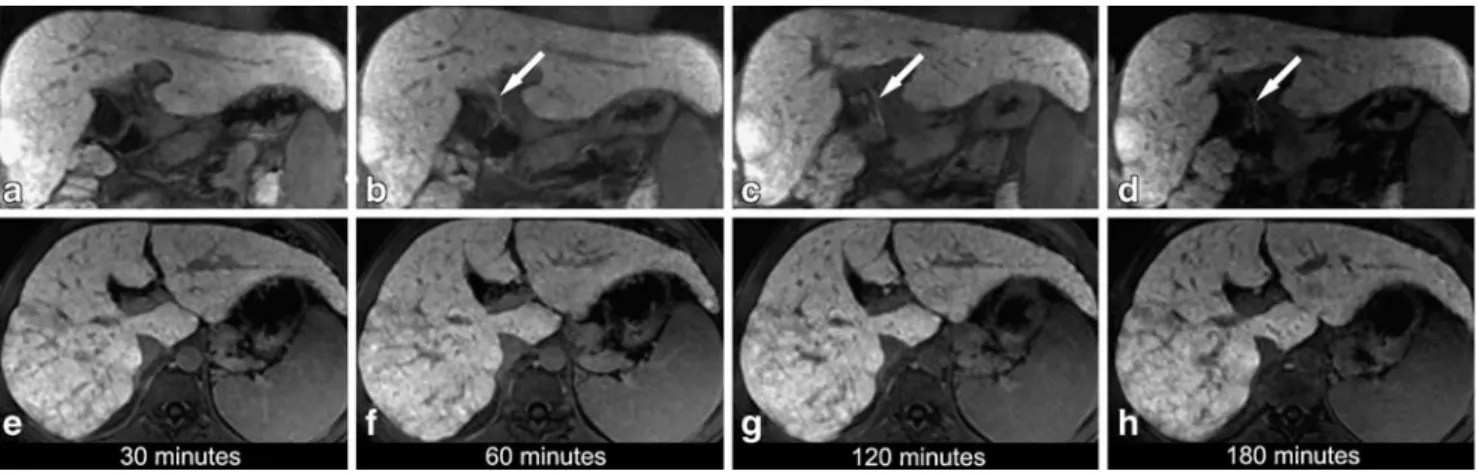
When Gd-EOB-DTPA is injected intravenously, the contrast agent is incorporated into the hepatocytes by an anionic transport system after the vascular phase. For the intracellular transport of Gd-EOB-DTPA glutathione-S-transferase has been identified as transport protein [7]. The excretion into the biliary tract is also mediated by the glutathione-S-transferase transport system. It has been demonstrated that both bilirubin as well as Gd-EOB-DTPA have a high affinity for the same hepatocellular receptor glutathione-S-transferase [7]. Analysis of pharmacokinetic results in a clinical phase-I trial, demonstrated that Gd-Fig. 3a–h EOB-MRC on a 42-year-old male patient with
histo-logically proven liver cirrhosis (MELD score 12, total bilirubin 68μmol/l / 4mg/dl). Fat-suppressed 3D T1-weighted GRE images (3.1/1.4, 15° flip angle) in the coronal (a–d) and transaxial plane (e– h) were obtained over time following administration of Gd-EOB-DTPA. Thirty minutes after Gd-EOB-DTPA administration no enhancement of the biliary structures is noted neither in the coronal
(a) nor in the transaxial plane (e). After 60 (b, f), 120 (c, g) and 180 (d, h) min only the common hepatic duct (arrow) is visualized (grade 2, at 120 min; grade 1, at 60 and 180 min). There is no enhancement of other biliary structures at any of the time points, resulting in a non-sufficient overall visualization of the biliary tree at all time points
Fig. 4 Coronal (a) and transaxial (b) fat-suppressed 3D T1-weighted GRE images (3.1/1.4, 15° flip angle) obtained 180 min following Gd-EOB-DTPA administration in a 55-year-old male patient with histologically proven liver cirrhosis and decreased liver
function (MELD score 18, total bilirubin 158μmol/l / 9.2 mg/dl). No enhancement of the biliary structures is noted at this time point as well as at the earlier time points (not shown)
EOB-DTPA was eliminated non-metabolized in approxi-mately equal proportions by hepatobiliary excretion and glomerular filtration [9].
In an in-vivo phase-I clinical evaluation performed in 16 healthy volunteers receiving different doses of Gd-EOB-DTPA, Bollow et al. [7] showed an intense signal
enhancement of the common bile duct beginning 5–16 min
after contrast application. Carlos et al. [8] showed that a 20-min delay after Gd-EOB-DTPA administration was sufficient for adequate biliary visualization in 16 patients with known hepatic masses. Hamm et al. [9] demonstrated common bile duct enhancement within 10 min after injection of Gd-EOB-DTPA. All these studies were performed in patients with functionally unimpaired liver parenchyma. Our results of the control group are in accordance with these above-mentioned studies. In all individuals of the control group, the quality of the EOB-MRC was rated sufficient for anatomical diagnosis after 20 min.
To the best of our knowledge, this study has shown for the first time that the time elapsed between intravenous administration of Gd-EOB-DTPA and visualization of the biliary ducts is different in a substantial percentage of patients with liver cirrhosis compared with the visualiza-tion of the bile ducts in non-cirrhotic liver parenchyma. Only 16/40 patients of the cirrhosis group (40%) showed an overall sufficient MRC image quality for anatomical diagnosis within 30 min of contrast application. Even if the Fig. 5 ROC curves illustrate the relationship between the
visual-ization of the biliary tree 20 min after Gd-EOB-DTPA application and the MELD score (area under the curve 0.87), as well as the total serum bilirubin (area under the curve 0.85)
Fig. 6 Graphs illustrating the sensitivity and specificity of the corresponding bilirubin value according to a good biliary tree visualization. Note the decrease of the sensitivity at corresponding bilirubin levels≥30 μmol/l
Fig. 7 Graphs illustrating the sensitivity and specificity of the corresponding MELD score according to a good biliary tree visualization. Based on the highest possible sensitivity and speci-ficity, a cut-off MELD score≥11 was defined above which effective biliary visualization should not be expected
window between Gd-EOB-DTPA injection and acquisition of MR imaging was prolonged up to 180 min, overall visualization of the biliary tree could be obtained only in 21/40 patients (53%). The reason for this difference in dynamics and extent of biliary excretion of Gd-EOB-DTPA in cirrhotic and in non-cirrhotic livers is most likely due to the differences in liver function. Since the transport into the bile ducts of both Gd-EOB-DTPA and (conjugated and unconju-gated) bilirubin is mediated by glutathione-S-transferase proteins, this may explain these findings. In addition, in advanced liver cirrhosis the number of functioning hepa-tocytes is reduced, thus causing the capacity for the excretion of bilirubin and Gd-EOB-DTPA to be reduced. In these cases most of Gd-EOB-DTPA is probably excreted via the kidneys because the renal and hepatic excretions are competing excretion mechanisms [9].
In our study, comparison of various laboratory findings and the MELD score representing liver function and the grade of visualization of the biliary ducts revealed statistical significance. In cirrhotic patients with a MELD
score≥11 and/or a total serum bilirubin level ≥30 μmol/l
(≥1.8 mg/dl), the likelihood to achieve a contrast-enhanced
MRC sufficient for displaying the biliary tree morphology is low. This means, for practical purposes, that EOB-MRC can not be recommended in these patients.
On the other hand, a diminished liver function can be suspected in patients with a reduced or lacking visualiza-tion of the biliary tree 20 and 30 min after applicavisualiza-tion of Gd-EOB-DTPA (in the absence of a biliary obstruction). This is supported by the study of Ryeom et al. [12] who were able to evaluate liver function quantitatively with EOB-DTPA-enhanced MR imaging calculating the Gd-EOB-DTPA hepatic extraction fraction.
The fact that we could not find a statistical significance comparing the Child-Pugh class and the visualization of the biliary tree may be explained by the fact that the Child-Pugh class is less precise and more examiner-dependent compared with the MELD score (subjective quantification of ascites and encephalopathy in the Child-Pugh classifi-cation). Additionally, recent publications emphasize the superiority of the MELD scale compared with the Child-Pugh classification in predicting the 3-month mortality
among patients with chronic liver disease [13,14].
We acknowledge the following limitations. In our study we included only patients with liver cirrhosis and impaired liver function, but we had no patients with liver dysfunc-tion in the absence of a cirrhotic liver. However, patients with liver cirrhosis represent the majority of patients with liver dysfunction in a clinical setting. Another limitation might be related to the fact that the number of patients in both groups was relatively small and that we had no histological proof that the liver parenchyma of the individuals in the control group was normal. Because we performed a consensus read-out, the lack of the degree of interobserver agreement may represent another study limitation.
In this study we focused on the ability of Gd-EOB-DTPA to visualize the biliary tree for morphological information. However, we did not appreciate the property of Gd-EOB-DTPA to provide functional information.
In conclusion, the present study has shown that patients with liver cirrhosis have delayed excretion of the hepato-biliary contrast agent Gd-EOB-DTPA compared to in-dividuals with normal liver parenchyma. This results in an inferior or even insufficient enhancement of the biliary tree in a substantial percentage of cirrhotic patients.
References
1. An SK, Lee JM, Suh KS, Lee NJ, Kim SH, Kim YJ, Han JK, Choi BI (2006) Gadobenate dimeglumine-enhanced liver MRI as the sole preoperative imaging technique: a prospective study of living liver donors. AJR Am J Roentgenol 187:1223–1233 2. Carlos RC, Hussain HK, Song JH,
Francis IR (2002) Gadolinium-ethoxybenzyl-diethylenetriamine pen-taacetic acid as an intrabiliary contrast agent: preliminary assessment. AJR Am J Roentgenol 179:87–92
3. Lee VS, Krinsky GA, Nazzaro CA, Chang JS, Babb JS, Lin JC, Morgan GR, Teperman LW (2004) Defining intrahepatic biliary anatomy in living liver transplant donor candidates at mangafodipir trisodium-enhanced MR cholangiography versus conventional T2-weighted MR cholangiography. Radiology 233:659–666
4. Pilleul F, Billaud Y, Gautier G, Monneuse O, Crombe-Ternamian A, Fouque P, Valette PJ (2004) Mangafodipir-enhanced magnetic resonance cholangi-ography for the diagnosis of bile duct leaks. Gastrointest Endosc 59:818–822
5. Vitellas KM, El-Dieb A, Vaswani KK, Bennett WF, Fromkes J, Ellison C, Bova JG (2002) Using contrast-en-hanced MR cholangiography with IV mangafodipir trisodium (Teslascan) to evaluate bile duct leaks after cholecys-tectomy: a prospective study of 11 patients. AJR Am J Roentgenol 179:409–416
6. Aduna M, Larena JA, Martin D, Martinez-Guerenu B, Aguirre I, Astigarraga E (2005) Bile duct leaks after laparoscopic cholecystectomy: value of contrast-enhanced MRCP. Abdom
7. Bollow M, Taupitz M, Hamm B, Staks T, Wolf KJ, Weinmann HJ (1997) Gadolinium-ethoxybenzyl-DTPA as a hepatobiliary contrast agent for use in MR cholangiography: results of an in vivo phase-I clinical evaluation. Eur Radiol 7:126–132
8. Carlos RC, Branam JD, Dong Q, Hussain HK, Francis IR (2002) Biliary imaging with Gd-EOB-DTPA: is a 20-minute delay sufficient? Acad Radiol 9:1322–1325
9. Hamm B, Staks T, Muhler A, Bollow M, Taupitz M, Frenzel T, Wolf KJ, Weinmann HJ, Lange L (1995) Phase I clinical evaluation of Gd-EOB-DTPA as a hepatobiliary MR contrast agent: safety, pharmacokinetics, and MR im-aging. Radiology 195:785–792 10. Mazzaferro V, Regalia E, Doci R,
Andreola S, Pulvirenti A, Bozzetti F, Montalto F, Ammatuna M, Morabito A, Gennari L (1996) Liver transplantation for the treatment of small hepatocellular carcinomas in patients with cirrhosis. N Engl J Med 334:693–699
11. Lee VS, Rofsky NM, Morgan GR, Teperman LW, Krinsky GA, Berman P, Weinreb JC (2001) Volumetric manga-fodipir trisodium-enhanced cholangi-ography to define intrahepatic biliary anatomy. AJR Am J Roentgenol 176:906–908
12. Ryeom HK, Kim SH, Kim JY, Kim HJ, Lee JM, Chang YM, Kim YS, Kang DS (2004) Quantitative evaluation of liver function with MRI Using
Gd-EOB-DTPA. Korean J Radiol 5:231–239
13. Wiesner R, Edwards E, Freeman R, Harper A, Kim R, Kamath P, Kremers W, Lake J, Howard T, Merion RM, Wolfe RA, Krom R (2003) Model for end-stage liver disease (MELD) and allocation of donor livers. Gastroenter-ology 124:91–96
14. Kamath PS, Wiesner RH, Malinchoc M, Kremers W, Therneau TM, Kosberg CL, D’Amico G, Dickson ER, Kim WR (2001) A model to predict survival in patients with end-stage liver disease. Hepatology 33:464–470