HAL Id: hal-00849356
https://hal.archives-ouvertes.fr/hal-00849356
Submitted on 30 Jul 2013HAL is a multi-disciplinary open access archive for the deposit and dissemination of sci-entific research documents, whether they are pub-lished or not. The documents may come from teaching and research institutions in France or abroad, or from public or private research centers.
L’archive ouverte pluridisciplinaire HAL, est destinée au dépôt et à la diffusion de documents scientifiques de niveau recherche, publiés ou non, émanant des établissements d’enseignement et de recherche français ou étrangers, des laboratoires publics ou privés.
Cellular response to heat shock studied by multiconfocal
fluorescence correlation spectroscopy.
Meike Kloster-Landsberg, Gaëtan Herbomel, Irène Wang, Jacques Derouard,
Claire Vourc’H, Yves Usson, Catherine Souchier, Antoine Delon
To cite this version:
Meike Kloster-Landsberg, Gaëtan Herbomel, Irène Wang, Jacques Derouard, Claire Vourc’H, et al.. Cellular response to heat shock studied by multiconfocal fluorescence correlation spectroscopy.. Bio-physical Journal, BioBio-physical Society, 2012, 103 (6), pp.1110-9. �10.1016/j.bpj.2012.07.041�. �hal-00849356�
Running head: multiconfocal FCS study of heat shock response
---
Cellular response to heat shock studied by multiconfocal Fluorescence Correlation Spectroscopy
Meike Kloster-Landsberg,† Gaëtan Herbomel,‡ Irène Wang,† Jacques Derouard,† Claire Vourc’h,‡ Yves Usson,§ Catherine Souchier,‡ and Antoine Delon†*
†Univ. Grenoble 1 / CNRS, LIPhy UMR 5588, Grenoble, F-38041, France
‡Univ. Grenoble 1 / INSERM, IAB CRI U823 team 10, Grenoble, F-38042, France §Univ. Grenoble I / CNRS, TIMC-IMAG UMR5525, Grenoble, F-38706, France
ABSTRACT
Heat shock triggers a transient and ubiquitous response, the function of which is to protect cells against stress-induced damages. The heat shock response is controlled by a key transcription factor known as Heat Shock Factor 1 (HSF1). We developed a multiconfocal Fluorescence Correlation Spectroscopy (mFCS) set-up to measure the dynamics of HSF1 during the course of
the heat shock response. The system combines a Spatial Light Modulator to address several
points of interest and an EMCCD camera for fast multi-confocal recording of the photon streams. Autocorrelations curves with a temporal resolution of 14 µs, have been analyzed, before and after heat shock on eGFP and HSF1-eGFP expressing cells. The dynamic parameters of a diffusion and binding model have been evaluated and showed a slower HSF1 diffusion after heat shock. It is also observed that the dissociation rate decreases after heat shock, while the association one is not affected. In addition, thanks to the mFCS system, up to five spots could be simultaneously located in each cell nucleus. This made it possible to quantify the intracellular variability of the diffusion constant of HSF1, which is higher than that of inert eGFP molecules and which increases after heat shock. This finding is consistent with the fact that heat shock response is associated with an increase of HSF1 interactions with DNA and cannot be explained even partially by heat-induced modifications of nuclear organization.
INTRODUCTION
The cellular environment is a highly heterogeneous and crowded medium, which exhibits fast spatial and temporal changes. For this reason, it is important to develop Fluorescence Fluctuation Microscopy (FFM) methods that enable simultaneous measurements of dynamics at different locations within a living cell. Not only would such methods provide more complete information about the cellular machinery, but also, by performing a large number of measurements in parallel, one can obtain statistically significant results and assess cellular variability in a more time-efficient way.
Among the recent developments in FFM, three families can be distinguished: temporal Image Correlation Spectroscopy and especially Raster Image Correlation Spectroscopy (RICS) that exploit the information implicitly embedded in confocal images recorded under various modalities; scanning Fluorescence Correlation Spectroscopy (sFCS), where Autocorrelation Function (ACF) curves are constructed with repeated scans of the same 1D zone (usually linear or circular); multipoint or multi-confocal FCS techniques that utilize multiple laser spots (mFCS).
The RICS modality originates from Image Correlation Spectroscopy (1-3). In its more recent developments (4-7), it is possible to measure correlation between pixels, lines and frames, in order to provide dynamic information at various temporal and spatial scales. The price to pay is the need for a rather large ROI in order to extract correlation functions of good quality. Rather than using a laser scanning microscope, it is also possible to acquire a wide field image with a fast and sensitive camera (e.g. an Electron-Multiplying Charge-Coupled Device EMCCD), provided optical sectioning is completed in situ. A first possibility is given by total internal reflection fluorescence microscopy (8), a second one by light-sheet illumination (9). A general bottleneck of these two later methods is that, the larger the field of view, the slower the temporal resolution, which is a direct consequence of CCD technology.
It might appear smarter, when acquiring FCS, to scan only the ROI, but along a chosen laser trajectory (10, 11). This technique, called sFCS, has been applied with various modalities (12-17). However, here also there is a compromise between the temporal resolution, the spatial resolution and the spatial extension. Since only one laser spot is used at a time, one cannot get independent measurements at different points arbitrary located within the ROI, with the temporal resolution of single point FCS.
To solve this technical bottleneck, it is necessary to develop optical systems that provide separated laser spots with flexible locations in the field of view. Such possibilities are offered by the dual head confocal microscope approach, since it makes it possible to either, place two laser spots anywhere in the field of view, with the ultimate temporal resolution of a standard FCS microscope, or to perform sFCS acquisitions (18). To go beyond, spinning disk confocal microscopes are promising ways to flexibly address numerous laser spots (up to ~ 104) within the ROI (19, 20). However, one often encounters the limitations of spinning disk systems, in terms of temporal resolution. There is nevertheless one multiple spot technique that is capable of probing fast time scales (down to 20 µs) at hundreds of different locations, simultaneously in the sample, namely Time-Integrated Multipoint Moment Analysis (21). It benefits from the possibility to vary the exposure times down to very short values, even using the full area of the CCD chip. Although quite promising, this approach is, technically speaking, rather hard to implement and needs to be made more user-friendly.
Therefore we believe that there is still a need for a multi-confocal FCS (hereafter called mFCS) system for living cell studies, which would involve:
i) a flexible way to address, simultaneously, the desired laser spots at various locations within the biological specimen;
ii) a matrix of fast, point-like detectors.
Concerning the excitation path, Spatial Light Modulators (SLM) are now used for microscopy applications, mainly for optical tweezers (22) and adaptive optics, to control the laser illumination geometry. We have recently demonstrated the potential of SLM for mFCS by measuring, at the single particle level, both active transport (i.e. a flow) and passive transport (in that case, permeability through a phospholipidic membrane) (23). Concerning the detection path, EMCCD cameras are especially promising, since each pixel is a single photon point-like detector (24-26), while the on-chip amplification makes it compatible with a fast read-out rate (10 MHz) and a high signal to noise ratio. It is nevertheless worthwhile to mention the Complementary Metal Oxide Semi-conductor - Single Photon Avalanche Diode (CMOS-SPAD) cameras that combine the sensitivity of EMCCD and the frame rate of CMOS architecture (27).
Hereafter, we report recent results obtained with a mFCS system built by combining a SLM to address several points of interest and an EMCCD camera for fast multi-confocal recording of the corresponding photon streams with a time resolution of 14 µs. Compared to our previously published proof of concept (28), this article presents an experimental set-up which time resolution is improved by a factor of 7, thanks to a special readout mode of a single row. Progress has also been made in acquisition speed, epi-fluorescence illumination, user interface and spot positioning, so that the experiment is now truly suitable for biological studies in living cells.
This device was used to analyze the dynamics of the Heat Shock Factor 1 (HSF1) in living cells. The heat shock response is characterized by two contrasting phenomena: the activation of heat shock (hsp) genes on one hand and the global repression of most cellular genes, on the other hand. Both events correlate with important structural modification of chromatin organization and structure (29). HSF1 is the key transcription factor of the heat shock response (30,31) controlling heat-induced genome-wide chromatin remodeling events. Upon heat shock, HSF1 is rapidly converted into an active form, trimerizes and acquires its DNA binding capacity to heat shock elements (HSE) present within hsp gene promoters. The way HSF1 represses global gene expression is still unclear and seems to involve its DNA binding capacity and/or its transient interactions with repressive complexes (29). In this context, we sought to determine the dynamics of HSF1 in order to evaluate the DNA binding capacity of HSF1 in unstressed and stressed living cells. Moreover, since heat shock is known to induce major modification of nuclear structure, data obtained on HSF1 were compared to data obtained on eGFP molecules with no DNA binding competency, to distinguish structure-related from interaction changes. Diffusion and DNA binding of transcription factors are coupled processes which occur on extended time scales, from tens of µs to tens of min. The simplest representation of this complex mechanism assumes a pool of free diffusing molecules, interacting with fixed binding sites. The question therefore arises as to which factors are affected by the heat shock response: diffusion, association or dissociation rates? In addition, are these quantities homogeneously distributed within the nucleus, thus meaning that they are dominated by numerous relatively non-specific interactions, or, conversely are they rather inhomogeneous, because of a limited number of more specific binding sites? Also, are these distributions modified during heat shock response?
Using the mFCS system, heat shock was induced under the microscope and parallel acquisitions in five nuclear spots were performed, allowing an analysis of intranuclear variability in a short enough time, thus making possible a reliable study of the spatial distribution of the
dynamics. Compared to single point FCS, our method not only reduces significantly the total acquisition time, but avoids any entanglement between spatial and temporal variations.
In the following, we first present the experimental device in the Material and Methods section. To characterize the system, mFCS measurements were performed with fluorescent dye solutions, as reported in the Experimental Results section. Then, the results obtained on the dynamics of eGFP and HSF1-eGFP in living cells are presented.
MATERIAL AND METHODS Dye solutions
FCS and mFCS measurements in solution were performed using Rhodamine 6G (Radiant Dyes, Wermelskirchen, Germany) and Dextran-Rhodamine Green 10 kDa (Life Technologies, Grand Island, NY). In order to avoid aggregation, Dextran-Rhodamine Green molecules were prepared in buffer solution at pH 8.2. These molecules were used without further purification and diluted at concentrations from a few tens of nM to 1100 nM. Purified recombinant eGFP protein was also used (Clontech, Mountain View, CA).
Cell culture
Human brain glioblastoma U87 cells were cultured in Dulbecco’s modified Eagle’s medium (DMEM, PAA, Pashing, Austria) supplemented with 10% fetal calf serum, 2% glutamine (4mM) and 1% non essential amino acids, in 5% CO2 atmosphere at 37°C. Cells were transfected with reporter plasmids expressing the human HSF1-eGFP “Green Fluorescent Protein” with LipofectamineTM 2000 transfection reagent (Life Technologies, NY, USA). Stable
HSF1-eGFP cell lines were established using geneticin and flow cell sorting system (FACSAria, Beckton Dickinson, San Jose, CA, USA) for selecting transfected cells expressing a low level of HSF1-eGFP adapted for FCS. Stable Hela cell line expressing only the eGFP protein was also used. Two days before the experiments, cells were plated on culture dishes (Bioptechs,PA, USA). Data acquisitions under microscope were performed in DMEN medium without phenol red supplemented with 1% fetal calf serum, 2% glutamine and 10mM Hepes. Heat shock was performed at 43°C during 1h using a temperature control system including stage and objective control (Delta T, Bioptechs, PA, USA).
Multiconfocal FCS setup and data acquisition
The FCS measurements were performed on an improved version of a homebuilt setup (28), shown in Fig. S1 in the Supporting Material. A SLM is used to split the laser beam and create several excitation spots at freely chosen locations in the focal plane of the objective lens (Plan-Apo 60×, NA=1.2, Olympus). Fluorescence detection can be switched between an Avalanche PhotoDiode (APD) for single spot FCS measurements or an EMCCD (iXon+ DU860, Andor Technology) for parallel multi-spot measurements.
The phase map applied to the SLM is calculated using a spherical wave and superposition approach as previously described (28, 32). The principle of the algorithm is simple: we assume that each desired spot results from a converging spherical wave. Then the phase function is obtained from the back-propagation and superposition of the spherical wavefronts in the plane of the SLM. The corresponding details and Eq. (S2) are presented in the Supporting Material
For single spot FCS, the APD signal is processed by a home-made electronic counter, recorded using a data acquisition board and software correlated by a program developed in
Delphi (Borland), to provide the ACF. We also calculate the molecular brightness defined as the ratio of the count rate (in kHz) to the number of molecules, as obtained by fitting the ACF curve.
For mFCS, a software environment developed in Matlab (MathWorks, Natick, MA) controls the experiment and performs data acquisition and processing. The EMCCD camera was used in the Crop FvB (Full vertical Binning) readout mode, with all the spots aligned on the bottom row of the chip, so that a 70 kHz frame rate could be achieved, resulting in a 14 µs time resolution. More details on data acquisition and processing are given in the Supporting Material. ACF fit model
Among the numerous models of the ACFs that can be found in the literature, the choice of the best model to represent the dynamics of the detected molecules is a key point. In the present biological situation, we believe that the model called reaction dominant, derived by Michelman-Ribeiro et al., is the best choice (34). It stems from a general situation of equilibrium, where molecules with diffusion constant D can reversibly bind to an immobile substrate with a pseudo association rate, kon* (that incorporates the equilibrium concentration of vacant binding sites) and a dissociation rate, koff. In the simplified reaction dominant regime, the diffusion time across the confocal volume, τD = wr2/4D, is much shorter than the average time to associate with a binding site, i.e. τD << 1/kon*. As a consequence, the ACF, G(τ), can be decomposed to yield:
(
)
(
(
)
)
[
F
S
C
e
off]
N
G
eq D D eq τ ττ
τ
τ
τ
τ
)
1
1
1
11
2 1/2 /(
− − −+
+
+
+
=
(2)where N is the effective number of molecules in the FCS effective volume, S is the usual structure parameter (ratio of the longitudinal to the transverse radii of the confocal volume, S = wz/wr), τoff = koff-1 and: * 1 on off off eq eq k k k C F + = − = (3)
is the free fraction of molecules. Note that we did not include any triplet term in the ACF, because the temporal resolution of our set-up (14 µs) does not reach down to the characteristic time of triplet relaxation (33). Due to a superimposed oscillation appearing at very long lag times (1 s), we had to include in the model an additional temporal component to properly describe our experimental results. We could not unambiguously identify the physical origin of this artifact, but since it manifests as an oscillation superimposed on the ACF curves, we assumed that the detected signal, s(t), was amplitude modulated with a period T and a relative modulation depth a,
i.e.:
[
1 cos(2 )]
) ( ) (t =f t +a×π
t T+ϕ
s (4)where f(t) is the fluorescence signal that would be detected if there was no artifact, the ACF of which is given by Eq. 2. Consequently the ACF of the detected signal is:
(
)
⎥ ⎦ ⎤ ⎢ ⎣ ⎡ + =G a T Gs cos2 / 2 1 ) ( ) ( 2 πτ τ τ (5)Note that the phase ϕ does not appear in the ACF. Altogether, the adjusted parameters are: a, N,
Feq, τD and τoff (practically T was fixed to 1.8 s and S to 5).
Because T and τoff have close orders of magnitude, we statistically checked the fits and observed that there was no correlation between the oscillation parameter a and the residence time τoff, thus validating the meaning of the latter parameter.
Performances of EMCCD versus APD detection for FCS
The performance of the EMCCD camera as a detector for FCS was compared to the standard avalanche photodiode over a wide range of fluorophore concentrations and laser powers. We show in Fig. S4 that the EMCCD performance comes close to that of the APD. More detailed information can be found in the Supporting Material.
RESULTS AND DISCUSSION Measurements in solution
FCS calibration with single and multiple excitation spots
To characterize our multiconfocal FCS setup under controlled conditions, measurements in solution have been performed. All calibration measurements and corresponding data are presented in the Supporting Material. Only a synthetic summary is given below.
Single spot measurements have been performed to calibrate the FCS observation volume. Dextran-Rhodamine Green 10 kDa in water was chosen as a reference sample, since its large size and thereby slow diffusion is compatible with the time resolution of the EMCCD camera (14 µs). By comparing its residence time with that of Rhodamine 6G (using APD detection), we deduced the diffusion coefficient of Dextran-Rhodamine Green 10 kDa at 37°C DDext = 161 µm2/s. Then,
solutions of various concentrations were measured with both the APD and the EMCCD detector pathways. The observation volume was found to increase by approximately 30% for EMCCD in comparison to APD detection. We estimate the lateral dimension of the observation volume (assumed to be a 3D Gaussian) to wr = 0.251 µm, for the overall setup which combines the SLM (to generate a single spot) and the EMCCD. When the excitation spot is moved away from the optical axis, no significant enlargement of the observation volume is to be considered within a 10-µm radius from the center. All the excitation spots used in this work are within this range.
When several excitation spots are simultaneously generated by the SLM, we have not observed any change in the width of the effective volume compared to the single spot case. However, spurious values of the estimated number of molecules are obtained due to signal cross-talk between adjacent spots. The signal detected for each spot includes contributions from adjacent spots which create an unwanted background and result in an artificial increase of the estimated number of molecules. We corrected this effect by quantifying the contribution of different spots using a multipeak Lorentzian fit of the average fluorescence profile and subtracting the resulting background from the time trace before calculating the ACF. More details about calibration in solution and cross-talk correction are given in the Supporting Material (see in particular Fig. S5 for single spot measurements and Fig. S6 for multiple spots).
For all single spot measurements in solution, the laser power at the exit of the single-mode fiber was set to 80 µW. For multispot measurements (five spots), the total laser power was set to 500 µW (that approximately corresponds to 80 µW per spot, taking into account the non-diffracted light). The spots were never located regularly, to avoid additional phantom spots.
Besides characterization purposes, measurements in solution are routinely performed to check the optical alignment: prior to each experiment on cells, a Dextran-Rhodamine Green solution is measured with the same spot series as in the forthcoming cell acquisitions.
Diffusion of eGFP in aqueous solution
To compare with eGFP behavior in living cells which will be subsequently studied, we have determined the diffusion coefficient and brightness of eGFP in solution at various temperatures ranging from 25°C to 43°C to investigate the temperature-dependent changes that may affect our measurements in cells. We used a single SLM-generated spot and the APD as detector. The ACF curves were fitted with a one-component diffusion model. The resulting diffusion time varied from 94 µs at 25°C to 63 µs at 43°C. Using the previously determined width of the observation volume (wr = 0.211 µm), we can deduce the following diffusion coefficient: D25°C = 119 µm2/s to D43°C = 177 µm2/s (with D37°C = 155 µm2/s at 37°C). Fig. S7 shows the diffusion coefficient variation over the entire temperature range, together with the expected variation calculated from the change in water viscosity. A good correlation is found, indicating an absence of eGFP conformational changes in this temperature range. The resulting diffusion coefficient is in reasonable agreement with previously published values: it is 14% higher than the value obtained by sFCS (35) when the temperature correction is applied. Concerning eGFP brightness, although we observed a distinct reduction of the brightness when the temperature increases from 25°C to 43°C, only a slight decrease (approximately 11 %) occurs between 37°C and 43°C.
eGFP experiments in living cells
Measurement protocol with living cells
Hela cells stably expressing eGFP have been used to control our experimental mFCS protocol in living cells. This protocol consists in performing mFCS measurements on five cells per culture dish, while typically three dishes were observed during one day of experiments. The laser power at the exit of the single-mode fiber was limited to 120 µW, a compromise between photobleaching and signal over noise ratio of the ACF curves. Before starting a series of acquisitions on a culture dish, five laser spots were created with the SLM and were automatically aligned on the pixels of the EMCCD camera. These spots are irregularly distributed along a line, with a mean distance of 3∼4 µm. A sample of Dextran-Rhodamine Green was systematically used before and after each culture dish measurement (that took about 2 hours) to verify the middle term stability of the set-up. Five cells were consecutively selected and measured at 37°C, with the nucleus in focus, then heat-shocked during 1 hour to be imaged and measured again at 43°C. We always performed two measurements per cell, which consists in recording five acquisitions of 10 s (plus an acquisition without laser for offset correction, see Supporting Material) and averaging their ACFs. Between the two measurements, the positions of the five spots are shifted within the cell. To verify that our results were not biased by the slight variability of the laser spot intensities and focusing, we looked for correlations between the diffusion times of the spots in the reference Dextran-Rhodamine Green solution and those measured afterwards in the cells. We never found such correlation, indicating that systematic differences between spots are negligible and that the
intracellular variability of the estimated parameters is much higher than their instrumental noise. Altogether, the Hela-eGFP campaign of measurements provided 150 averaged ACF curves for each temperature, among which 10 curves were rejected, because the corresponding laser spots were not properly located in the cell and gave unusable ACFs. The majority of the spots were located in the nucleus, the remaining being mostly in the cytoplasm and only few of them in the nucleoli. The 280 retained ACF curves could be properly fitted with the standard 3D free diffusion model (which corresponds to Eq. 2 by setting Feq = 1).
Only the brightness of the inert eGFP molecules is affected by heat-shock
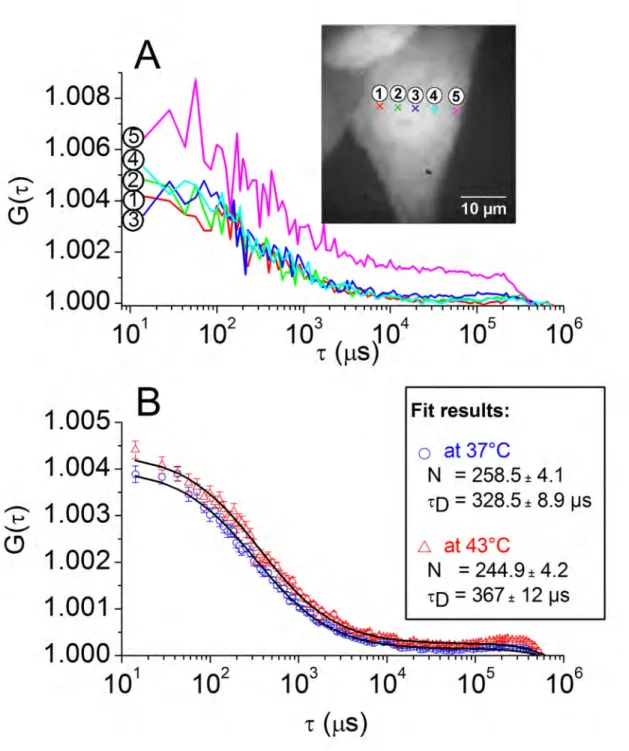
Fig. 1 A shows the ACF curves of four spots located within the nucleus of a given cell at 37°C, the fifth one being in the cytoplasm. We see in Fig. 1 B a comparison between ACF averaged over five nuclei at 37°C and 43°C, which illustrates the weak difference of dynamics and concentration between the two temperatures. To go further, we performed analysis of variance (ANOVA) of the diffusion time, τD, and of the number of molecules, N, to test which factors were significant. Moreover, in order to check that the heat-shock does not induce any irreversible experimental artifact, one of the three Hela-eGFP culture dishes was first heated and measured at 43°C, then cooled down and measured at 37°C, while the two other dishes were measured in normal sequence (37°C, followed by 43°C). In conclusion, the temperature, the measurement sequence and the localization within the cells are not significant factors regarding τD and N. Conversely, we observed that the global intensity decreases by 23% at higher temperature. Since the temperature has no significant effect on the number of molecules, this corresponds to a decrease of the molecular brightness by an amount of 23% (when going from 37° to 43°C), which is reasonably consistent with our measurements of eGFP in solution. Globally the diffusion time varies between 314 and 588 µs (respectively first and last quartile), with a median at 422 µs. Using the radius of the observation volume (wr = 0.251 µm), we also calculated the median value of the diffusion constant distribution and found 37 µm2/s, that is about four times lower than the value measured in solution. Moreover, the distribution of its value is rather broad, in fairly good agreement with (21, 36).
The reaction dominant model is not necessary to fit the eGFP data
Additionally, in order to treat on an equal footing the dynamics of HSF1-eGFP cells and that of eGFP ones, we also fitted the ACF curves of the eGFP cells with the complete reaction dominant model by letting free the parameters Feq and τoff (see Eq. 2). Although the corresponding reduced χ2 statistics does not indicate better fits, it allows further discussion about HSF1 dynamics and comparisons with eGFP cells. In agreement with the pure diffusion fits, the temperature has no influence on the parameters of the reaction dominant fits (τD, Feq and τoff). However the median diffusion constant now increases to 79 µm2/s, because part of the long time behavior of the ACF is taken into account by the parameter τoff. Interestingly enough, among the initial set of 280 ACF curves, about 30% of the fits could not properly converge or led to aberrant parameter values, meaning that, in those situations, the Feq and τoff parameters were ill-defined (while the pure diffusion model held). In contrast, for HSF1-eGFP cells, more than 93% of the ACF curves could be properly fitted with the reaction dominant model, as discussed below (and conversely, could not be fitted with the free diffusion model).
Cellular response to heat shock
We applied to HSF1-eGFP expressing cells the same protocol used for eGFP expressing control cells, except for the fits that were all performed with the reaction dominant model, the pure diffusion one giving a bad quality of fit. Experiments were performed on 12 culture dishes, providing 330 correct fits of the ACF curves at 37°C and 344 at 43°C, all corresponding to spots located in the nuclei (excluding nucleoli), where HSF1-eGFP concentrates. Rejected incorrect fits (7%) correspond to estimated parameters that were either inconsistent with the model (34), or further by a factor of 10 from the mean value. After heat shock, HSF1-eGFP is partially relocalized within nuclear stress bodies (nSBs). Their presence was used as a control of efficient heat shock cellular response, but all the measurements were performed outside nSBs (otherwise a strong photobleaching is induced, which makes mFCS data non-exploitable). Contrarily to eGFP expressing cells, a clear impact of heat shock was observed on HSF1-eGFP, as discussed in the following.
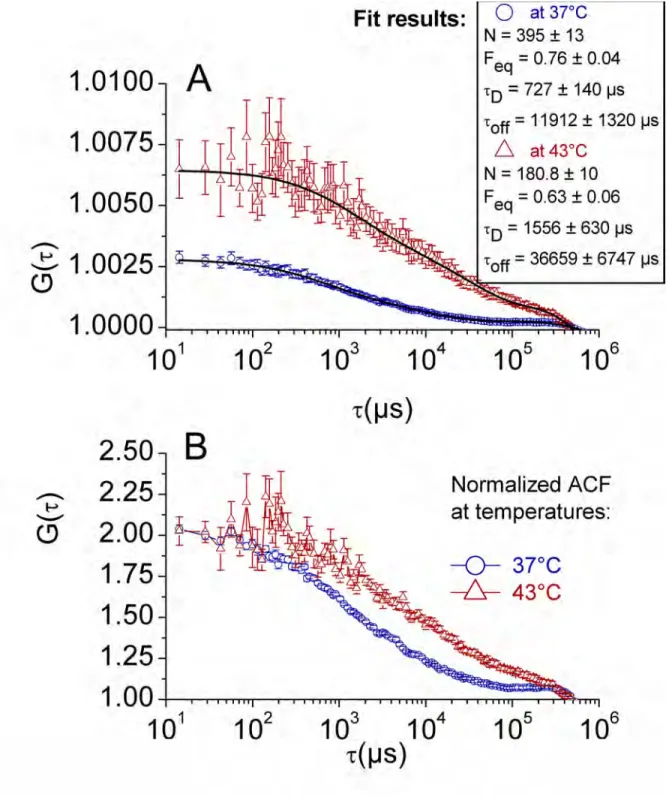
Number of molecule decreases after heat shock
As shown in Fig. 2, A and B, at 43°C the number of molecules is significantly lower, while the dynamics is slower. A statistical analysis of the whole set of HSF1-eGFP data shows that the intensity and the number of molecules both decrease by a factor of two when going from 37°C to 43°C. In other words, the molecular brightness does not significantly change, which differs from the case of eGFP cells. The pronounced decrease in intensity can be attributed to two factors: HSF1 relocalization within the nSBs and the consequence of DNA binding of HSF1-eGFP molecules favoring photobleaching. Moreover, we suggest that the brightness is maintained between 37°C and 43°C (contrarily to eGFP cells) because of the interplay between trimerization of HSF1, photobleaching and decrease of eGFP molecular brightness. Thus, three phenomena contribute to the decrease in the number of molecules: photobleaching, nSBs relocalization and trimerization.
Photobleaching shows very long time dynamics
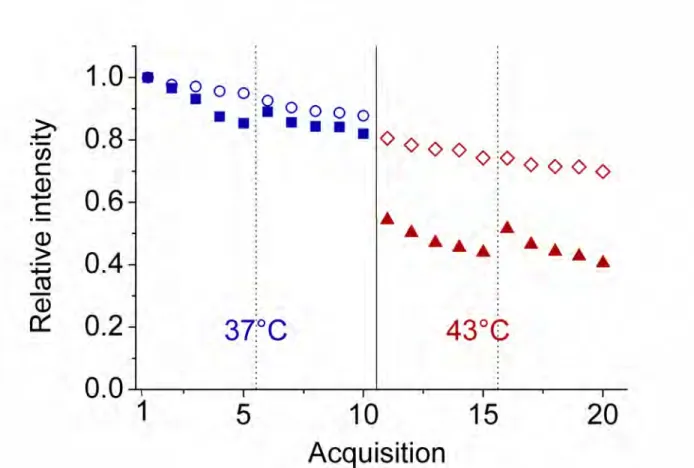
To get a better overview of relocalization and photobleaching, we plotted in Fig. 3 the relative intensities during the time course of acquisitions (two series of five acquisitions at each temperature) and also compared eGFP cells to eGFP ones. First, we observe for HSF1-eGFP cells only a sharp drop in intensity between the last acquisition at 37°C and the first one at 43°C. This is clearly the consequence of nSBs relocalization. Such a pronounced drop in intensity is not observed with eGFP cells, where the limited drop can be attributed solely to the decrease in brightness. At each temperature, we also observe at the beginning of the second series of five acquisitions (new spots location), a partial re-initialization of the fluorescence intensity of HSF1-eGFP cells. This can be due to weakly mobile species: when the spots are shifted to the second series of positions, fresh, weakly mobile species start being photobleached. Such weakly mobile species do not exist in eGFP cells, where the decrease in intensity at each temperature is monotonous. The weakly mobile HSF1-eGFP species must have a residence time of the order of 1 s or longer, i.e. a time inaccessible to mFCS, which is limited to times smaller than ≅ 1 s. Another explanation could be compartmentalization that would induce a local depletion in the vicinity of the spots.
Diffusion and dissociation rate slow down after heat shock
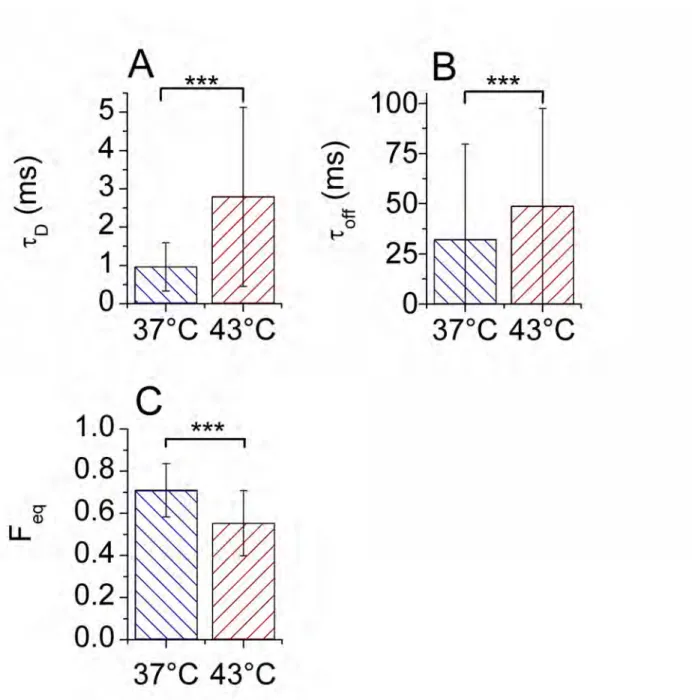
heat shock and respectively vary, between 37°C and 43°C, from 956 to 2788 µs, from 31970 to 48640 µs and from 0.71 to 0.55 (mean values). We checked that the uncertainties of the individual fit parameters are smaller than the SD of their global distributions, thus meaning that these distributions reflect some cellular variability. To proceed further we first consider the median values of three dynamic constants, D, kon* and koff, calculated from their distributions shown in Fig. S8.
The diffusion constant of HSF1-eGFP is 18 µm2/s at 37°C and 7.2 µm2/s at 43°C. From these values we can estimate the molecular weight (MW) of HSF1-eGFP which would be 286 kD at 37°C and 4470 kD at 43°C. While the value for non heat shocked cells is consistent with gel filtration data (220-330 kD), the MW for heat shocked cells is significantly larger than that obtained by gel filtration (700-800 kD) (37, 38). In other words, our measured D constant is too small at 43°C. We thus suggest that the diffusion constant measured after heat shock is an effective diffusion constant slowed down by various interactions. Only the less specific of these interactions is directly measured by mFCS, corresponding to rather fast association and dissociation events.
The kon and koff constants are found to be kon* = 22.4 s-1 and koff = 65 s-1 at 37°C versus kon* = 23.2 s-1 and koff = 30.1 s-1 at 43°C. Surprisingly, while koff is affected by heat-shock, kon* is not. As suggested previously, we cannot directly evaluate the more specific part of the kon* distribution after heat shock. Since the measured value of kon* is related to less specific interactions, it does not change after heat shock. For eGFP cells, a higher value of kon* = 47.4 s-1 was found. Since the diffusion of those cells is also twice as fast as in HSF1 cells before heat shock, we believe the measured association constant is diffusion-related. On the other hand, the measured value of koff decreases with the temperature and is always smaller than for inert eGFP (where we found koff = 240.5 s-1). Therefore, koff partially accounts for more specific heat-shock activated interactions.
Specific binding sites are heterogeneously distributed
To confirm our hypothesis according to which HSF1 diffusion constant after heat shock reflects specific interactions with DNA binding sites, we investigated the spatial variations of the measured parameters of the reaction dominant model. Previous studies have shown that the heat shock response correlates with an increase of the number of specific DNA binding sites for HSF1, but this number is still limited. We thus expect to observe a more pronounced intracellular variability at 43°C. Therefore, we calculated, for each cell, the variation coefficient of D, kon* and
koff, defined as the ratio of the standard deviation to the mean value of the measurements provided by different spots within the cell. While the variation coefficient of kon* and koff (resp. 0.90 and 0.57) do not vary after heat shock, that of the diffusion constant D goes from 0.63 at 37°C, to 1.02 at 43°C (t-test gives p < 10-5). This can be attributed to the specific part of the interactions of HSF1 with DNA, activated by heat-shock, which would cause the effective diffusion constant to decrease. Because these specific interactions are localized on a limited number of sites, they induce a higher spatial inhomogeneity (evaluated with the variation coefficient) of the measured diffusion constant. To confirm this interpretation, we have also calculated the variation coefficient of the diffusion constant of inert eGFP molecules and found the same value, 0.4, before and after heat shock. This indicates that the chromatine structure, which is modified by heat shock, does not impact on diffusion inhomogeneity.
The diffusion of eGFP has been recently shown to be slower within dense heterochromatic deacteylated regions of the genome, than within acetylated euchromatic regions (39). Since deacetylation of histones occurs upon heat-shock (29), the corresponding modifications of chromatin structure should induce a lower mobility. Conversely, in solution, the diffusion constant increases with temperature, mainly because of the viscosity dependence (see Fig. S7). Since the mobility of eGFP in living cells does not significantly vary upon stress (Fig. 1
B), opposite impacts of chromatin deacteylation and viscosity effect probably compensate each
other in living cells and thus, can be laid aside in the forthcoming discussion.
HSF1 activation is a multistep complex process involving multiple partners. In non heat-shocked cells, HSF1 is present as monomers bound to several proteins including HSP70, HSP90 and HDAC6 (40). In heat-shocked cells, HSF1, dissociates from its chaperones, trimerizes and is found to interact with HATs and HDAC1 and 2 (29). Like other transcription factors (41), HSF1 diffusion is delayed by interactions with DNA, so that the diffusion constant is most likely effective. In addition, our measured koff constants are intermediate between specific (0.1 s-1) and aspecific transient binding (325 s-1) values found in the case of Hox transcription factor (42). Our mFCS experiments most likely reveal the coexistence of high- and low-affinity HSF1 binding sites. The first one would correspond to weak HSF1-DNA binding interactions resulting from multiple association/dissociation events occurring in the search of HSF1 for specific HSE target sites (43). The second one corresponds to HSF1 specific binding to DNA targets following heat shock.
The heterogeneity that we found in stressed cells could result from the low number of specific HSF1 DNA binding sequences. 768 HSE sites have been identified in human cells from a database of more than 10 000 putative promoters, only half of which bound to HSF1 in heat-shocked cells (44). Additional HSE elements have been identified in the vicinity of a number of Alu sequences present in an inverse orientation with regard to transcriptionally repressed genes upon heat shock (45). The existence of a low number of HSF1 DNA targets with a genome-wide distribution would explain the diffusion constant heterogeneity that we have observed.
In Hela cells, the HSF1 dynamics is similar to that already reported for other transcription factors: nuclear steroid receptors (46-50), the tumor suppressor gene p53 (51), the TATA Binding Protein “TBP” and TBP associated factors “TAFs” (52) studied by FRAP in the nucleoplasm. However this contrasts with the particular slow HSF1 dynamics previously reported in drosophila (53). It is worthwhile to note that this latter study was performed only on specific HSF1-DNA binding chromosomal sites and not in the nucleoplasm. As stressed by McNally and co-authors (47-50, 54), caution should however be taken when comparing data from the literature, in particular when comparing different acquisition techniques (FRAP, FCS, SMT) and modeling methods. A recent publication was especially devoted to the cross-validation of FCS and FRAP and stressed the necessity to quantify the impact of photobleaching on in vivo binding estimates (49). We therefore believe that it would be interesting to combine mFCS and FRAP like approaches that should permit to study molecular interactions at short and long time scales in combination with HSF1 mutated in their DNA binding domain.
CONCLUSIONS
We have shown that our mFCS set-up makes it possible to study changes of HSF1 dynamics in heat-shocked cells. While a standard FCS apparatus would have required sequentially moving the laser spot at the positions of interest within the cells, we could
simultaneously (i.e. in parallel), acquire the corresponding autocorrelation functions, thus saving a considerable amount of time. This is crucial when studying a transient phenomenon such as the cellular response to heat. Not only does it save time, but it also improves the quality of the statistical data and permits further analysis, such as the study of the intracellular variability of the dynamic parameters (diffusion and reaction constants). Although the use of five measurements volumes in parallel comes at a price of lower time resolution compared to standard FCS, the 14 µs temporal resolution is amply sufficient for the phenomena we observed (shorter diffusion times were of the order of 200 µs). Therefore we do not see any disadvantage of the mFCS technique, except the relative complexity needed to run it, till now.
Concerning our study of heat shock, the mFCS experiments put into evidence weakly specific interactions of HSF1 with DNA sites homogeneously distributed within the nucleus, superimposed to more specific and much less numerous (i.e. more heterogeneous) interaction sites. FCCS or 2C-2D-FIDA would be complementary approaches (55), as they should permit to provide information about trimerization of HSF1 following heat shock, or interactions with identified partners, such as chaperones. The observed intranuclear variability of diffusion also suggests that it will be important to combine, in our future experiments, the detection of HSF1 with markers of euchromatin and heterochromatin. However, fluorescence cross-talk should be carefully prevented. Finally, no doubt that it would be interesting to combine FCS and FRAP like approaches, as it has been done to study the dynamics of the heterochromatin factor HP1 (56), since it should permit to analyze HSF1 interactions at short and long time scales. This will be the continuation of our work on the heat shock response.
SUPPORTING MATERIAL [S1] is available at
www.biophys.org/biophysj/supplemental/S0006-3495(XX)XXXXX-X.
Supporting Material
Document S1. [Methods and complementary results] AKNOWLEDGEMENTS
This project was funded by the French Agence Nationale de la Recherche under contract ANR-08-PCVI-0004-01 and by the Région Rhône-Alpes (CIBLE 2009). A. Gritchine is kindly acknowledged for his careful reading of the manuscript and Edwige Col for her help in molecular biology.
SUPPORTING CITATIONS
REFERENCES
(1) Petersen, N.O., P.L. Hoddelius, P.W. Wiseman, O. Seger, and K.E. Magnuson. 1993. Quantification of membrane receptor distribution by image correlation spectroscopy: concept and application. Biophys. J. 65:1135-1146.
(2)Wiseman, P.W., and N.O. Petersen. 1999. Image Correlation Spectroscopy. II. Optimization for Ultrasensitive Detection of Preexisting Platelet-Derived Growth Factor-b Receptor Oligomers on Intact Cells. Biophys. J. 76:963-977.
(3) Wiseman, P.W., C.M. Brown, D.J. Webb, B. Hebert, N.L. Johnson, J.A. Squier, M.H. Ellisman, and A.F. Horwitz. 2005. Spatial mapping of integrin interactions and dynamics during cell migration by Image Correlation Microscopy. J. Cell Sci. 117:5521-5534.
(4) Digman, M. A., P.W. Wiseman, A.. R. Horwitz, and E. Gratton. 2009. Detecting Protein Complexes in Living Cells from Laser Scanning Confocal Image Sequences by the Cross Correlation Raster Image Spectroscopy Method. Biophys. J. 96:707-716.
(5) Gielen, E., N. Smisdom, M. vandeVen, B. De Clercq, E. Gratton, M. Digman, J.-M. Rigo, J. Hofkens, Y. Engelborghs, and M. Ameloot. 2009. Measuring Diffusion of Lipid-like Probes in Artificial and Natural Membranes by Raster Image Correlation Spectroscopy (RICS): Use of a Commercial Laser-Scanning Microscope with Analog Detection. Langmuir 25:5209-5218. (6) Digman, M. A., C. M. Brown, P. Sengupta, P. W. Wiseman, A. R. Horwitz, and E. Gratton. 2005. Measuring fast dynamics in solutions and cells with a laser scanning microscope. Biophys.
J. 89:1317-1327.
(7) Grüner, N., J. Capoulade, C. Cremer, and M. Wachsmuth. 2010. Measuring and imaging diffusion with multiple scan speed image correlation spectroscopy. Opt. Exp. 18:21225-21237. (8) Kannan, B., L. Guo, T. Sudhaharan, I. Maruyama, and T. Wohland. 2007. Spatially Resolved Total Internal Reflection Fluorescence Correlation Microscopy Using an Electron Multiplying Charge-Coupled Device Camera. Anal. Chem. 79:4463-4470.
(9) Capoulade, M. Wachsmuth, L. Hufnagel, and M. Knop. 2011. Quantitative fluorescence imaging of protein diffusion and interaction in living cells. Nat. Biotech. 29:835-839.
(10) Ruan, Q., M. A. Cheng, M. Levi, E. Gratton, and W. W. Mantulin. 2004. Spatial-temporal studies of membrane dynamics: scanning fluorescence correlation spectroscopy (SFCS). Biophys.
J. 87:1260-1267.
(11) Amediek, A., E. Haustein, D. Scherfeld, and P. Schwille. 2002. Scanning Dual-Color Cross-Correlation Analysis for Dynamic Co-Localization Studies of Immobile Molecules. Single Mol. 4:201-210.
(12) Skinner, J.P., Y. Chen, and J.D. Müller. 2005. Position-sensitive scanning fluorescence correlation spectroscopy, Biophys. J. 89:1288-1301.
(13) Ries, J., and P. Schwille. 2006. Studying Slow Membrane Dynamics with Continuous Wave Scanning Fluorescence Correlation Spectroscopy. Biophys. J. 91:1915-1924.
(14) Pan, X., H. Yu, X. Shi, V. Korzh, and T. Wohland. 2007. Characterization of flow direction in microchannels and zebrafish blood vessels by scanning fluorescence correlation spectroscopy.
J. Biomed. Opt. 12:014034-1-014034-10.
(15) Ries, J., S. R. Yu, M. Burkhardt, M. Brand, and P. Scwhille. 2009. Modular scanning FCS quantifies receptor-ligand interactions in living multicellular organisms. Nat. Meth. 9:643-646. (16) Digman, M. A., and E. Gratton. 2009. Imaging Barriers to Diffusion by Pair Correlation Functions. Biophys. J. 97:665-673.
(17) Zdenĕk Petrásĕk, S. Derenko and P. Schwille. 2011. Circular scanning fluorescence correlation spectroscopy on membranes Opt. Exp. 19:25006-25021.
(18) Ferrand, P., M. Pianta, A. Kress, A. Aillaud, H. Rigneault, and D. Marguet. 2009. A versatile dual spot laser scanning confocal microscopy system for advanced fluorescence correlation spectroscopy analysis in living cell. Rev. Sci. Instrum. 80:083702-1-083702-1.
(19) Sisan, D. R., R. Arevalo, C. Graves, R. MCAllister, and J. S. Urbach. 2006. Spatially Resolved Fluorescence Correlation Spectroscopy Using a Spinning Disk Confocal Microscope.
Biophys. J. 91:4241-4252.
(20) Needleman, D., Y. Xu, and T. Mitchison. 2009. Pin-Hole Array Correlation Imaging: Highly Parallel Fluorescence Correlation Spectroscopy. Biophys. J. 96:5050-5059.
(21) Oh, D., A. Zidovska, Y. Xu, and D. Needleman. 2011. Development of Time-Integrated Multipoint Moment Analysis for Spatially Resolved Fluctuation Fluorescence Spectroscopy with High Time Resolution. Biophys. J. 101:1546-1554.
(22) Curtis, J. E., B. A. Koss, and D. G. Grier. 2002. Dynamic holographic optical tweezers, Opt.
Com. 207:169-175.
(23) Blancquaert, Y., J.Gao, J. Derouard, and A. Delon. 2008. Spatial fluorescence cross correlation spectroscopy by means of a spatial light modulator, J.Biophoton. 1:408-418.
(24) Burkhardt, M., and P. Schwille. 2006. Electron multiplying CCD based detection for spatially resolved fluorescence correlation spectroscopy, Opt. Exp. 14:5013-5020.
(25) Kannan, B., J. Y. Har, P. Liu, I. Maruyama, J. L. Ding, and T. Wohland. 2006. Electron Multiplying Charge-Coupled Device Camera Based Fluorescence Correlation Spectroscopy.
(26) Matsumoto, M., T. Sugiura, and K. Minato. 2007. Spatially resolved fluorescence correlation spectroscopy based on electron multiplying CCD. SPIE-OSA 6630:663017-1-663017-8.
(27) Tyndall, D., R. Walker, K. Nguyen, R. Galland, J. Gao, I. Wang, M. Kloster, A. Delon, and R. Henderson. 2011. Automatic laser alignment for multifocal microscopy using a LCOS SLM and a 32_32 pixel CMOS SPAD array. Proc. SPIE Vol. 8086
(28) Galland, R., J. Gao, M. Kloster, G. Herbomel, O. Destaing, M. Balland, C. Souchier, Y.Usson, J.Derouard, I. Wang and A. Delon. 2011. Multi-confocal fluorescence correlation Spectroscopy: experimental demonstration and potential applications for living cell measurements. Front. Biosci. 3:476-488
(29) Fritah, S., E. Col, C. Boyault, J. Govin, K. Sadoul, S. Chiocca, E. Christians, S. Khochbin, C. Jolly, and C. Vourc'h. 2009. Heat-shock factor 1 controls genome-wide acetylation in heat-shocked cells. Mol. Biol. Cell. 20:4976-4984.
(30) Jolly, C., A. Metz, J. Govin, M. Vigneron, B. M. Turner, S. Khochbin, and C. Vourc'h. 2004. Stress-induced transcription of satellite III repeats. J. Cell. Biol. 164:25-33.
(31) Akefelt, M., R.I. Morimoto, L. Sistonen. 2010. Heat Shock Factors: integrators of cell stress, development and lifespan, Nat. Rev. Mol Cell. Biol. 11:545-555.
(32) Cojoc, D., E. Di Fabrizio, L. Businaro, and S. Cabrini. 2003. Spherical-based approach to design diffractive optical elements. Proc. of SPIE 5227:123-131.
(33) Donnert G., C. Eggeling, and S. W Hell. 2007. Major signal increase in fluorescence microscopy through dark-state relaxation. Nat. Meth. 4: 81-86.
(34) Michelman-Ribeiro, A., D. Mazza, T. Rosales, T. J. Stasevich, H. Boukari, V. Rishi, C. Vinson, J. R. Knutson, and J. G. McNally. 2009. Direct Measurement of Association and Dissociation Rates of DNA Binding in Live Cells by Fluorescence Correlation Spectroscopy.
Biophys. J. 97:337-346.
(35) Petrasek, Z., and P. Schwille. 2008. Precise measurement of diffusion coefficients using scanning fluorescence correlation spectroscopy. Biophys J. 94:1437–1448.
(36) Dross, N., C. Spriet, M. Zwerger, G. Müller, W. Waldeck, and J. Langowski. 2009. Mapping eGFP oligomer mobility in living cell nuclei. PloS ONE 4:1-13.
(37) Baler, R., G. Dahl, and R. Voellmy. 1993. Activation of human heat shock genes is accompanied by oligomerization, modification, and rapid translocation of heat shock transcription factor HSF1. Mol. Cell. Biol. 13:2486-2496
(38) Sarge, K. D., S. P. Murphy, and R. I. Morimoto. 1993. Activation of heat shock gene transcription by heat shock factor 1 involves oligomerization, acquisition of DNA-binding
activity, and nuclear localization and can occur in the absence of stress. Mol. Cell. Biol. 13:1392-1407.
(39) Bancaud, A., S. Huet, N. Daigle, J. Mozziconacci, J. Beaudouin, and J. Ellenberg. 2009. Molecular crowding affects diffusion and binding of nuclear proteins in heterochromatin and reveals the fractal organization of chromatin. EMBO J. 28:3785-3798.
(40) Boyault, C., Y. Zhang, S. Fritah, C. Caron, B. Gilquin, S. H. Kwon, C. Garrido, T. P. Yao, C. Vourc'h, P. Matthias, and S. Khochbin. 2007. HDAC6 controls major cell response pathways to cytotoxic accumulation of protein aggregates. Genes Dev. 21:2172-2181
(41) Karpova, T. S., T. Y. Chen, B. L. Sprague, and J. G. McNally. 2004. Dynamic interactions of a transcription factor with DNA are accelerated by a chromatin remodeller. EMBO Rep. 5:1064-1070.
(42) Vukojevic, V., D. K. Papadopoulos, L. Terenius, W. J. Gehring, and R. Rigler. 2010. Quantitative study of synthetic Hox transcription factor-DNA interactions in live cells. Proc.
Natl. Acad. Sci. USA 107:4093-4098.
(43) Hager, G. L., J. G. McNally, and T. Misteli. 2009. Transcription dynamics. Mol. Cell. 35:741-753.
(44) Trinklein, N. D., J. I. Murray, S. J. Hartman, D. Botstein, and R. M. Myers. 2004. The role of heat shock transcription factor 1 in the genome-wide regulation of the mammalian heat shock response. Mol. Biol. Cell. 15:1254-1261.
(45) Pandey, R., A. K. Mandal, V. Jha, and M. Mukerji. 2011. Heat shock factor binding in Alu repeats expands its involvement in stress through an antisense mechanism. Genome Biol. 12:R117
(46) Darzacq, X., J. Yao, D. R. Larson, S. Z. Causse, L. Bosanac, V. de Turris, V. M. Ruda, T. Lionnet, D. Zenklusen, B. Guglielmi, R. Tjian, and R. H. Singer. 2009. Imaging transcription in living cells. Annu Rev Biophys. 38:173-196.
(47) Mueller, F., P. Wach, and J. G. McNally. 2008. Evidence for a common mode of transcription factor interaction with chromatin as revealed by improved quantitative fluorescence recovery after photobleaching. Biophys. J. 94:3323-3339.
(48) Stasevich, T. J., F. Mueller, D. T. Brown, and J. G. McNally. 2010. Dissecting the binding mechanism of the linker histone in live cells: an integrated FRAP analysis. EMBO J. 29:1225-1234.
(49) Stasevich, T. J., F. Mueller, A. Michelman-Ribeiro, T. Rosales, J. R. Knutson, and J. G. McNally. 2010. Cross-validating FRAP and FCS to quantify the impact of photobleaching on in vivo binding estimates. Biophys. J. 99:3093-3101.
(50) Stasevich, T. J., and J. G. McNally. 2011. Assembly of the transcription machinery: ordered and stable, random and dynamic, or both? Chromosoma 120:533-545.
(51) Hinow, P., C. E. Rogers, C. E. Barbieri, J. A. Pietenpol, A. K. Kenworthy, and E. DiBenedetto. 2006. The DNA binding activity of p53 displays reaction-diffusion kinetics.
Biophys. J. 91:330-342.
(52) de Graaf, P., F. Mousson, B. Geverts, E. Scheer, L. Tora, A. B. Houtsmuller, and H. T. Timmers. 2010. Chromatin interaction of TATA-binding protein is dynamically regulated in human cells. J. Cell. Sci. 123:2663-2671.
(53) Yao, J., K. M. Munson, W. W. Webb, and J. T. Lis. 2006. Dynamics of heat shock factor association with native gene loci in living cells. Nature 442:1050-105
(54) Mueller, F., D. Mazza, T. J. Stasevich, and J. G. McNally. 2010. FRAP and kinetic modeling in the analysis of nuclear protein dynamics: what do we really know? Curr. Opin. Cell. Biol. 22:403-411.
(55) Elson, E. L. 2011. Fluorescence Correlation Spectroscopy: Past, Present, Future. Biophys. J. 101:2855-2870.
(56) Müller, K. P., F. Erdel, M. Caudron-Herger, C. Marth, B. D. Fodor, M. Richter, M. Scaranaro, J. Beaudouin, M. Wachsmuth, and K. Rippe. 2009. Multiscale Analysis of Dynamics and Interactions of Heterochromatin Protein 1 by Fluorescence Fluctuation Microscopy. Biophys.
J. 97:2876-2885.
(57) Müller, C. B., A. Loman, V. Pacheco, F. Koberling, D. Willbold, W. Richtering, and J. Enderlein. 2008. Precise measurement of diffusion by multi-color dual-focus fluorescence correlation spectroscopy. Europhys. Lett. 83:46001-p1-46001-p5
FIGURES
Figure 1: ACF obtained with eGFP cells. (A) example of ACF curves acquired from four spots located in the nucleus (spots 1 to 4) and one in the cytoplasm (spot 5) of a single eGFP cell at 37°C (The inset shows the location of the spots marked by crosses on a wide-field fluorescence image of the cell); (B) averaged ACF curves corresponding to 38 spots at 37°C (blue circles) and 38 spots at 43°C (red triangles) located in the nuclei of 5 eGFP cells, the superimposed black solid lines corresponding to the fits (the estimated parameters are given in the graph).
Figure 2: averaged ACF curves corresponding to 32 spots at 37°C (blue circles) and 13 spots at 43°C (red triangles) located in the nucleus of 5 HSF1-eGFP cells: (A) without any prior normalization of the individual curves, in order to reveal the difference of amplitude due the change in the number of molecules, the superimposed black solid lines correspond to the fits (the estimated parameters are given in the graph); (B) with normalization of the amplitude (G(0) = 2) of each individual ACF curve, in order to emphasize the difference of temporal behavior.
Figure 3: Relative variation of intensities during the time course of acquisitions before and after heat shock. The successive series of five acquisitions are separated by dotted vertical lines, whereas the two temperatures are separated by a solid line. Open symbols correspond to eGFP cells (blue circles at 37°C and red diamonds at 43°C) and filled symbols refer to HSF1-eGFP cells (blue squares at 37°C and red triangles at 43°C).
Figure 4: Mean values and SDs (vertical bars) of the diffusion time, τD (A), the residence time, τoff (B) and the fraction of free molecules, Feq (C), before (left) and after heat shock (right), obtained by fitting 330 ACF curves at 37°C and 344 ACF curves at 43°C. The *** symbol corresponds to a significance level P < 10-3 between the bracketed groups.