HAL Id: hal-01245492
https://hal.archives-ouvertes.fr/hal-01245492
Submitted on 17 Dec 2015
HAL is a multi-disciplinary open access
archive for the deposit and dissemination of
sci-entific research documents, whether they are
pub-lished or not. The documents may come from
teaching and research institutions in France or
abroad, or from public or private research centers.
L’archive ouverte pluridisciplinaire HAL, est
destinée au dépôt et à la diffusion de documents
scientifiques de niveau recherche, publiés ou non,
émanant des établissements d’enseignement et de
recherche français ou étrangers, des laboratoires
publics ou privés.
Automatic method for spectral pattern association with
characteristic frequencies
Marcin Firla, Timothée Gerber, Pascal Bellemain, Nadine Martin
To cite this version:
Marcin Firla, Timothée Gerber, Pascal Bellemain, Nadine Martin. Automatic method for spectral
pat-tern association with characteristic frequencies. Diagnostyka , Polish Society of Technical Diagnostics
(PSTD), 2015, 16 (4), pp.77-84. �hal-01245492�
AUTOMATIC METHOD FOR SPECTRAL PATTERN ASSOCIATION WITH
CHARACTERISTIC FREQUENCIES
Marcin FIRLA, Timothée GERBER, Pascal BELLEMAIN, Nadine MARTIN University of Technology, Faculty of Information Technology Univ. Grenoble Alpes, GIPSA-Lab, F-38000 Grenoble, France
CNRS, GIPSA-Lab, F-38000 Grenoble, France e-mail: [email protected]
Abstract
This paper proposes an advanced signal-processing technique to improve the condition monitoring of rotating machinery. The proposed method employs the results of a blind spectrum interpretation including harmonic and sideband series detection. The contribution of this paper is an algorithm for automatic association of harmonic and sideband series with the characteristic fault frequencies listed in the kinematic configuration of the monitored system. The proposed algorithm is efficient in inspection of real-world signals, which contain a vast number of detected spectral components. The proposed approach has the advantage of taking into account a possible slip of the rolling-element bearings. The performance of the proposed algorithm is illustrated on real-world data by investigating a shaft problem of an industrial wind turbine high-speed shaft.
Key words: condition monitoring, characteristic fault frequencies, wind shaft turbine diagnosis. METODA AUTOMATYCZNEGO ŁĄCZENIA SCHEMATÓW SPEKTRALNYCH Z
CHARAKTERYSTYCZNYMI CZĘSTOTLIWOŚCIAMI
Streszczenie
W artykule zaproponowano zaawansowaną technikę przetwarzania sygnałów w celu poprawy monitorowania stanu maszyn wirujących. Przedstawiona metoda wykorzystuje wyniki ślepej interpretacji widma sygnału, m. in. detekcję serii harmonicznych i wstęg bocznych. Wkład zaprezentowany w tym artykule to algorytm do automatycznego łączenia serii harmonicznych oraz wstęg bocznych z charakterystycznymi częstotliwościami dostępnymi na podstawie konfiguracji kinematycznej monitorowanej maszyny. Zaproponowany algorytm jest skuteczny w badaniu sygnałów rzeczywistych, które zawierają dużą liczbę wykrytych elementów widmowych. Zaletą zaproponowanej metody jest uwzględnianie możliwego poślizgu łożyska tocznego. Działanie zaproponowanego algorytmu zostało zilustrowane na przykładzie rzeczywistych danych, który pokazuje problem wału wysokoobrotowego przemysłowej turbiny wiatrowej.
Słowa kluczowe:monitorownie stanu, częstotliwości charakterystyczne uszkodzeń, diagnostyka wału turbin wiatrowych.
1. INTRODUCTION
Condition Monitoring Systems (CMSs) are widely used in industry and bring considerable benefits in mechanical component surveillance [1, 2]. CMSs are based on data acquisition and processing in order to reveal abnormalities in the state of the investigated system. There are several techniques to perform this task such as vibration, acoustic emission, and lubricant analysis. This paper focuses on a vibration-based condition monitoring, which is the key component of predictive maintenance technique since it provides indicators related to the evolution of potential faults and failures [3].
Wind energy sector is an example of an industry where CMSs are widely used to monitor the state of mechanical components of wind turbines due to their increasing number. The development of CMSs is an active research domain [4, 5, 6, 7]. As [8] points out, the usage of CMSs is particularly crucial for offshore wind farms due to restricted human accessibility. A robust CMS is very beneficial for the wind energy industry, particularly for offshore farms. The financial margins of this business are very low, so a prolonged down-time of a wind turbine generates high economical losses [9]. Those factors cause a need for an efficient surveillance of every wind turbine. This surveillance could be enhanced by an automatic and adaptive CMS.
1.1. Shaft Problems
A vast number of rotating machinery faults manifest themselves at frequencies corresponding to the speed of the investigated shaft or its low harmonics and sub-harmonics. The shaft rotational speed is usually expressed in revolutions per minute (RPM). According to [10] the most common vibration trouble sources are unbalance and misalignment. Each of them is identified to occur more than half the times when a problem with rotating machinery is investigated. Since, the misalignment problem is of interest in this paper a short description of this malfunction is given hereinafter.
Misalignment occurs when the shaft axes of two mating parts create an angle or are offset to each other. The mixture of both types of misalignment is also possible. This fault is typical for couplings and bearing components and is the cause of higher radial or axial vibrations, depending on the misalignment type. Depending on the type and the design of the coupling as well as upon the share of angular versus offset misalignment problems a raise of amplitude can be observed at frequency corresponding to the fundamental frequency of shaft speed fr, its double
value 2·fr, or both together. The time domain signals
of vibrations measured on a machine with misalignment problems typically show periodic patterns with one or two cycles per revolution of the shaft. Moreover, in the case of a fundamental shaft frequency being the frequency with a raised amplitude due to a misalignment problem, the phase readings are necessary to distinguish it from an unbalance problem.
1.2. Paper Scope
This paper proposes an automatic fault detection and diagnosis method within a fully automatic tool, called AStrion, which consists of several steps to detect the most common drive train faults, like shaft, gear and bearing failures. Based on advanced signal-processing techniques, AStrion includes a sophisticated data validation and a time-frequency analysis in order to track frequency structures over a time signal sequence. This diagnosis approach is particularly efficient in the processing of signals with a rich spectral composition.
In this paper the spectrum analysis is based on an automatic peak detection and a classification method [11, 12, 13] which constitute a data-driven approach without any a-priori information on the data. The harmonic series and the sidebands around each harmonic are identified from the peaks according to their frequencies and classes [14]. The method presented in this paper, called a kinematic association method, links the previously detected spectral patters, both harmonic and sideband series, directly with the mechanical components of the
monitored system. It is an exhaustive algorithm which takes into account all information available from the signal and considers all possible combinations of modulations arising from the kinematic configuration of the system. The core algorithm is a data-driven method for selecting one series among numerous proximate ones. This automatic process features in a new method for selecting the rolling-element bearing frequencies. This method has been presented in [15], but this paper focuses on a new application of the proposed method.
The closest to the proposed method found in the literature [16] uses different amplitude and frequency estimation of the spectral content, and associates a single frequency and not a harmonic or sideband series, as well as does not precisely indicate the condition of decision making for harmonic frequency selection. Additionally, in this paper it is also considered a slippage phenomenon which occurs in rolling-element bearings (REBs).
The proposed approach is validated on real-world vibration measurements from a long period of time. It is shown that a misalignment problem clearly manifests itself on the proposed health indicator.
The paper is organized as follows. Section 2 presents the automatic characteristic fault frequencies association. Section 3 presents the results of the method applied on a wind turbine data. Section 4 draws conclusions and future perspectives.
2. CHARACTERISTIC FAULT FREQUENCY ASSOCIATION
Characteristic fault frequencies come from the geometry of the mechanical parts of an investigated system and help to find and identify the origin of a fault. These frequencies are easy to estimate for such components as gears, shafts, and REBs, which are important parts of wind turbine drive trains. An overview of the known fault frequencies of these major mechanical components is given in the following section.
2.1. Characteristic Fault Frequencies
The equations to calculate the values of the characteristic fault frequencies of a rotating machinery are presented in Table 1, where fr is the
shaft speed expressed in Hz, z is the number of teeth of a gear, nr is the number of rolling elements in a
bearing, dr is the diameter of the rolling elements, dp
is the pitch diameter, and Ф is the angle of the load from the radial plane.
Table 1 presents formulas based on theoretical models for calculating the characteristic frequencies of rotating machinery components and are referred to as theoretical values. It is important to notice that in the case of a REB the characteristic fault frequencies as BPFO, BPFI, FTF, BSF assume no slippage,
whereas it must occur when the bearing is running. This is the reason why the actual characteristic frequencies may vary slightly in the real-world applications in comparison to the theoretical values. In practice, the measured frequency may vary up to 2% of the theoretical REB characteristic fault frequencies [17]. This variation is taken into account in the proposed association method, while it has never been attempted before.
Table 1. Selected formulas for calculating characteristic fault frequencies [18].
2.2. Proposed Method for the Association
The proposed method for the kinematic information usage is a data-driven approach. It requires an a-priori interpretation of the spectral content of a signal. This interpretation is provided by the AStrion steps which include a spectral component identification [12] and a harmonic series
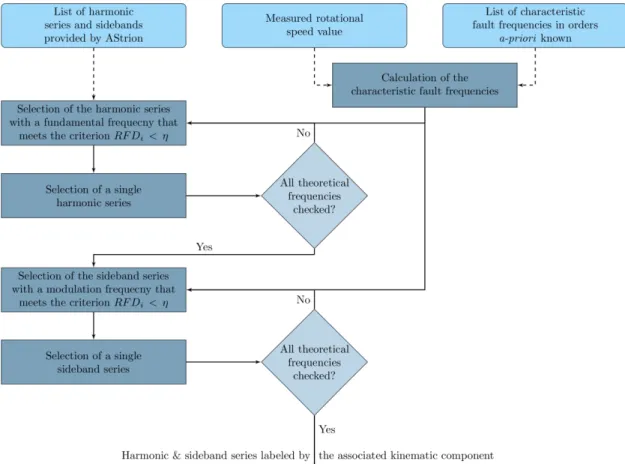
and modulation sideband series detection [14]. The proposed algorithm associates the characteristic fault frequencies with the previously detected harmonic and sidebands series. It is an iterative method, which performs an association for each characteristic frequency provided by the list of kinematic information on the system. Figure 1 shows a flowchart of the proposed method. Further explanation gives details on a single iteration of the proposed method to associate one characteristic frequency.
In the first step of this method the characteristic frequencies have to be calculated. As it is detailed in Figure 1, the measured rotational speed and the list of characteristic fault frequencies in orders is needed for this operation.
The order values are popularly used as a reference, since they can be directly applied on a signal after angular resampling, which is also called order tracking. More details on the angular resampling can be found in [17, 19, 15]. In the case of a signal in order domain the rotational speed value is redundant and a list of characteristic fault frequencies in orders is used directly.
In the case of more complex systems, the mechanical components are carried by several shafts. As a consequence, the speed of the other shafts has to be calculated from the gear ratios. This permits to measure the rotational speed of only one shaft, as it is popularly done in the case of wind turbines.
The association of the characteristic fault frequencies is performed in two steps. Firstly, the harmonic series which meet a criterion are identified as candidates for association. The second step is a selection of one candidate which gives an association of a single harmonic series with a characteristic fault frequency. These two steps are executed for harmonic series and afterwards the same set of operations is performed on modulation sidebands series. The difference is in the results of selecting one candidate. It is caused by the fact that for each carrier frequency of detected modulation one characteristic fault frequency can be associated, thus in the final result of modulation association it is possible to have multiple occurrences of one characteristic fault frequency.
The selection step is based on a relative difference between the theoretical and the real value of the characteristic fault frequency, defined as
(1) where i is the index of a series, fd,i is the
fundamental frequency of the detected series, ft,i is
the theoretical frequency based on the system kinematic. Only series with a value of RFDi lower
than a threshold η are kept
(2) Moreover, due to a slippage phenomenon mentioned earlier the threshold for rolling-element bearings is proposed to be bigger than for all other mechanical component and equals to η + δη. We propose to use η equal to 1% and η + δη equal to 2%.
Usually, a real-world signal has so many peaks detected that even in a small range defined by the threshold η there are numerous candidates. The next step is to select only one series for the final association. The association of series with the characteristic fault frequencies corresponding to shafts and gearboxes is intuitive. The proper series is selected as the one with the lowest RFDi value. In
the case of rolling-element bearings the lowest RFDi
value is not a sufficient indicator because of the slippage phenomenon, which can be random. As a consequence, earlier computed RFDi is not used at
all for the final selection of one candidate and an additional parameter is proposed. It is a bearing series indicator defined as
(3) where Ei is the energy of the series under
investigation, Emax,i is the energy of the series with
the highest energy among the series selected in the first step, and Deni is the density of the series, which
is an indicator informing about gaps between fundamental frequency and the highest rank of series; the density varies from 0 to1 and the highest value is for ‘full’ series, which have all the possible peaks present [14]. BSIi can have a value from 0 to
1, where the highest value describes a series with the highest energy among the selected candidates and without gaps within the peaks constituting a series. Therefore, series with the highest BSIi is selected to
be associated to a REB characteristic fault frequency.
3. CASE STUDY
This section presents the results of the above-proposed algorithm starting with a description of the wind turbine from which the vibration signals are acquired. In section 3.2. the results of the kinematic association are presented with a tracking over the entire year 2015 when a shaft problem occurred.
3.1. Wind Turbine Description
Data used in this section originate from a wind farm located near a small rural town in southern France, as presented in Figure 2. This wind farm is owned by VALOREM and maintained by VALEMO, a partner in the consortium of the European Innovation Project KAStrion (http://www.gipsa-lab.fr/projet/KASTRION/), which made the data available. At present, there are 11 operating wind turbines in this wind farm. The below presented case uses data which originate from one vibration sensor placed on the front side of the wind turbine generator.
Fig. 2. Location of the wind farm.
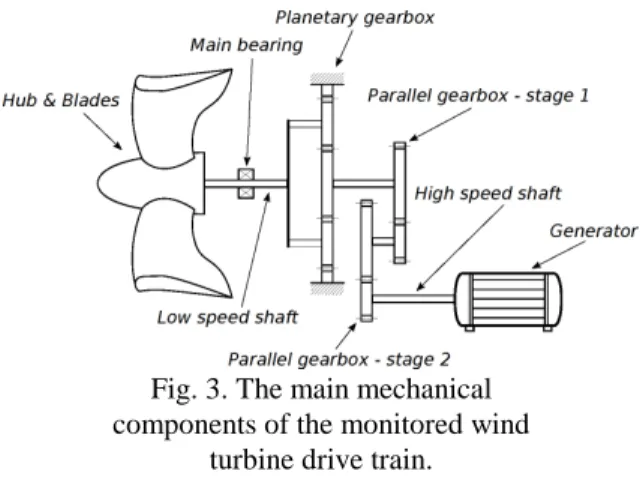
In this wind farm all wind turbines designed by ALSTOM are of the same type Ecotècnia 80 2.0. Those wind turbines are 2 MW rated power, 80 m rotor diameter, 70 m hub height, and operate with the wind in range 3m/s – 25m/s wind speed at the height of hub. The gearbox of this wind turbine type consists of a planetary gearbox followed by two
parallel stages. The main mechanical components of the drive train of the investigated machine are presented in Figure 3.
Fig. 3. The main mechanical components of the monitored wind
turbine drive train.
For the purpose of this study, the focus is made on only one characteristic fault frequency, the high-speed shaft one. The high-speed measurement is taken on the same shaft. Thus, for used configuration of acquisition system the theoretical value in order domain is equal to 1 order.
All signals are registered by the KAStrion CMS according to Table 2.
Table 2. Parameters of the investigated signals. Sampling frequency 25 000 Hz
Signal duration 10 s Number of samples 250 000
3.2. Characteristic Frequency Association Results
There were 165 signals measured between 10th February and 31st December 2014. In the presented case the speed range is defined as 1780 RPM – 1795 RPM. The mean speed values of all investigated signals are presented in Figure 4. One can note that the variations of the average speed with relation to the measurement time are less than 1%.
Each of the signals is processed by the entire AStrion tool, details could be found in [20]. This includes order tracking, data validation, peak identification, harmonic and sideband detection, kinematic association, sideband demodulation, and tracking of the spectral components. Thanks to the tracking method explained in [21] it is possible to easily display the evolution of the computed features over multiple signals.
In Figure 5 each presented sample indicates a successful association of the theoretical characteristic frequency of high-speed shaft to previously detected harmonic pattern in the signal. There are 161 points in Figure 5 which means that four signals were not associated and tracked. It could happen in the case of high non-stationarity of the
signal or other problems which made a correct harmonic series detection and following kinematic association not possible. The used tracking algorithm is prepared for such a situation and in these occurrences the so-called ‘slip state’ is employed to keep record of a spectral component. Missing information of the value is depicted by dash lines. The lack of four points means that only few times the slip state of the tracking method has been used. All the harmonic series associated with high-speed shaft are presented in Figure 5. It shows the robustness of the whole proposed data-driven method for condition monitoring.
Figure 6 presents another indicator computed by harmonic and sidebands detection algorithm, which is the energy of harmonic series associated with high-speed shaft. One can observe a significant change of its value between the beginning and the end of the year 2014. The lack of data in two spans, 21st June – 31st July and 5th September – 30th October, corresponds to periods when the CMS did not record any vibration data. These periods were used for maintenance actions. Among others a realignment of gearbox and generator was executed on 16th July and the change in the system performance is noticeable by observing the indicator shown in Figure 6. Unfortunately, there is no vibration data recorded on this wind turbine prior to presented time thus it is not possible to observe the augmentation of shown indicator and the development of the problem. Nonetheless, the available pieces of information are sufficient to conclude about the origin of presented higher values of energy. Despite some visible spikes in Figure 6 the trend of the presented value is clear and its significant drop in the second half of the year 2014 could be caused by elimination of misalignment or unbalance problem of the high-speed shaft.
AStrion does not have any specific indicator for this type of fault, since it is designed as a multiple purpose method to work with any type of signal. Besides this fact, the change of energy is enough to depict the investigated shaft problem. The presented example shows that the AStrion methodology is able to cope with real-world malfunction of a wind turbine and the proposed kinematic association technique facilitates the interpretation of such results.
4. CONCLUSIONS
This paper proposes an automatic method for spectral patterns association with characteristic frequencies. It features in a two-step approach and is also adapted to the random variation of rolling-element bearings signature, which could vary due to a slippage phenomenon.
Fig. 4. Speed of high-speed shaft displayed for every investigated vibration signal.
Fig. 5. Tracking of fundamental order of series associated with high-speed shaft displayed for every investigated vibration signal.
Fig. 6. Tracking of energy of harmonic series associated with high-speed shaft of the investigated wind turbine.
The proposed method is automatic and is based on the results of a harmonic and sideband series detection which is performed without any a-priori information on the signal [14]. Thus, the presented signal-processing technique is suitable for automated and data-driven CMS.
The results presented show that the kinematic frequency association algorithm can carry out an efficient research of the characteristic frequencies of the mechanical components within previously detected spectral patterns. It is necessary to provide the kinematic configuration of the machine and the rotational speed of a reference shaft to obtain an outcome being a list of labelled harmonic and sideband series. The proposed method is able to expose a high-speed shaft problem in an automatic way and by a data-driven approach. The value of the presented example lays in a wind turbine which operates in ordinary highly non-stationary conditions.
In further work, and in the context of European Innovation Project KAStrion, the integration of the proposed algorithm into a commercial wind turbine CMS is scheduled. Moreover, next steps of AStrion methodology are under development in GIPSA-Lab, which includes an algorithm for automatic decision making. By proper fusion of all available information it will be possible to detect changes of tracked indicators and inform a user of a CMS about upcoming troubles at very early stage.
Acknowledgement
The authors would like to thank VALEMO for their involvement in the Innovation Project KAStrion which makes the wind turbine data available as well as CETIM which made possible to validate the method on test rig data.
The Innovation Project KAStrion has been supported by KIC InnoEnergy, which is a company supported by the European Institute of Innovation and Technology (EIT), and has the mission of delivering commercial products and services, new businesses, innovators and
entrepreneurs in the field of sustainable energy through the integration of higher education, research, entrepreneurs and business companies.
This work has been supported by French Research National Agency (ANR) through EITE program (project KAStrion ANR-12-EITE-0002-01).
REFERENCES
[1] García Márquez F. P., Tobias A. M., Pinar Pérez J. M., Papaelias M.: Condition monitoring of wind turbines: Techniques and methods, Renewable Energy, 46 (2012) pp. 169-178.
[2] Liu W., Tang B., Han J., Lu X., Hu N., He Z.: The structure healthy condition monitoring and fault diagnosis methods in wind turbines: A review, Renewable and Sustainable Energy
Reviews, 44 (2015) pp. 466-472.
[3] Agrawal K. K., Pandey P. G. N., Chandrasekaran K.: Analysis of the Condition Based Monitoring System for Heavy Industrial Machineries, Computational Intelligence and
Computing Research (ICCIC), 2013 IEEE International Conference on..
[4] Tian Z., Jin T.: Maintenance of wind turbine systems under continuous monitoring,
Proceedings – Annual Reliability and Maintainability Symposium, 2011.
[5] Yang W., Tavner P. J., Court R.: An online technique for condition monitoring the induction generators used in wind and marine turbines, Mechanical Systems and Signal
Processing, 38 (1) (2013) pp. 103-112.
[6] Tchakoua P.,Wamkeue R., Tameghe T. A., Ekemb G.: A review of concepts and methods for wind turbines condition monitoring, 2013
World Congress on Computer and Information Technology (WCCIT), 2 (1) (2013) pp. 1-9.
[7] Barszcz T., Strączkiewicz M.: Novel Intuitive Hierarchical Structure for Condition Monitoring System of Wind Turbines,
Diagnostyka, 14 (3) (2013) pp. 53-60.
[8] Hau E.: Wind Turbines: Fundamentals,
Technologies, Application, Economics,
Springer, 2006.
[9] McMillan D., Ault G.: Condition monitoring benefit for onshore wind turbines: sensitivity to operational parameters, Renewable Power
Generation, IET 2 (1) (2008) pp. 60-72.
[10] Buscarello R. T.: Practical Solutions to
Machinery and Maintenance Vibration Problems, Update International; Fourth revised
edition, 2002.
[11] Martin N., Mailhes C.: A non-stationary index resulting from time and frequency domains, in:
Sixth International Conference on Condition Monitoring and Machinery Failure Prevention Technologies. CM 2009 and MFPT 2009,
Dublin, Ireland, 2009.
[12] Mailhes C., Martin N., Sahli K., Lejeune G.: A spectral identity card, in: EUropean SIgnal
Processing Conference, EUSIPCO 06,
Florence, Italy, 2006.
[13] Mailhes C., Martin N., Sahli K., Lejeune G.: Condition monitoring using automatic spectral
analysis, in: Special session on "Condition
Monitoring of Machinery", Third European Workshop on Structural Health Monitoring, Structural Health Monitoring 2006, Granada,
Spain, 2006, pp. 1316-1323.
[14] Gerber T., Martin N., Mailhes C.: Identification of harmonics and sidebands in a finite set of spectral components, in: Tenth International
Conference on Condition Monitoring and Machinery Failure Prevention Technologies. CM 2013 and MFPT 2013, Kraków, Poland,
2013.
[15] Firla M., Li Z.-Y., Martin N., Barszcz T.: Automatic and Full-band Demodulation for Fault Detection - Validation on a Wind Turbine Test Rig, in: 4th International Conference on
Condition Monitoring of Machinery in Non-Stationary Operations (CMMNO'2014),
France, Lyon, 2014
[16] Gelman L., Kripak D., Fedorov V., Udovenko L.: Condition Monitoring Diagnosis Methods of Helicopter Units, Mechanical Systems and
Signal Processing, 14 (4) (2000) pp. 613-624.
[17] Randall R. B., Antoni J.: Rolling element bearing diagnostics – A tutorial, Mechanical
Systems and Signal Processing, 25 (2) (2011)
pp. 485-520.
[18] Randall R. B.: Vibration-based Condition
Monitoring, John Wiley & Sons, Ltd,
Chichester, UK, 2011.
[19] Fyfe K., Munck E.: Analysis of computed order tracking, Mechanical Systems and Signal
Processing, 11 (2) (1997) pp. 187-205.
[20] Li Z.-Y., Gerber T., Firla M., Bellemain P., Martin N., Mailhes C.: AStrion strategy: from acquisition to diagnosis. Application to wind turbine monitoring, in: Twelve International
Conference on Condition Monitoring and Machinery Failure Prevention Technologies. CM 2015, Oxford, United Kingdom, 2015.
[21] Gerber T., Martin N., Mailhes C.: Time-frequency Tracking of Spectral Structures Estimated by a Data-driven Method, IEEE
Transactions on Industrial Electronics, Special Section on: Condition Monitoring, Diagnosis, Prognosis, and Health Management for Wind Energy Conversion Systems, 62 (10) (2015)
pp. 6616-6626.
__________________________________________ Marcin FIRLA was granted the MS degree in 2011 from Faculty of Mechanical Engineering and Robotics of AGH – University of Science and Technology in Kraków. Currently, he is a PhD candidate at GIPSA-lab, University Grenoble Alpes (France). His research interest includes signal processing for condition monitoring and machine diagnosis.
Timothée GERBER was granted the Eng. degree in Signal and Image Processing from Grenoble Institute of Technology (Grenoble INP, France) in 2012. He is preparing his PhD degree in Signal Processing from the University Grenoble Alpes, France. His research activities are centred on data-driven fault diagnosis, time-frequency tracking and their applications in the field of renewable energy.
Pascal BELLEMAIN is a software development engineer at CNRS since 2001. He is currently with the control system department of GIPSA-lab, University Grenoble Alpes.
Nadine MARTIN was granted the MS degree in 1981 and the Ph.D. degree in 1984 both in Signal Processing and Control from Grenoble Institute of Technology (France). Currently, she is a senior researcher at the CNRS, National Center of Scientific Research (France), and in SAIGA, Signal and Automatic for surveillance, diagnostic and biomechanics, a team within GIPSA-lab, Grenoble Image Speech Signal and Automatic, Grenoble, France. She was project manager of KAStrion, a European KIC InnoEnergy project on current and vibration analysis for a preventive and predictive condition based maintenance in offshore wind farms.