Specificity of SPIO particles for
characterization of liver hemangiomas using
MRI
X. Montet,
1F. Lazeyras,
1N. Howarth,
1G. Mentha,
2L. Rubbia-Brandt,
3C. D. Becker,
1J.-P. Vallee,
1F. Terrier
11Division de Radiodiagnostic et de Radiologie Interventionnelle, Hoˆpital Universitaire de Gene`ve, 24, rue Micheli-du-Crest, 1211 Geneva 14, Switzerland
2Clinique et Policlinique de Chirurgie Digestive, Hoˆpital Universitaire de Gene`ve, 24, rue Micheli-du-Crest, 1211 Geneva 14, Switzerland
3Division de Pathologie Clinique, Hoˆpital Universitaire de Gene`ve, 24, rue Micheli-du-Crest, 1211 Geneva 14, Switzerland
Abstract
We investigated the specificity of superparamagnetic iron oxide (SPIO)– enhanced T1-weighted spin-echo (SE) mag-netic resonance (MR) images for the characterization of liver hemangiomas. When imaging liver hemangiomas, which are the most frequent benign liver tumors, a method with very high specificity is required, which will obviate other studies, follow-up, or invasive diagnostic procedures such as percu-taneous biopsy. Eighty-three lesions were examined by MR imaging at 1.5 T before and after intravenous injection of SPIO particles. Lesions were categorized as follows accord-ing to the final diagnosis: 37 hemangiomas, nine focal nod-ular hyperplasias (FNHs), 19 hepatocellnod-ular carcinomas (HCCs), and 18 metastases. Their signal intensity values were normalized to muscle and compared. The only lesions showing a significant increase in signal intensity ratio (lesion to muscle) on postcontrast T1-weighted SE images were hemangiomas (p ⬍ 0.001). The signal intensity ratio of hemangiomas increased on average by 70%. Based on re-ceiver operating characteristic analysis and using a cutoff level of 50% signal increase, the specificity and sensitivity of SPIO-enhanced MR imaging for the characterization of hemangiomas would be 100% and 70%, respectively. The T1 effect of SPIO particles can help differentiate hemangi-omas from other focal liver lesions such as FNHs, HCCs, and metastases and may obviate biopsy. When using SPIO particles for liver imaging, it is useful to add a T1-weighted sequence to T2-weighted images, thereby providing addi-tional information for lesion characterization.
Key words: Superparamagnetic iron oxide—Liver—Hem-angioma—Magnetic resonance imaging—Specificity
Hemangiomas are the most common benign liver tumor and, in the vast majority of cases, do not require surgical treat-ment [1]. It is therefore important that an imaging-based diagnosis can be made with high specificity to avoid unnec-essary complementary examinations or invasive procedures such as percutaneous biopsy or even surgery.
When using ultrasound (US), typical hemangiomas ap-pear as sharply delineated, hyperechoic lesions [2, 3]. In such cases, the diagnosis is easily made. It is more difficult in atypical hemangiomas or when there is a fatty liver, in which hemangiomas are frequently seen as iso- or even hypoechoic lesions [4]. US thus lacks characteristic features, and differentiating hemangiomas from other lesions, such as liver metastases, can be unreliable. Computed tomography (CT) has a good sensitivity for the diagnosis of hemangio-mas [5, 6]. However, hemangiohemangio-mas may have atypical fea-tures, for example, intense homogeneous arterial enhancement and early fading [7]. Hemangiomas larger than 3 cm in diameter or smaller than 1 cm rarely show typical enhancement [8]. Moreover, in oncologic patients, charac-terization of liver nodules is much more critical. Thus, whereas in the general population the diagnosis of heman-gioma is made accurately in 76% of cases, this percentage falls to 48% in patients with cancer [9].
Magnetic resonance imaging (MRI) has been proposed by many investigators [5] for the characterization of omas. MRI is quite sensitive for the detection of hemangi-omas. A T2-weighted sequence is mandatory for the characterization of liver hemangiomas. Moreover, the
Correspondence to: X. Montet; email: [email protected]
I
maging
heavier the T2 weighting of the sequence, the more reliable the differential diagnosis [10, 11]. The adjunction of a dy-namic gadolinium chelate-enhanced T1-weighted sequence increases the accuracy of the diagnosis of liver hemangiomas as compared with native T2-weighted images alone [12]. Nevertheless, the diagnostic accuracy of MRI for the char-acterization of liver hemangiomas has limitations. Shimizu et al. reported cases in which benign lesions were operated because of a diagnosis of malignancy [13]. On the one hand, in most of the patients, the lesions misinterpreted as malig-nant were hemangiomas and focal nodular hyperplasia (FNH). On the other hand, to call benign a malignant lesion can have deleterious consequences [14].
In this retrospective study, we evaluated the usefulness of superparamagnetic iron oxide (SPIO) particles for the char-acterization of hemangiomas. Several studies have demon-strated that SPIO particles improve detection of hepatocellular carcinoma (HCC) [15, 16] or metastasis by using their ability to be phagocytosed by Kupffer cells and to be clustered within them. In this situation, the r2 relaxivity of SPIO particles is very high, which leads to a decrease of T2* of liver parenchyma. However, one also can take advantage of their r1 relaxivity. As with other MRI contrast agents, the T1 effect of SPIO particles predominates at low concentra-tion, which is the case in hemangiomas, where SPIO parti-cles are diluted in the blood pool and are not clustered.
The aim of this study was to evaluate whether SPIO particles could distinguish hemangiomas from other focal liver lesions, with a focus on the specificity of the T1 effect of SPIO particles, and thus to confirm findings previously published in a pilot study [17].
Materials and methods
This study was performed after acceptance by the ethics committee of our institution. Forty-six patients with 83 focal liver lesions were studied with SPIO-enhanced MRI. Pa-tients were referred for MRI examination to our institution for characterization of focal liver nodules seen on US and/or CT in patients without previous history of cancer (n⫽ 30), assessment of liver metastases (n⫽ 7), or HCC (n ⫽ 9). All the consecutive examinations seen in MRI for liver lesion characterization were retrospectively retrieved by using the Radiology Information System of our department and the American College of Radiology coding system.
Standards of references (“gold standards”)
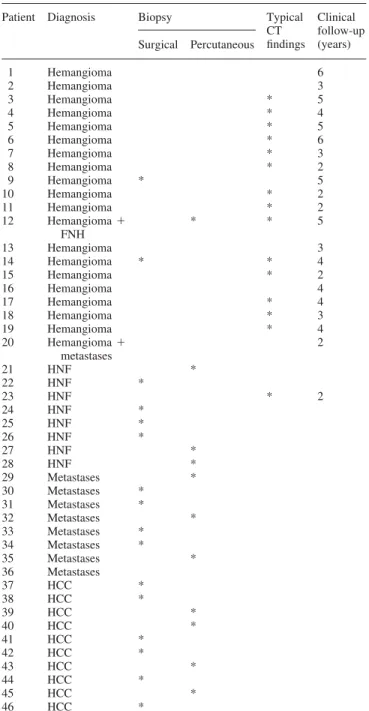
Based on the clinical files, including reports from the surgi-cal and the pathologic departments and radiologic examina-tions other than MRI, the cases were categorized as hemangiomas, FNHs, metastases, or HCCs.The following criteria, ordered according to decreasing weighting, were used for the classification of the lesions, as indicated in Table 1: surgical (or autopsy) and histologic findings, percutaneous biopsy and histologic findings,
typi-cal CT findings for hemangiomas and FNHs, clinitypi-cal fol-low-up for hemangiomas, FNHs, metastases, and HCCs.
The CT studies were independently analyzed by three radiologists who did not participate in the reading of the MRI examinations. CT findings were considered as typical, if all three radiologists reported them as such, according to the following criteria.
1. Hemangiomas: strong globular peripheral enhancement, isodense with the aortic blood, during the hepatic arterial
Table 1. Standards of referencea
Patient Diagnosis Biopsy Typical CT findings Clinical follow-up (years) Surgical Percutaneous 1 Hemangioma 6 2 Hemangioma 3 3 Hemangioma * 5 4 Hemangioma * 4 5 Hemangioma * 5 6 Hemangioma * 6 7 Hemangioma * 3 8 Hemangioma * 2 9 Hemangioma * 5 10 Hemangioma * 2 11 Hemangioma * 2 12 Hemangioma⫹ FNH * * 5 13 Hemangioma 3 14 Hemangioma * * 4 15 Hemangioma * 2 16 Hemangioma 4 17 Hemangioma * 4 18 Hemangioma * 3 19 Hemangioma * 4 20 Hemangioma⫹ metastases 2 21 HNF * 22 HNF * 23 HNF * 2 24 HNF * 25 HNF * 26 HNF * 27 HNF * 28 HNF * 29 Metastases * 30 Metastases * 31 Metastases * 32 Metastases * 33 Metastases * 34 Metastases * 35 Metastases * 36 Metastases 37 HCC * 38 HCC * 39 HCC * 40 HCC * 41 HCC * 42 HCC * 43 HCC * 44 HCC * 45 HCC * 46 HCC *
CT, computed tomography; FNH, focal nodular hyperplasia; HCC, hepa-rocellular carcinoma
phase, followed by centripetal filling during the portal venous phase and the delayed phase (the acquisition of the latter phase was not mandatory) [18, 19]
2. Focal nodular hyperplasias: strong enhancement of a well-defined (lobulated) lesion in the arterial phase with a hypodense central scar, followed by a rapid washout during the portal phase, so that the lesion was iso- or slightly hyperdense relative to normal liver; isodensity relative to normal liver and hyperattenuating central scar [5] during the delayed phase (the acquisition of the latter phase was not mandatory).
The clinical follow-up as criterion for lesion character-ization was evaluated in the following way.
1. Hemangiomas: no change in size over at least a 2-year period of a lesion, which on CT showed peripheral en-hancement without clear globular enen-hancement [20, 21] 2. Focal nodular hyperplasias: no change in size over at least
a 2-year period of a lesion, which on CT was hypervas-cular in the hepatic arterial phase and showed rapid washout in the portal-venous phase [5] but no central scar 3. Metastases: focal lesion increasing in size in a patient
with known malignancy
4. Hepatocellular carcinomas: focal lesion increasing in size in a patient with known cirrhosis
MRI examinations
These examinations were done on a 1.5-T Eclipse system (Marconi Medical Systems, Cleveland, OH, USA). The fol-lowing imaging sequences were used:
1. Spin echo (SE) T1-weighted (repetition time [TR]⫽ 480 ms, echo time [TE]⫽ 8 ms, field of view ⫽ 35–40 cm, matrix ⫽ 256 ⫻ 256, section thickness ⫽ 10 mm, one signal acquired). We used an SE T1-weighted sequence instead of a field echo sequence to minimize the T2* effect.
2. Fast SE (FSE) T2-weighted (TR⫽ 4660 ms, TE ⫽ 112 ms, echo train length ⫽ 8, field of view ⫽ 35–40 cm, matrix⫽ 512 ⫻ 512, section thickness ⫽ 10 mm, one or two signals acquired). The choice of a TE of 112 ms was dictated by a compromise between a long TE value for lesion characterization and an acceptable signal-to-noise ratio.
The same sequences were obtained before and after in-jection of SPIO particles (Ferumoxides, Endorem, Guerbet, Aulnay-sous-Bois, France) at a dose of 15mol Fe/kg body weight. For the administration of SPIO particles, the patients were taken out of the MRI unit. The contrast agent was perfused slowly over 30 min. The patients were then asked to return into the magnet for the second part of the examination. Care were taken to place the patients in the same position by using the laser device of the MR unit. The postcontrast
sequences were acquired between 1 and 1.5 h postinjection of SPIO particles.
Image analysis
The MR images were reviewed in conference by two radi-ologist (F.T., X.M.) who established a diagnosis in consen-sus. They were blinded to clinical information at the time of review. The number, localization, and morphologic aspect of the lesions were noted, especially whether they were hypo-, iso-, or hyperintense relative to liver parenchyma. In addi-tion, the signal intensity ratio of the lesion was calculated. The ratio refers to the intensity of the lesions divided by the signal intensity of the paraspinal musculature. Data are pre-sented as mean⫾ standard deviation.
We applied Student’s t tests to all our results, with p⬍ 0.05 considered statistically significance.
At the end of the study, using the signal intensity ratio on the precontrast T2-weighted and postcontrast T1-weighted sequences of all 83 lesions, we constructed receiver operat-ing characteristic (ROC) curves. On the curves, we deter-mined the point nearest to the upper right corner, corresponding to the best sensitivity and specificity couple of the test. We also calculated the area under the curve (AUC) and compared the curves of the precontrast T2-weighted and postcontrast T1-weighted sequences. Thus we could evaluate the use of SPIO-enhanced T1-weighted sequence with the nonenhanced T2-weighted sequence. The latter is the tradi-tional method for characterizing hemangiomas with MRI.
Results
The patients were grouped into the following categories, according to the criteria defined under Standards of Refer-ence (“Gold Standards”) (Table 1):
Categorization
HemangiomasThirty-seven hemangiomas were found in 20 patients. Pa-tients’ mean age was 49.5 (⫾ 10.2) years. The
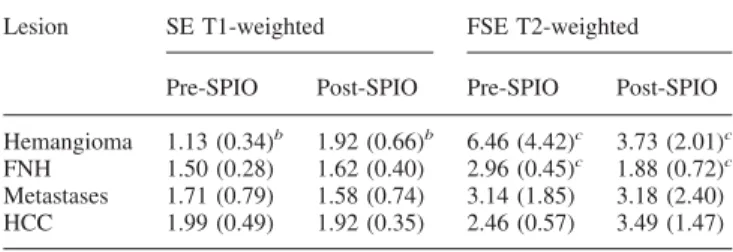
male-to-Table 2. Signal ratios of focal liver lesion on magnetic resonance imaging
sequencesa
Lesion SE T1-weighted FSE T2-weighted Pre-SPIO Post-SPIO Pre-SPIO Post-SPIO Hemangioma 1.13 (0.34)b 1.92 (0.66)b 6.46 (4.42)c 3.73 (2.01)c
FNH 1.50 (0.28) 1.62 (0.40) 2.96 (0.45)c 1.88 (0.72)c
Metastases 1.71 (0.79) 1.58 (0.74) 3.14 (1.85) 3.18 (2.40) HCC 1.99 (0.49) 1.92 (0.35) 2.46 (0.57) 3.49 (1.47)
aResults are given as mean (⫾ standard deviation) bp⬍ 0.001
cp⬍ 0.05
FNH, focal nodular hyperplasia; FSE, fast spin echo; HCC, hepatocellular carcinoma; SE, spin echo; SPIO, superparamagnetic iron oxide
female ratio was seven to 13. The mean size of the hemangiomas was 19.8 (⫾ 12.4) mm, with a range between 4 and 64 mm. The diagnosis was confirmed by surgical biopsies (n ⫽ 1, giant hemangioma with Kasabach-Merritt syndrome), typical CT findings (n ⫽ 13), or clinical fol-low-up (n⫽ 6; Table 1).
Focal nodular hyperplasias
Nine FNHs were found in eight patients. Patients’ mean age was 40 years (⫾ 12). The male-to-female ratio was two to six. The mean size of the FNHs was 33 mm (⫾ 12), with a range between 12 and 54 mm. The diagnosis was confirmed by surgical biopsy (n⫽ 4), percutaneous biopsy (n ⫽ 4), or clinical follow-up (n⫽ 1; Table 1).
Metastases
Eighteen metastases were found in eight patients. Patients’ mean age was 55 years (⫾ 15). The male-to-female ratio was six to two. The mean size of the metastases was 25 mm
(⫾ 15), with a range between 11 and 68 mm. The diagnosis was confirmed by surgical biopsy (n ⫽ 4), percutaneous biopsy (n⫽ 3), or clinical follow-up (n ⫽ 1; Table 1). Hepatocellular carcinomas
Nineteen HCCs were found in 10 patients. Patients’ mean age was 63 years (⫾ 11). The male-to-female ratio was eight to two. The mean size of the HCCs was 23 mm (⫾ 13), with a range between 7 and 49 mm. The diagnosis was confirmed by surgical biopsies (n⫽ 2), percutaneous biopsy (n ⫽ 3), or autopsy (n⫽ 4).
Quantitative analysis
The results of the quantitative analysis are summarized in Table 2.
Hemangiomas
On precontrast T1-weighted SE images, the hemangiomas appeared hypointense (Fig. 1) and sharply delineated, with a
Fig. 1. Hemangioma and FNH. A On the native T1-weighted SE sequence (TR, 480 ms; TE, 8 ms), the hemangioma
(ar-row) is strongly hypointense, the FNH (arrowhead) is almost
isointense with respect to the surrounding liver parenchyma.
B After injection of SPIO particles, the hemangioma becomes
highly hyperintense, but the FNH remains isointense. Note
the central hypointense scar in the FNH. C On the native T2-weighted FSE sequence (TR, 4660 ms; TE, 112 ms; echo train length, 8), the hemangioma is highly hyperintense, and the FNH is almost isointense. D After injection of SPIO par-ticles, both lesions show a signal drop.
signal-to-noise ratio of 1.13 (⫾ 0.34). On postcontrast T1-weighted SE images, hemangiomas became hyperin-tense, with a mean signal ratio of 1.92 (⫾ 0.66). Thus, the signal ratio showed an increase of 70% on average after SPIO, which was statistically highly significant (p ⬍ 0.001).
On T2-weighted FSE images, the hemangiomas were hyperintense on pre- and postcontrast images. Mean signal ratios on pre- and postcontrast images were 5.35 (⫾ 3.77) and 3.56 (⫾ 2.02), respectively. Thus, on postcontrast T2-weighted images, hemangiomas showed a significant signal drop of 50% (p⫽ 0.002).
Focal nodular hyperplasias
On precontrast T1-weighted SE images (Fig. 1), the FNHs were almost isointense to the liver. The mean signal ratio was 1.50 (⫾ 0.28). On postcontrast images, the FNHs re-mained almost isointense to the liver, and the mean signal ratio was 1.62 (⫾ 0.40). This corresponded to an increase of 8% (p not significant).
On T2-weighted FSE images, the FNHs appeared hyper-intense on pre- and postcontrast images. Mean signal ratios were 2.96 (⫾ 0.45) and 1.88 (⫾ 0.72) on T2-weighted pre-and postcontrast images, respectively. This represented a postcontrast signal drop of 36% (p⫽ 0.002).
Metastases
On precontrast T1-weighted SE images, the metastases ap-peared hypointense or isointense, with a mean signal ratio of 1.71 (⫾ 0.79). On postcontrast T1-weighted SE images, the mean signal ratio was 1.58 (⫾ 0.74), which was not signif-icantly different from the signal ratio on the precontrast image.
On T2-weighted FSE images, the metastases were hyper-intense on pre- and postcontrast images. The mean signal ratios were 3.14 (⫾ 1.85) and 3.18 (⫾ 2.40) on pre- and postcontrast images, respectively, with no significant differ-ence.
Hepatocellular carcinomas
On precontrast T1-weighted SE images, the HCCs appeared isointense or slightly hyperintense, with a mean signal ratio of 1.99 (⫾ 0.49). On postcontrast images, they appeared hyperintense, with a mean signal ratio of 1.92 (⫾ 0.35). This represented a nonsignificant signal drop of 3%.
On T2-weighted FSE images, the HCCs appeared hyper-intense before and after administration of SPIO. The mean signal ratios were 2.46 (⫾ 0.57) and 3.49 (⫾ 1.47) before and after contrast agent, respectively. This increase (42%) was nonsignificant.
Based on the ROC curves, a 100% specificity for the diagnosis of hemangioma on T1-weighted postcontrast
im-Fig. 2. ROC analysis based on pre- and postcontrast SE T1-weighted images. With a cutoff level of 50% signal increase, the specificity and sensitivity are 100% and 70%, respectively. The ROC analysis based on the T2-weighted sequence shows a smaller AUC than that of the T1-weighted sequence.
ages was obtained by using a cutoff value of a 50% signal intensity ratio increase. The corresponding sensitivity was 70% (Fig. 2).
A 100% specificity for the diagnosis of hemangioma on T2-weighted images was obtained by using a cutoff value of 10% of signal intensity ratio. The corresponding sensitivity was 17%.
The AUC calculated from the T1-weighted sequence (0.95) was superior to the AUC calculated from the T2-weighted sequence (0.86). Moreover, for each cutoff value, the sensibility and specificity of the postcontrast T1-weighted sequence were superior to those of the T2-weighted sequence.
Discussion
Hepatic hemangiomas have a prevalence between 3% and 5% in the general population, according to the literature [5, 9, 22]. Most hemangiomas are small, solitary, asymptomatic lesions that are discovered incidentally during imaging per-formed for other clinical indications. Our collective of pa-tients had 40% multiple hemangiomas, which is above the reported rate [8]. This result is likely due to the fact that, in the current study, the patients who underwent MRI had lesions not adequately characterized by other imaging stud-ies, especially CT. The presence of multiple lesions is typ-ically such a situation.
It is generally accepted that patients with a known extra-hepatic malignancy or patients at high risk for HCC should undergo imaging in addition to US to confirm or reject the diagnosis of hemangioma [20]. Commonly, this additional imaging procedure will entail enhanced CT or MRI, with the latter including T2-weighted images and a postgadolinium dynamic T1-weighted sequence. In a certain number of cases, these two methods do not allow a definite diagnosis [23, 24].
Several investigators have considered that the very high signal intensity of hemangiomas on T2-weighted images is sufficient for an accurate diagnosis, especially if a long TE in the range of 180 –200 ms, is used. Such long TEs are known to improve characterization of liver hemangiomas [25–27]. In our study, in which moderately T2-weighted sequences (TE⫽ 112 ms) were used, the intensity of hemangiomas was on average higher than that of other focal liver lesions, but with an important overlap of signal intensity between hem-angiomas and other focal lesions (Fig. 3). From the litera-ture, it is well known that, on the one hand, liver hemangiomas can have only moderate hypersignal on T2-weighted sequences. On the other hand, some metastases can be hyperintense on T2-weighted images [28]. Thus, intensity values on T2-weighted images lack specificity for differen-tiating hemangiomas from other focal liver lesions, espe-cially if only a moderately T2-weighted sequence is used
Fig. 3. Signal intensities of individual hemangiomas, metas-tases and HCCs (diamond shapes) and mean values (bars) on the T2-weighted FSE sequence (TR, 4660 ms; TE, 112 ms; echo train length, 8). There is an important overlap between signal intensities of these lesions. Note the decreased signal
intensity of hemangiomas postinjection of SPIO particles, thereby increasing the overlap in signal intensity with metas-tases and HCCs, which explains why the differential diagno-sis between hemangiomas and malignant tumors is even more difficult, if only postcontrast images are obtained.
[29]. Even if morphologic criteria are included, atypical hemangiomas are still difficult to characterize [28, 30].
Moreover, dynamic CT or MRI can be inconclusive, especially in cases of very small or very large hemangiomas. Thus, there is a need for a more specific method to establish a clear-cut diagnosis of liver hemangiomas and avoid biop-sies or even surgical exploration.
We expected that SPIO particles, which do not have the same type of behavior as iodinated contrast agent on CT, would provide additional information for the diagnosis of liver hemangiomas. When we started the current study, our MR unit did not have the technical requirements to cover the
liver completely with a T1-weighted sequence during the hepatic arterial phase. We hypothesized that the use of SPIO particles in association with an SE T1-weighted sequence, thus obviating a rapid image acquisition, could increase our confidence for the diagnosis of liver hemangiomas as com-pared with a T2-weighted sequence alone. Our results con-firmed our expectation.
The T2 effect of SPIO particles is well known [10, 31–35]. Because these particles decrease liver signal inten-sity on T2-weighted sequences and cause no signal change in lesions that lack Kupffer cells, they increase the lesion-to-liver contrast and improve lesion detection. Metastases and
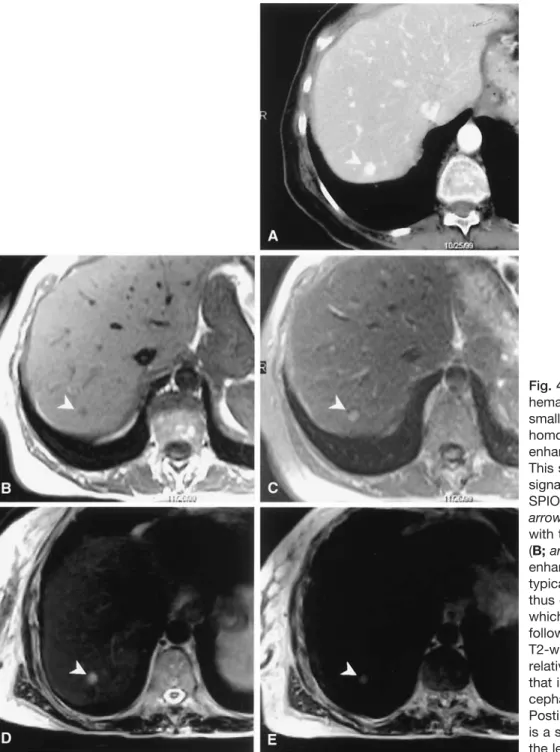
Fig. 4. Small hypervascular hemangioma. A CT shows a small focal lesion with homogeneous contrast enhancement (arrowhead). This small lesion shows a signal increase on the post-SPIO T1-weighted image (C;
arrowhead) as compared
with the precontrast image (B; arrowhead). This enhancement pattern is typical for hemangiomas, thus enabling the diagnosis, which was confirmed by follow-up. D The native FSE T2-weighted image shows a relatively hyperintense lesion that is less intense than the cephalospinal fluid. E Postinjection of SPIO, there is a signal intensity drop of the lesion.
HCCs usually do not take up SPIO particles because they lack Kupffer cells [16, 36, 37], although well-differentiated HCCs may contain Kupffer cells [38]. SPIO particles also have a potent r1 relaxivity, with a value of 23.7 mmol/s at 39.5°C and 20 MHz for ferumoxides. Therefore, even if the r2 relaxivity is higher than the r1 relaxivity (107 mmol/s in the same conditions), we can expect a non-negligible T1 effect of ferumoxides. This effect is dose
dependent and is observed at low concentrations [39]. In vivo, such an effect has been reported in hemangiomas on T1-weighted SE sequences [17] and has been confirmed in the present study by showing a high specificity for the diagnosis of liver hemangiomas. The T1 effect of SPIO particles is likely time dependent. Immediately after ad-ministration, large clusters of particles are circulating, thereby inducing a substantial T2 effect. Within minutes,
Fig. 5. Solitary hemangioma. CT scans of a solitary lesion in native (A), hepatic arterial phase (B), portal venous phase (C), and delayed phase (D) show one slightly hypervascular tumor without rapid washout. Corresponding T1-weighted se-quences before (E) and after (F) SPIO and T2-weighted
im-ages before (G) and after (H) SPIO. Note the enhancement of the lesion post-SPIO injection on the T1-weighted sequence. This lesion was diagnosed as hemangioma and confirmed at follow-up.
the larger particles are preferentially sequestered by the reticulo-endothelial system, whereas the smaller ones, responsible for the T1 effect, remain in circulation. How-ever, in our study, we did not evaluate this time depen-dency because the contrast medium was slowly perfused, and only late images were acquired (1–1.5 h postinjection of SPIO particles).
Hemangiomas are the only lesions that have statistically significant enhancement on SE T1-weighted sequences postinjection of SPIO particles. This increase was on average 70% in our study. A major advantage of using SPIO-en-hanced MRI for characterizing hemangiomas is that even atypical hemangiomas on CT can showed enhancement on T1-weighted SE images (Figs. 4 –7). In addition, the ROC
analysis showed that the optimized sensitivity and specificity couple is obtained when using a cutoff level of 50% signal increase. With this cutoff value, the specificity and sensitiv-ity are 100% and 70%, respectively. We focused on a test with excellent specificity to avoid unnecessary biopsies or surgical interventions. Moreover, the AUC of the T1-weighted sequence was higher than that of the native T2-weighted sequence, indicating a better accuracy of the SPIO-enhanced T1-weighted sequence, at least for the TE value we used. The use of a more heavily T2-weighted sequence might have produced better results, but, as previously men-tioned, we choose a TE of 112 ms as a compromise to obtain an acceptable signal-to-noise ratio. In our opinion, positive enhancement on a T1-weighted sequence postinjection of
Fig. 6. Multiple hypervascular hemangiomas. CT shows multiple small lesions in native (A), hepatic arterial phase (B), portal venous phase (C), and delayed phase (D). The three nodules are hypervascular without rapid washout. Corre-sponding T1-weighted images before (E) and after (F) SPIO
and T2-weighted images before (G) and after (H) SPIO. Note the enhancement of the lesions post-SPIO injection on the T1-weighted sequence. These lesions were diagnosed as hemangiomas and confirmed at follow-up.
SPIO particles is complementary to high signal intensity of hemangiomas on T2-weighted sequences for establishing an accurate diagnosis.
A major drawback of using SPIO particles is that the procedure is lengthy, if one performs pre- and postcontrast imaging. Nevertheless, we strongly believe that precontrast images are also required for accurate lesion characterization because they are needed to calculate the signal enhancement of a lesion. Visual evaluation or even measurement of lesion-to-liver contrast on post-SPIO particles T1-weighted images alone is not sufficient. It is necessary to measure the signal increase between pre- and postcontrast images: an enhance-ment greater than 50% is characteristic of hemangiomas. On T2-weighted sequences, signal intensity of hemangiomas is decreased postinjection of SPIO [40] (Fig. 3), thus making the differential diagnosis between hemangiomas and malig-nant lesion more difficult than on precontrast images.
In our institution, we now use SPIO particles routinely for the definitive characterization of liver hemangiomas when CT is inconclusive. Because of potential cardiac side effects and low back pain, ferumoxides cannot be injected as a bolus; therefore, a dynamic sequence cannot be performed. The advent of a new generation of SPIO particles (Resovist威, Schering, Germany), which can be injected as a bolus, has removed this major limitation. Dynamic sequences can now be acquired that combines the advantages of imaging in the vascular phase and the phase of uptake by the reticuloendothelial system for improved detection and characterization of focal liver lesions. Nevertheless, to our knowledge, there has been no study validating the usefulness of dynamic images using SPIO particles. The much shorter duration of the MR examination with Resovist is the most obvious advantage over Endorem.
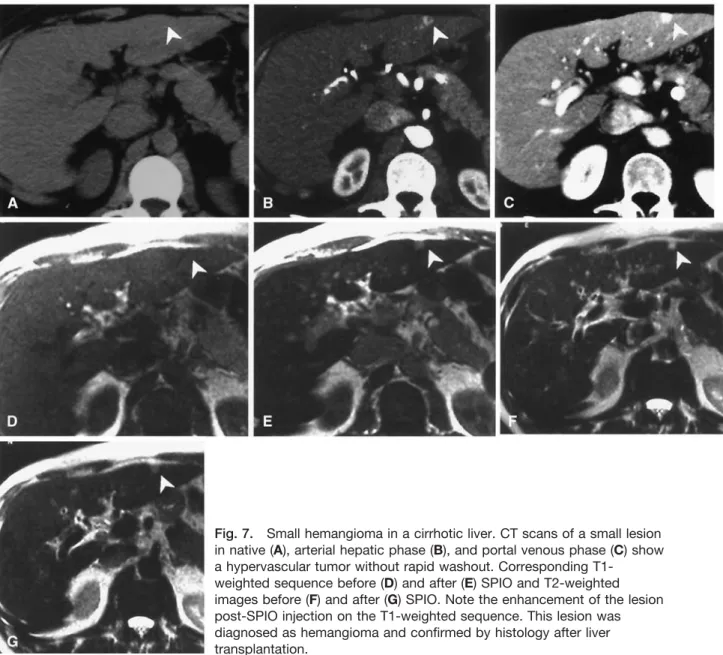
Fig. 7. Small hemangioma in a cirrhotic liver. CT scans of a small lesion in native (A), arterial hepatic phase (B), and portal venous phase (C) show a hypervascular tumor without rapid washout. Corresponding
T1-weighted sequence before (D) and after (E) SPIO and T2-T1-weighted images before (F) and after (G) SPIO. Note the enhancement of the lesion post-SPIO injection on the T1-weighted sequence. This lesion was diagnosed as hemangioma and confirmed by histology after liver transplantation.
In conclusion, when SPIO particles are used as a contrast agent for liver imaging, the addition of a T1-weighted se-quence is useful because it helps to characterize hemangio-mas and to differentiate them from other solid liver lesions.
Acknowledgments. The authors thank Dr Pierre Loubeyre and Dr Denis Mauget for their contribution to the analysis of the CT data. The authors also thank Prof. Alfredo Morabia for his help in the statistical analysis.
References
1. Bartolozzi C, Cioni D, Donati F, Lencioni R (2001) Focal liver lesions: MR imaging–pathologic correlation. Eur Radiol 11:1374 –1388 2. Kim KW, Kim TK, Han JK, et al. (2000) Hepatic hemangiomas:
spectrum of US appearances on gray-scale, power Doppler, and con-trast-enhanced US. Korean J Radiol 1:191–197
3. Harvey CJ, Albrecht T (2001) Ultrasound of focal liver lesions. Eur Radiol 11:1578 –1593
4. Marsh JI, Gibney RG, Li DK (1989) Hepatic hemangioma in the presence of fatty infiltration: an atypical sonographic appearance. Gas-trointest Radiol 14:262–264
5. Horton KM, Bluemke DA, Hruban RH, et al. (1999) CT and MR imaging of benign hepatic and biliary tumors. Radiographics 19:431– 451
6. Nino-Murcia M, Olcott EW, Jeffrey RB Jr. (2000) Focal liver lesions: pattern-based classification scheme for enhancement at arterial phase CT. Radiology 215:746 –751
7. Marti-Bonmati L, Casillas C, Graells M, Masia L (1999) Atypical hepatic hemangiomas with intense arterial enhancement and early fad-ing. Abdom Imaging 24:147–152
8. Vilgrain V, Boulos L, Vullierme MP, et al. (2000) Imaging of atypical hemangiomas of the liver with pathologic correlation. Radiographics 20:379 –397
9. Shamsi K, Deckers F, De Schepper A (1993) Is it a haemangioma?. Rofo Fortschr Geb Rontgenstr Neuen Bildgeb Verfahr 159:22–27 10. McFarland EG, Mayo-Smith WW, Saini S, et al. (1994) Hepatic
hem-angiomas and malignant tumors: improved differentiation with heavily T2-weighted conventional spin-echo MR imaging. Radiology 193:43– 47
11. Ito K, Mitchell DG, Outwater EK, et al. (1997) Hepatic lesions: discrimination of nonsolid, benign lesions from solid, malignant lesions with heavily T2-weighted fast spin-echo MR imaging. Radiology 204: 729 –737
12. Whitney WS, Herfkens RJ, Jeffrey RB, et al. (1993) Dynamic breath-hold multiplanar spoiled gradient-recalled MR imaging with gadolin-ium enhancement for differentiating hepatic hemangiomas from malignancies at 1.5 T. Radiology 189:863– 870
13. Shimizu S, Takayama T, Kosuge T, et al. (1992) Benign tumors of the liver resected because of a diagnosis of malignancy. Surg Gynecol Obstet 174:403– 407
14. Mentha G, Rubbia-Brandt L, Howarth N, et al. (1999) Management of focal nodular hyperplasia and hepatocellular adenoma. Swiss Surg 5:122–125
15. Poeckler-Schoeniger C, Koepke J, Gueckel F, et al. (1999) MRI with superparamagnetic iron oxide: efficacy in the detection and character-ization of focal hepatic lesions. Magn Reson Imaging 17:383–392 16. Reimer P, Jahnke N, Fiebich M, et al. (2000) Hepatic lesion detection
and characterization: value of nonenhanced MR imaging, superpara-magnetic iron oxide-enhanced MR imaging, and spiral CT-ROC anal-ysis. Radiology 217:152–158
17. Grangier C, Tourniaire J, Mentha G, et al. (1994) Enhancement of liver hemangiomas on T1-weighted MR SE images by superparamagnetic iron oxide particles. J Comput Assist Tomogr 18:888 – 896
18. Hanafusa K, Ohashi I, Himeno Y, et al. (1995) Hepatic hemangioma: findings with two-phase CT. Radiology 196:465– 469
19. Leslie DF, Johnson CD, Johnson CM, et al. (1995) Distinction between
cavernous hemangiomas of the liver and hepatic metastases on CT: value of contrast enhancement patterns. AJR 164:625– 629
20. Leifer DM, Middleton WD, Teefey SA, et al. (2000) Follow-up of patients at low risk for hepatic malignancy with a characteristic hem-angioma at US. Radiology 214:167–172
21. Gibney RG, Hendin AP, Cooperberg PL (1987) Sonographically de-tected hepatic hemangiomas: absence of change over time. AJR 149: 953–957
22. Yun EJ, Choi BI, Han JK, et al. (1999) Hepatic hemangioma: contrast-enhancement pattern during the arterial and portal venous phases of spiral CT. Abdom Imaging 24:262–266
23. Cieszanowski A, Szeszkowski W, Golebiowski M, et al. (2002) Dis-crimination of benign from malignant hepatic lesions based on their T2-relaxation times calculated from moderately T2-weighted turbo SE sequence. Eur Radiol 12:2273–2279
24. Kato H, Kanematsu M, Matsuo M, et al. (2001) Atypically enhancing hepatic cavernous hemangiomas: high-spatial-resolution gadolinium-enhanced triphasic dynamic gradient-recalled-echo imaging findings. Eur Radiol 11:2510 –2515
25. Outwater EK, Ito K, Siegelman E, et al. (1997) Rapidly enhancing hepatic hemangiomas at MRI: distinction from malignancies with T2-weighted images. J Magn Reson Imaging 7:1033–1039
26. McNicholas MM, Saini S, Echeverri J, et al. (1996) T2 relaxation times of hypervascular and non-hypervascular liver lesions: do hypervascular lesions mimic haemangiomas on heavily T2-weighted MR images?. Clin Radiol 51:401– 405
27. Itai Y, Ohnishi S, Ohtomo K, et al. (1987) Hepatic cavernous heman-gioma in patients at high risk for liver cancer. Acta Radiol 28:697–701 28. Lombardo DM, Baker ME, Spritzer CE, et al. (1990) Hepatic
heman-giomas vs metastases: MR differentiation at 1.5 T. AJR 155:55–59 29. Ohtomo K, Itai Y, Matuoka Y, et al. (1990) Hepatocellular carcinoma:
MR appearance mimicking cavernous hemangioma. J Comput Assist Tomogr 14:650 – 652
30. Soyer P, Dufresne AC, Somveille E, et al. (1998) Differentiation between hepatic cavernous hemangioma and malignant tumor with T2-weighted MRI: comparison of fast spin-echo and breathhold fast spin-echo pulse sequences. Clin Imaging 22:200 –210
31. Ward J, Naik KS, Guthrie JA, et al. (1999) Hepatic lesion detection: comparison of MR imaging after the administration of superparamag-netic iron oxide with dual-phase CT by using alternative-free response receiver operating characteristic analysis. Radiology 210:459 – 466 32. Taylor PM, Hawnaur JM, Hutchinson CE (1995) Superparamagnetic
iron oxide imaging of focal liver disease. Clin Radiol 50:215–219 33. Muller RD, Vogel K, Neumann K, et al. (1999) SPIO-MR imaging
versus double-phase spiral CT in detecting malignant lesions of the liver. Acta Radiol 40:628 – 635
34. Clement O, Siauve N, Cuenod CA, Frija G (1998) Liver imaging with ferumoxides (Feridex): fundamentals, controversies, and practical as-pects. Topics Magn Reson Imaging 9:167–182
35. Soyer P, Dufresne AC, Somveille E, Scherrer A (1997) Hepatic cav-ernous hemangioma: appearance on T2-weighted fast spin-echo MR imaging with and without fat suppression. AJR 168:461– 465 36. Duda SH, Laniado M, Kopp AF, et al. (1994) Superparamagnetic iron
oxide: detection of focal liver lesions at high-field-strength MR imag-ing. J Magn Reson Imaging 4:309 –314
37. Bellin MF, Zaim S, Auberton E, et al. (1994) Liver metastases: safety and efficacy of detection with superparamagnetic iron oxide in MR imaging. Radiology 193:657– 663
38. Imai Y, Murakami T, Yoshida S, et al. (2000) Superparamagnetic iron oxide-enhanced magnetic resonance images of hepatocellular carci-noma: correlation with histological grading. Hepatology 32:205–212 39. Chambon C, Clement O, Le Blanche A, et al. (1993)
Superparamag-netic iron oxides as positive MR contrast agents: in vitro and in vivo evidence. Magn Reson Imaging 11:509 –519
40. Vogl TJ, Hammerstingl R, Keck H, Felix R (1995) [Differential diag-nosis of focal liver lesions with MRI using the superparamagnetic contrast medium Endorem]. Radiologe 35:S258 –S266