HAL Id: hal-00296474
https://hal.archives-ouvertes.fr/hal-00296474
Submitted on 4 Mar 2008
HAL is a multi-disciplinary open access
archive for the deposit and dissemination of
sci-entific research documents, whether they are
pub-lished or not. The documents may come from
teaching and research institutions in France or
abroad, or from public or private research centers.
L’archive ouverte pluridisciplinaire HAL, est
destinée au dépôt et à la diffusion de documents
scientifiques de niveau recherche, publiés ou non,
émanant des établissements d’enseignement et de
recherche français ou étrangers, des laboratoires
publics ou privés.
aromatic hydrocarbons in ambient aerosols and from
motor-vehicle exhaust
A. Polidori, S. Hu, S. Biswas, R. J. Delfino, C. Sioutas
To cite this version:
A. Polidori, S. Hu, S. Biswas, R. J. Delfino, C. Sioutas. Real-time characterization of particle-bound
polycyclic aromatic hydrocarbons in ambient aerosols and from motor-vehicle exhaust. Atmospheric
Chemistry and Physics, European Geosciences Union, 2008, 8 (5), pp.1277-1291. �hal-00296474�
www.atmos-chem-phys.net/8/1277/2008/ © Author(s) 2008. This work is distributed under the Creative Commons Attribution 3.0 License.
Chemistry
and Physics
Real-time characterization of particle-bound polycyclic aromatic
hydrocarbons in ambient aerosols and from motor-vehicle exhaust
A. Polidori1, S. Hu1, S. Biswas1, R. J. Delfino2, and C. Sioutas11Department of Civil and Environmental Engineering, University of Southern California, 3620 South Vermont Ave., Los Angeles, CA, 90089, USA
2Epidemiology Division, Department of Medicine, University of California Irvine, 100 Theory Dr., Suite 100, Irvine, CA 92617, USA
Received: 30 October 2007 – Published in Atmos. Chem. Phys. Discuss.: 3 December 2007 Revised: 1 February 2008 – Accepted: 2 February 2008 – Published: 4 March 2008
Abstract. A photo-electric aerosol sensor, a diffusion charger, an Aethalometer, and a continuous particle counter were used along with other real-time instruments to char-acterize the particle-bound polycyclic aromatic hydrocarbon (p-PAH) content, and the physical/chemical characteristics of aerosols collected a) in Wilmington (CA) near the Los Angeles port and close to 2 major freeways, and b) at a dy-namometer testing facility in downtown Los Angeles (CA), where 3 diesel trucks were tested. In Wilmington, the p-PAH, surface area, particle number, and “black” carbon concentra-tions were 4-8 times higher at 09:00–11:00 a.m. than between 17:00 and 18:00 p.m., suggesting that during rush hour traf-fic people living in that area are exposed to a higher num-ber of diesel combustion particles enriched in p-PAH coat-ings. Dynamometer tests revealed that the p-PAH emissions from the “baseline” truck (no catalytic converter) were up to 200 times higher than those from the 2 vehicles equipped with advanced emission control technologies, and increased when the truck was accelerating. In Wilmington, integrated filter samples were collected and analyzed to determine the concentrations of the most abundant p-PAHs. A correla-tion between the total p-PAH concentracorrela-tion (µg/m3) and the
measured photo-electric aerosol sensor signal (fA) was also established. Estimated ambient p-PAH concentrations (Av-erage=0.64 ng/m3; Standard deviation=0.46 ng/m3) were in
good agreement with those reported in previous studies con-ducted in Los Angeles during a similar time period. Finally, we calculated the approximate theoretical lifetime (70 years per 24-h/day) lung-cancer risk in the Wilmington area due to inhalation of multi-component p-PAHs and “black” carbon. Our results indicate that the lung-cancer risk is highest dur-ing rush hour traffic and lowest in the afternoon, and that the
Correspondence to: C. Sioutas
genotoxic risk of the considered p-PAHs does not seem to contribute to a significant part of the total lung-cancer risk attributable to “black” carbon.
1 Introduction
Polycyclic aromatic hydrocarbons (PAHs) are ubiquitous in the urban atmosphere and are typically produced from in-complete combustion of fossil fuels and organic compounds, or from high temperature pyrolytic processes involving any materials containing carbon and hydrogen (Bostrom et al., 2002). Important sources of PAHs include gasoline- and diesel-fuelled motor vehicles, biomass burning of agricul-tural and forest fuels, coal combustion, cigarette and wood smoke, and fossils fuels. Atmospheric PAHs are found in the gas-phase (if characterized by high vapor pressures) and in the particulate phase (if their vapor pressures is relatively low), or can partition between the gas- and the particle-phases (Naumova et al., 2003). However, most PAHs, es-pecially those with more than four aromatic rings, readily adsorb onto combustion aerosols (Harrison et al., 1996), and are predominantly associated with particles with an aerody-namic diameter smaller than 1–2 µm (Chetwittayachan et al., 2002).
The U.S. EPA has recently defined a list of 16 “Prior-ity PAH Pollutants” based on their mutagenic“Prior-ity and car-cinogenicity (IARC, 2005). For example, benzo (a) pyrene has been classified as a Group 1 carcinogen (“carcinogenic to humans”) and cyclopenta (cd) pyrene, dibenz (a, h) an-thracene and dibenzo (a, l) pyrene as Group 2 carcinogens (“probably carcinogenic to humans”). Fine and ultrafine par-ticles (and, thus, the PAHs bound to them) can penetrate deeply into the bronchial and pulmonary part of the human respiratory system, where their deposit and accumulation
has been associated with short and long term health effects (Pope et al., 2002; 2004). Along with certain transition met-als, PAHs and other organic hydrocarbons (e.g. quinones) have the potential to interact with airway epithelial cells and macrophages to generate reactive oxygen species (ROS), which have been linked to respiratory inflammation and other adverse health effects (Cho et al., 2005; Nel, 2005).
The detection of particle-bound PAHs (p-PAHs) has gen-erally been accomplished through analytical procedures in-volving the collection of high mass loadings of particulate matter (PM) on filters, followed by analysis of the filter ex-tract by mass spectrometry coupled with gas or liquid chro-matography (GC/MS or LC/MS) (Schauer et al., 1996; Nau-mova et al., 2003). However, these methods require a labo-rious sample preparation, resolve only a fraction of the total PAH mass and, due to the amounts of PM that need to be collected to overcome analytical limits of detection, can only provide average atmospheric p-PAH concentrations with low time resolutions (e.g., from several hours to a day). Because the processes leading to the production of PAHs are dynamic and occur on the time scale of minutes to a few hours, it is important to monitor their temporal variation in much shorter time intervals.
The photoelectric aerosol sensor (PAS) has been used alone or in conjunction with other continuous instruments to provide information on p-PAH emissions in indoor and outdoor environments (Zhiqiang et al., 2000; Dunbar et al., 2001; Chetwittayachan et al., 2002; Wallace, 2005; Ott and Siegman, 2006), and from specific sources such as motor ve-hicles (Matter et al., 1999; Marr et al., 2004; Kelly et al., 2006), commercial and jet aircrafts (Herndon et al., 2005; Rogers et al., 2005), tobacco products, incense and candles, cooking sources, wood smoke and fireplaces (Ferge et al., 2005; Ott and Siegman, 2006). The PAS, the diffusion charg-ing (DC) sensor, and the condensation particle counter (CPC) (all real-time particle instruments with a resolution <10-s) have often been employed together to determine the rela-tive fraction of nuclei versus accumulation mode particles in ambient combustion aerosols (Bukowiecki et al., 2002). The ratio between the PAS and the DC signals (PAS/DC) is of particular interest, because it provides a measure of the amount of p-PAHs per unit area of the active surface of par-ticles (Ott and Siegman, 2006). Thus, the PAS/DC ratio may be directly related to the quantity of p-PAHs transported into the human respiratory tract. In a recent study conducted in the Mexico-City metropolitan area by Marr et al. (2006) an Aerodyne Aerosol Mass Spectrometer (AMS; Jimenez et al., 2003) was used for the first time to measure ambient con-centrations of p-PAHs. The diurnal concentration patterns captured by aerosol photo-ionization (a PAS was run along-side the AMS) and aerosol mass spectrometry were generally consistent.
Motor vehicles account for as much as 90% of the p-PAH mass in the urban air of big metropolitan areas (Harrison et al., 1996; Bostrom et al., 2002). Thus, PAH levels could
be significantly reduced by developing air pollution control strategies targeted at motor vehicles and, in particular, diesel trucks and older passenger cars that are not equipped with catalytic converters. To develop such PAH emissions reduc-tion strategies, reliable informareduc-tion on the types and num-bers of vehicles operating in urban areas, and on the PAH emissions rates for each vehicle type are needed. Obtaining representative measures of PAH emissions rates is difficult because this parameter is a function of the engine type, the state of repair of the engine, and the motor vehicle driving conditions (Schauer et al., 1999; 2002; Zielinska et al., 2004; Riddle et al., 2007a; 2007b).
In the present study, PAS, DC, CPC and other real-time measurements were taken: a) in Wilmington (CA), an area near the Los Angeles port and b) at the California Air Re-sources Board (CARB) Heavy-Duty Diesel Emissions Test Laboratory (HDETL), a dynamometer testing facility in downtown Los Angeles (CA). The ambient air in Wilming-ton is heavily influenced by a mix of industrial and gasoline-/diesel-fuelled vehicle emissions. On the other hand, the dy-namometer tests enabled us to characterize the exhausts of several individual types of diesel trucks, equipped with ferent emission control technologies, and operated under dif-ferent driving conditions. The chemical composition, active surface area, and particle number concentrations measured by the PAS, DC, and CPC (respectively) were combined to provide information on the chemical and physical character-istics of the studied aerosols. These results were comple-mented with measurements of the particle size distribution and of the black carbon (BC) aerosol content to obtain fur-ther insights on the p-PAHs emitted by motor vehicles and other sources. Integrated 24-h Teflon filter samples were also collected in Wilmington, solvent extracted and analyzed by GC/MS to determine the relative concentrations of the most abundant p-PAHs found at the urban site. These outcomes were then used to establish a correlation between the total p-PAH concentration and the measured PAS signal (from fA to µg/m3). Finally, we determined the approximate
theo-retical lifetime (70 years per 24-h/day) lung-cancer risk in the Wilmington area due to inhalation of multi-component p-PAHs and BC by following a procedure that considers the benzo (a) pyrene equivalent concentration (B(a)Peq), and BC as a surrogate for diesel combustion particle exposure (Sauvain et al., 2003).
2 Experimental methods
2.1 Ambient sampling – the Wilmington site
The first part of this study was conducted in Wilmington (CA), an urban area about 40 Km south of downtown Los Angeles. The sampling site was located in one of the bus-iest parts of the Los Angeles port, less than 1.5 Km east of the Harbor freeway (I-110), about 4.5 Km west of the Long
Beach Freeway (I-710), and close to several industrial facil-ities, such as power plants and oil refineries. The I-110 runs southbound through the Harbor Gateway, a two-mile wide north-south corridor that was annexed by the city of Los An-geles specifically to connect San Pedro, Wilmington and the port of Los Angeles with the rest the city. Both freeways are the principal means for transferring freight from the port of Los Angeles to rail yards and warehouses further inland, and they are notoriously congested, especially during rush hour traffic. Although the majority of the I-710 freeway traf-fic is comprised of light duty gasoline-powered cars, about 15–20% of the total number of vehicles is typically repre-sented by heavy duty diesel powered trucks (Ntziachristos et al., 2007a, 2007b) which are expected to be major sources of combustion related pollutants, including BC and semi-volatile and p-PAHs.
Our sampling station was set up inside a 10-m long mo-bile trailer provided by the South Coast Air Quality Man-agement District (AQMD) with a few instruments deployed inside a rigid enclosure situated right outside the trailer. All continuous data were collected during an intensive field cam-paign conducted between 1 May and 29 May 2007. A photo-electric aerosol sensor (PAS; model PAS2000CE; EcoChem Analytics, Murrieta, CA) and a Nano-particle Surface Area Monitor (NSAM; Model 3550, TSI Inc., Shoreview, MN) were used to monitor the temporal variation of p-PAHs and the particle active surface, respectively, with a time resolu-tion ≤10-s. The principle of operaresolu-tion of the PAS and of the NSAM, which is essentially a diffusion charger, (Ntzi-achristos et al., 2007c) is very similar. The fundamental difference between the two is the particle charging mecha-nism: the PAS employs photo-ionization by mean of ultravi-olet light (Niessner, 1986; Matter et al., 1999; Jung and Kit-telson, 2005), whereas the NSAM utilizes diffusion charging through a corona discharge (Fissan et al., 2007; Ntziachris-tos et al., 2007c). In both instruments, positively charged particles are collected on a filter, generating a current that is measured by an electrometer (for technical details see Matter et al., 1999, and Ntziachristos et al., 2007c). Previous studies have demonstrated that the PAS is most sensitive to p-PAHs deposited/bound on the particle surface and less responsive to those covered by layers of other aerosol compounds (Marr et al., 2004, 2006). The NSAM has been designed and cali-brated by the manufacturer to provide a signal (in fA) whose intensity is directly proportional to the human lung-deposited surface area of particles (a calibration constant is used to con-vert fA to µm2/cm3).
A dual-beam Aethalometer (Anderson RTAA-900, Ander-sen Instruments Inc.) was used to determine PM2.5 BC con-centrations with a time interval of 5-min. This instrument uses the optical attenuation of 880 nm wavelength light to measure the BC mass concentration as particles are collected on a quartz fiber filter strip. Continuous (1-min) ambient particle number (PN) concentrations were measured using a condensation particle counter (CPC, model 3022A, TSI
Inc., Shoreview, MN) that was serviced and calibrated by the manufacturer prior the beginning of this study. Wind di-rection/speed, temperature and humidity were recorded with a weather station (Wizard III, Weather Systems Company, San Jose, CA, USA). For comparison purposes, 1-h averages were calculated from all continuous data.
A few studies have revealed a good correlation between the PAS signal (also in fA) and the concentration of 11– 15 of the most abundant p-PAHs on concurrently collected aerosols samples (McDow et al., 1990; Hart et al., 1993; Siegmann and Siegmann, 2000; Chetwittayacha et al., 2002). The correlation between the PAS response and the PAH con-centration is generally very high (R2≥0.80) for a wide vari-ety of sources, including: oil burner exhaust, parking garage air, cigarette smoke, burners, and urban aerosols, indicat-ing that it is possible to calibrate the PAS signal to estimate p-PAH concentrations in several environments. However, since different locations are characterized by a different mix of PAH sources, the calibration of the PAS is site-specific and time dependent. The sensor’s response has also been reported to be linearly correlated (R2=0.82) with bacterial genotoxicity (Wasserkort et al., 1996).
From 11 June to 24 June 2007, we collected 10 daily (24-h) integrated ambient PM2.5filter samples at the Wilmington site by using only the 2.5 µm cutpoint stage and the after fil-ter of a Micro-Orifice Uniform Deposit Impactors (MOUDI, MSP, Inc., Minneapolis, MN) operating at 30 lpm. All im-paction substrates (37 mm PTFE Teflon filters; 2 mµm pore, Gelman Science, Ann Arbor, MI) were used as provided by the manufacturer without any pre-treatment. Each integrated filter sample was extracted with solvents and analyzed by GC/MS for the concentration of the most abundant p-PAHs typically found in urban environments. Details about sample preparation and GC/MS analysis have been previously de-scribed by Sheesley et al. (2000, 2004). The PAS signal (fA) measured in Wilmington was then calibrated against the sum of the detected p-PAH concentrations (ng/m3). From a simi-lar calibration procedure, Marr et al. (2004, 2006) estimated the uncertainty of the PAS response to be around 20%. 2.2 Motor-vehicle emissions sampling – the CARB
dy-namometer facility
The second part of this work was conducted at the California Air Resource Board-Heavy-Duty Emissions Testing Labora-tory (CARB-HDETL), located at the Los Angeles Metropoli-tan Transportation Authority (MTA) in downtown Los An-geles. The sampling train included heavy-duty dynamome-ter chassis, constant volume sampling (CVS) dilution tunnel, and aerosol samplers. Details about this facility and its oper-ation are described elsewhere (Ayala et al., 2002).
With the exception of the “baseline” vehicle (not equipped with any catalytic converter) the other 2 tested heavy duty diesel trucks, a Vanadium-based SCRT vehicle and a Zeolite-based SCRT truck, were equipped with advanced emission
Fig. 1. Average hourly diurnal profiles of the photoelectric aerosol
sensor (PAS) and nano-particle surface area monitor (NSAM) sig-nals (a), and of the black carbon (BC) and particle number (PN) concentrations (b) measured at the Wilmington site in May 2007.
control technologies that allowed them to meet the state of California 2007 PM and 2010 NOx emission standards. SCRT is an integrated system of selective catalytic reduc-tion (SCR) and continuously regenerating trap (CRT) de-signed to reduce both PM and NOx emissions. Details about all 3 vehicles are reported in Table 1. Similarly to the Wilmington (outdoor) site, several real-time instruments were employed to fully characterize the motor-vehicle emis-sions downstream of the CVS. PN concentration data was obtained by using a CPC (Model 3025A, TSI Inc., Shore-view, MN), while the particle size distribution was mea-sured by an Engine Exhaust Particle Sizer (EEPS 3090, TSI Inc., Shoreview, MN) and a differential mobility spectrome-ter (DMS 500, Cambustion Ltd., Cambridge, UK). The EEPS and DMS measured the particle size distribution in the size range from 5.6 nm to 560 nm and from 5 nm to 1000 nm, respectively. The physical (surface area) and chemical (p-PAHs) characteristics of the particles in the exhausts of the tested vehicles were monitored by an Electrical Aerosol De-tector (EAD 3070A, TSI Inc., Shoreview, MN) and a Pho-toelectric Aerosol Sensor (PAS 2000CE, EcoChem), respec-tively. Additional measurements (not discussed in the current work) included PN and PAH concentrations of the volatile fraction of the emissions by mean of a different CPC (Model 3022 A, TSI Inc., Shoreview, MN) and PAS (Model 2000, EcoChem), respectively, located downstream of 2 thermal denuders.
All vehicles were tested under two different driving cy-cles (well defined speed versus time traces, usually displayed on a computer monitor, which the driver attempts to fol-low) to simulate various real world conditions: 1) steady-state cruise, and 2) transient. During steady-steady-state cruise tests, the vehicles were operated at a speed of 50 mph for 45 min, whereas in a transient cycle they were driven through a series
of accelerations and decelerations runs at different time inter-vals, according to the Urban Dynamometer Driving Sched-ules (UDDS) for heavy-duty vehicles (see “Code of Fed-eral Regulations” for details). Each cycle was repeated until the collection substrates were loaded with enough mass for chemical and toxicological analysis. Ultra-low sulfur diesel (ULSD) with a sulfur content <15 ppm (provided by BP) was used as test fuel.
3 Results
3.1 Descriptive analysis
As shown in Fig. 1a and b, the average hourly diurnal profiles of the PAS, NSAM, BC and PN concentration data collected in Wilmington were very similar. All ambient measurements peaked during morning rush hour traffic because of increased motor-vehicle emissions from both light and heavy duty ve-hicles, reached a minimum late in the afternoon, and slightly increased again at night because of a lowered mixing height, increased atmospheric stability, and possible condensation of the most volatile species (e.g. organic vapors from ve-hicles’ exhausts) onto the existing particles due to temper-ature decrease. The PAS and NSAM signals and the PN and BC concentrations were 4 to 8 times higher between 09:00 and 11:00 a.m. than at 17:00–18:00 p.m., indicating that dur-ing traffic periods commuters are exposed to a substantially higher number of combustion particles enriched in p-PAH coatings. Similar results were obtained by Ning et al. (2007) at a typical urban site in the Los Angeles area, where the atmospheric concentrations of organic species such as alka-nes, hopanes and steraalka-nes, and p-PAHs were up to 6 times higher during traffic periods than throughout the rest of the day. These findings are important given the mutagenicity and carcinogenicity of these organic compounds.
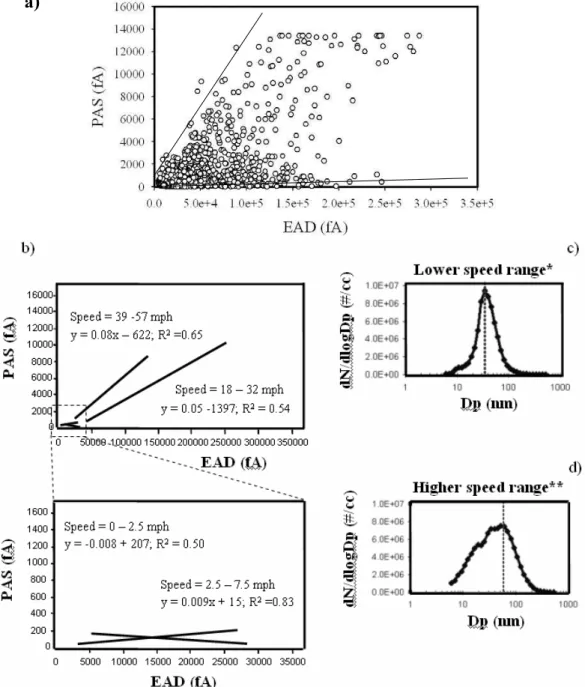
The physical and chemical characteristics of particles emitted by motor vehicles are highly dependent on the age and type of car/truck (gasoline- or diesel-fuelled), the pres-ence or abspres-ence of emission control technology, and the driv-ing conditions (engine load) (Zielinska et al., 2004; Riddle et al., 2007a, 2007b). Figure 2 shows time series of the PAS and EAD (DC) signals for the “baseline” (2a) and the Zeolite-based SCRT vehicles (2b) operated in UDDS mode; both trucks are diesel-fuelled, although the former is not equipped with any type of catalytic trap. The inverse correlation be-tween PAS and EAD signals observed in Figure 2b suggests that, although the Zeolite-based SCRT exhaust was domi-nated by photo-emitting material, at times the production of particles with a very high active surface area (corresponding to the EAD peaks) suppressed the PAS response. In con-trast, the PAS and EAD signals of the “baseline” vehicle (2a) were very well correlated at all times, indicating that its emis-sions (much higher than those from the Zeolite-based SCRT truck) were characterized by the presence of relatively large
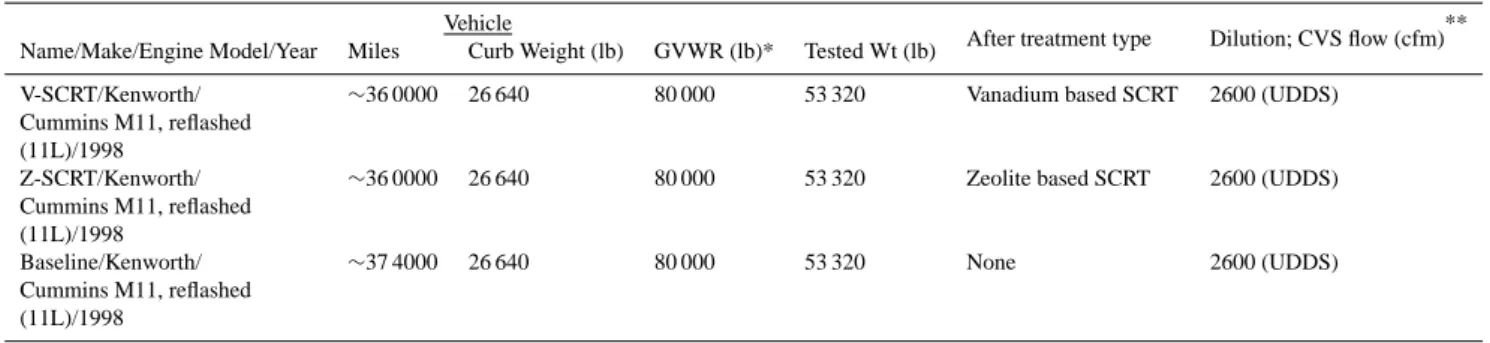
Table 1. Details about the 3 tested diesel trucks: Vanadium-based SCRT (V-SCRT), Zeolite-based SCRT (Z-SCRT), and “Baseline” vehicles.) Vehicle
After treatment type Dilution; CVS flow (cfm)** Name/Make/Engine Model/Year Miles Curb Weight (lb) GVWR (lb)* Tested Wt (lb)
V-SCRT/Kenworth/ ∼36 0000 26 640 80 000 53 320 Vanadium based SCRT 2600 (UDDS)
Cummins M11, reflashed (11L)/1998
Z-SCRT/Kenworth/ ∼36 0000 26 640 80 000 53 320 Zeolite based SCRT 2600 (UDDS)
Cummins M11, reflashed (11L)/1998
Baseline/Kenworth/ ∼37 4000 26 640 80 000 53 320 None 2600 (UDDS)
Cummins M11, reflashed (11L)/1998
*GVWR: gross vehicle weight rating. Maximum allowable total weight of the vehicle/loaded trailer on the road. *Dilution flow through the constant volume sampler (CVS) (total volume of mixture air in the CVS).
a) 13:30 13:35 13:40 13:45 S pe ed (m ph) 0 20 40 60 UDDS x 1
"Baseline" (Diesel) - UDDS
P A S (fA ) 0 4000 8000 12000 16000 E A D (fA ) 0 1e+5 2e+5 3e+5 4e+5 PAS EAD b) 08:39 08:49 08:59 09:09 S pe ed (m ph) 0 20 40 60
Zeolite-SCRT (Diesel) - UDDS
P A S ( fA ) 0 20 40 60 80 100 E A D (fA ) 0 1e+4 2e+4 3e+4 4e+4 5e+4 6e+4 PAS EAD UDDS x 2
Fig. 2. Time series of the PAS and EAD signals (fA) for the
“base-line” (a) and the Zeolite-based SCRT (b) vehicles, both operating in UDDS mode. Speed profiles during typical UDDS cycles are also reported.
particles coated with one or more layers of photo-emitting material (e.g. p-PAHs). Further details about the dynamome-ter test results are discussed in the following sections.
3.2 Correlations among the responses of various instru-ments
PAS versus DC plots are convenient ways to identify the characteristic properties of different types of combustion aerosols such as diesel particles, cigarette smoke, candle smoke, wood fire, etc. (Matter et al., 1999; Bukowiecki et al., 2002; Ott and Siegman, 2006). Since the responses of both instruments are a function of the aerosol surface area concentration, the slope of the regression line of these plots is related to the capability of the surface to undergo photo-electric charging, which depends on the nature of the surface material. Typically, the presence of a high concentration of nucleation mode particles (diameter <50 nm) results in a low PAS signal because these are non-photo emitting (Matter et al., 1999; Baltensperger et al., 2002); thus a low (or even neg-ative) slope for the PAS versus DC plot is obtained in this sit-uation. On the other hand, when the aerosol size distribution is dominated by accumulation mode particles (in the context of emissions testing usually defined as particles with an aero-dynamic diameter >50–60 nm) such as diesel emissions, a highly positive slope is obtained. The presence of aged accu-mulation mode particles in the analyzed aerosol also tends to suppress the PAS signal, because these are generally coated with condensable species with weak photo-emitting proper-ties, such as sulfate, nitrate and certain semi-volatile hydro-carbons (Bukowiecki et al., 2002).
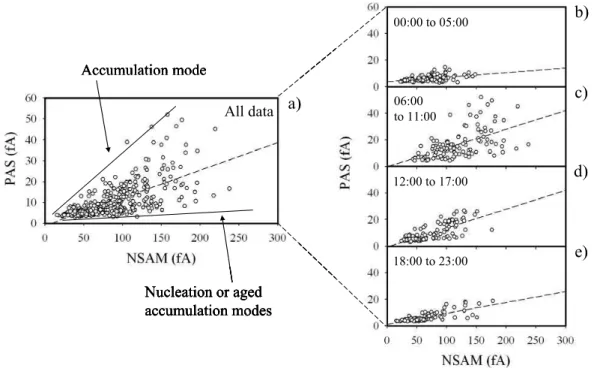
As shown in Fig. 3a, the PAS versus NSAM plot ob-tained in Wilmington is characterized by measurements that are continuously distributed between two boundaries. This indicates the presence of both nucleation/aged accumula-tion mode (lower boundary) and fresh accumulaaccumula-tion mode (upper boundary) particles; the majority of data-points was scattered in between. This situation is typical of any ur-ban environment and has been observed in previous stud-ies conducted in the US (Bukowiecki et al., 2002; Ott and Siegman, 2006) and in other countries (Chetwittay-achan et al., 2002; Marr et al., 2004). Analysis of the slopes from the linear regressions of time-segregated PAS
Accumulation mode Nucleation or aged accumulation modes All data 06:00 to 11:00 12:00 to 17:00 18:00 to 23:00 00:00 to 05:00
a)
e)
d)
c)
b)
Accumulation mode Nucleation or aged accumulation modes All data 06:00 to 11:00 12:00 to 17:00 18:00 to 23:00 00:00 to 05:00 Accumulation mode Nucleation or aged accumulation modes Accumulation mode Nucleation or aged accumulation modes All data 06:00 to 11:00 12:00 to 17:00 18:00 to 23:00 00:00 to 05:00a)
e)
d)
c)
b)
Fig. 3. PAS vs NSAM plots considering all measurements obtained at the Wilmington site in May 2007 (a), and the corresponding
time-segregated data (b to e). Regression equations and correlation coefficients (R2) were: (a) y=0.13×–1.03, R2=0.47; (b) y=0.04×+3.69, R2=0.21; (c) y=0.14×–0.18, R2=0.31; (d) y=0.14×–0.59; R2=0.57; (e) y=0.08×+1.14, R2=0.60.
e)
d)
c)
b)
a)
All data 06:00 to 11:00 12:00 to 17:00 18:00 to 23:00 00:00 to 05:00e)
d)
c)
b)
a)
All data 06:00 to 11:00 12:00 to 17:00 18:00 to 23:00 00:00 to 05:00Fig. 4. PAS vs BC plots considering all measurements obtained at the Wilmington site in May 2007 (a), and the corresponding
time-segregated data (b to e). Regression equations and correlation coefficients (R2) were: (a) y=5.31×+2.48, R2=0.86; (b) y=3.62×+3.23, R2=0.69; (c) y=5.44×+2.52, R2=0.82; (d) y=5.27×+2.99; R2=0.86; (e) y=4.04×+3.29, R2=0.84.
18:00 to 23:00 p.m. (Fig. 3e) (Slope(18:00−23:00)=0.08) were likely to be dominated by aged accumulation mode parti-cles covered with non-photo emitting material (e.g. nitrate, sulfate, water, hydrocarbons, etc.) and, to a lesser ex-tent, nucleation mode particles. Conversely, an increase in the regression slopes observed in Fig. 3c and d suggests that aerosols produced during rush hour traffic (06:00 to 11:00 a.m.) (Slope(06:00−11:00)=0.14) and early in the af-ternoon (12:00 to 17:00) (Slope(12:00−17:00)=0.14) had the highest concentrations of freshly emitted accumulation mode particles, probably in the form of BC covered with p-PAHs. Diesel vehicles have been found to yield the highest PAS/DC readings on roadways measurements conducted in Califor-nia by Ott and Siegman (2006), most likely because diesel fuel is characterized by a higher PAH content than gaso-line fuel (Lee et al., 1995). In addition, several roadside, road tunnel, and chassis dynamometer studies have demon-strated that the emission factors of p-PAHs (especially of light molecular weight species such as fluoranthene, pyrene, and benzo(ghi)fluoranthene in particular) from heavy-duty diesel vehicles are significantly higher than those from light-duty gasoline vehicles (Schauer et al., 1999; Zielinska et al., 2004; Phuleria et al., 2006; Fujita et al., 2007; Ning et al., submitted). Overall, the fact that the slope of the PAS versus DC plot increases during rush hour traffic and decreases at nighttime is a clear indication of the effect of variable par-ticle chemical composition throughout the day as a result of different sources and formation mechanisms.
As illustrated in Fig. 4a to e, the PAS
sig-nal and the BC concentration in Wilmington were very well correlated during the course of the day (R(alldata)2 =0.86; R2(00:00−05:00)=0.69; R2(06:00−11:00)=0.82;
R(12:00−17:00)2 =0.86; R2(18:00−23:00)= 0.84), and the magnitude of the regression slopes did not vary significantly from early in the morning to late at night (Slope(00:00−05:00)=3.62; Slope(06:00−11:00)= 5.44; Slope(12:00−17:00)=5.27; Slope(18:00−23:00)=4.04). These are all indications that p-PAHs and BC particles at this urban site have a common origin, and that diesel combustion emissions probably represent the main source of p-PAHs in the Wilmington area. These results confirm those obtained by Chetwittayachan et al. (2002) in Tokyo and Bangkok and by other researcher in different metropolitan areas where air pollution is dominated by traffic emissions (Marr et al., 2004, 2006). A summary of the slopes, intercepts and R2for the correlations among all measurements taken at the Wilmington site are reported in Table 2.
The correlation coefficient and regression slopes of the PAS versus EAD (DC) plots obtained from the dynamometer tests were a strong function of the presence or absence of emission control technologies in the tested vehicles and of the driving conditions. An example of these types of plots for the “baseline” vehicle operated in UDDS cycle is reported in Fig. 5. Similarly to what was observed in Wilmington,
Table 2. Summary of the slopes, intercepts and R2for the corre-lations among all of the measured data obtained at the Wilmington site.
Correlation Time period Slope Intercept R2 PAS (fA) vs. All data 0.132 –1.03 0.48 NSAM (fA)
00:00 to 05:00 0.035 3.69 0.21 06:00 to 11:00 0.141 –0.18 0.31 12:00 to 17:00 0.142 –0.59 0.57 18:00 to 23:00 0.082 1.14 0.60 PAS (fA) vs. All data 0.00050 0.34 0.51 PN (#/cm3)
00:00 to 05:00 0.00010 4.45 0.11 06:00 to 11:00 0.00050 1.09 0.35 12:00 to 17:00 0.00030 2.44 0.31 18:00 to 23:00 0.00030 1.98 0.62 NSAM (fA) vs. All data 0.00330 16.66 0.62 PN (#/cm3) 00:00 to 05:00 0.00430 14.53 0.69 06:00 to 11:00 0.00390 11.28 0.57 12:00 to 17:00 0.00210 23.22 0.51 18:00 to 23:00 0.00360 10.96 0.66 BC (µg/m3) vs. All data 0.00010 –0.68 0.63 PN (#/cm3) 00:00 to 05:00 0.00005 0.24 0.29 06:00 to 11:00 0.00010 –1.21 0.70 12:00 to 17:00 0.00006 –0.10 0.43 18:00 to 23:00 0.00010 –0.74 0.65 BC (µg/m3)vs. All data 0.029 –1.06 0.80 NSAM (fA) 00:00 to 05:00 0.027 –1.10 0.67 06:00 to 11:00 0.030 –1.18 0.78 12:00 to 17:00 0.027 –0.75 0.70 18:00 to 23:00 0.027 –0.96 0.82 PAS (fA) vs. All data 5.307 2.48 0.86 EC (µg/m3)
00:00 to 05:00 3.619 3.23 0.69 06:00 to 11:00 5.437 2.52 0.82 12:00 to 17:00 5.265 2.99 0.86 18:00 to 23:00 4.042 3.29 0.84
the PAS versus NSAM plot consists of data-points that are uniformly distributed between two boundaries (Fig. 5a). However, when measurements were segregated based on the accelerating conditions during the test, the slope of the regression line changed distinctively from negative (min=–0.008) to positive (max=0.08) as the vehicle speed increased from 0 to 57 mph (Fig. 5b), indicating a substantial variation in the surface properties of the particles present in the examined exhaust (only regression slopes are shown in Fig. 5b). Most importantly, the particle size distribution shifted from nucleation to accumulation mode, going from the lower (Fig. 5c) to the higher (Fig. 5d) speed ranges, highlighting the fact that the “baseline” truck had higher p-PAH emissions at higher driving speeds. Coagulation and condensational growth were likely to be the mechanisms associated with the observed increase in particle diameter.
a)
* Speed range = 0 to 2.5 mph. Peak number concentration (#/cc) occurred when Dp ~ 30 nm
Fig. 5. PAS vs EAD plots for the “baseline” vehicle operated in UDDS mode considering all measurements (a) and data segregated by
different acceleration cycles (b). The particle size distribution is also reported for lower (d) and higher (c) speed ranges.
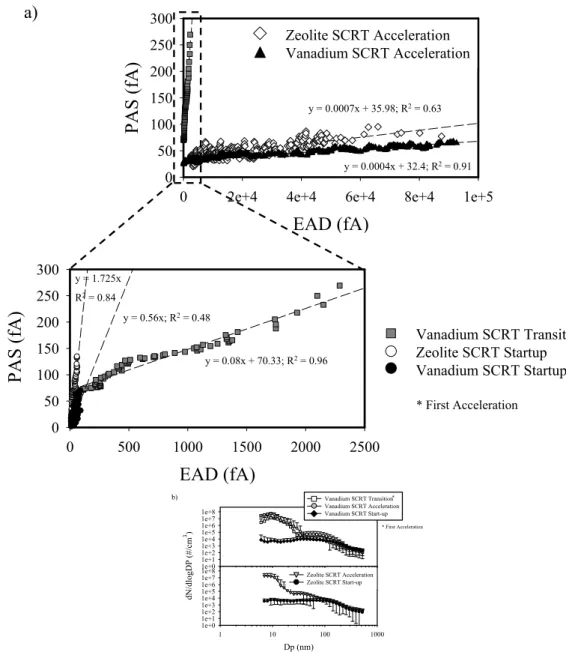
Very different results were observed for the PAS versus EAD plots of vehicles equipped with SCRT emission control technologies and operating in the UDDS cycle. Distinct spikes in the PAS signal were clearly detected when plotting all data-points collected while testing the catalyst-equipped vehicles (data not shown). Unlike the “baseline” vehicle, the highest and the lowest PAS signals (and regression slopes) were observed at start-up (Slope(Vanadium)Start−up=0.56; Slope(Zeolite)Start−up=1.725) and during the accel-eration mode (Slope(Vanadium)Acceleration=0.0004;
Slope(Zeolite)Acceleration=0.0007), respectively (Fig. 6a). Also, a lower relative contribution of nucleation mode particles to the measured particle number concentration was observed at start-up (Fig. 6b), probably because the engine temperature was not high enough to activate the catalyst (Vanadium or Zeolite) and, thus, to convert gaseous SO2 to particulate sulfate. As the truck speed and the engine load increased, the exhaust temperature also increased to a level that favored the formation of nucleation mode particles. The increase in nucleation mode PM, combined
a)
EAD (fA)
0 2e+4 4e+4 6e+4 8e+4 1e+5
P
A
S
(fA
)
0 50 100 150 200 250 300 Zeolite SCRT Acceleration Vanadium SCRT Acceleration y = 0.0007x + 35.98; R2= 0.63 y = 0.0004x + 32.4; R2= 0.91EAD (fA)
0 500 1000 1500 2000 2500P
A
S
(fA
)
0 50 100 150 200 250 300 Vanadium SCRT Transition Zeolite SCRT Startup Vanadium SCRT Startup y = 1.725x R2 = 0.84 y = 0.56x; R2= 0.48 y = 0.08x + 70.33; R2= 0.96 0 50 100 150 200 250 300EAD (fA)
0 2e+4 4e+4 6e+4 8e+4 1e+5
P
A
S
(fA
)
Zeolite SCRT Acceleration Vanadium SCRT Acceleration y = 0.0007x + 35.98; R2= 0.63 y = 0.0004x + 32.4; R2= 0.91EAD (fA)
0 500 1000 1500 2000 2500P
A
S
(fA
)
0 50 100 150 200 250 300 y = 1.725x R2 = 0.84 y = 0.56x; R2= 0.48 y = 0.08x + 70.33; R2= 0.96 Vanadium SCRT Transition Zeolite SCRT Startup Vanadium SCRT Startup * * First Acceleration b) Dp (nm) 1 10 100 1000 dN /dl ogD P (#/ cm 3) 1e+0 1e+1 1e+2 1e+3 1e+4 1e+5 1e+6 1e+7 1e+8 Zeolite SCRT Acceleration Zeolite SCRT Start-up 1e+0 1e+1 1e+2 1e+3 1e+4 1e+5 1e+6 1e+7 1e+8 Vanadium SCRT Transition Vanadium SCRT Acceleration Vanadium SCRT Start-up Dp (nm) 1 10 100 1000 dN /dl ogD P (#/ cm 3) 1e+0 1e+1 1e+2 1e+3 1e+4 1e+5 1e+6 1e+7 1e+8 Zeolite SCRT Acceleration Zeolite SCRT Start-up 1e+0 1e+1 1e+2 1e+3 1e+4 1e+5 1e+6 1e+7 1e+8 Vanadium SCRT Transition Vanadium SCRT Acceleration Vanadium SCRT Start-up * * First AccelerationFig. 6. PAS versus EAD plots for vehicles equipped with SCRT emission control technologies and operating in UDDS mode. Figures show
data segregated by different driving modes (a), and the particle size distribution for each driving condition (b).
with the fact that at higher engine loads soot particles are very efficiently captured by the emission control device of a vehicle, contributed to lower the PAS signal (hence emissions of p-PAHs) as the UDDS cycle progressed. These findings are consistent with those reported by Bukowiecki et al. (2002) during other chassis dynamometer tests conducted on diesel vehicles.
It should be noted that throughout our experiments with trucks equipped with SCRT systems, only measurements ob-tained during the UDDS cycle showed PAS and EAD sig-nals significantly above background levels. When the same vehicles were operated in cruise cycle the PAS current was always close to zero (data not shown), because the size
distribution was dominated by nucleation mode particles, which suppress the PAS signal. In addition, during the cruise cycle the exhaust temperatures were sufficiently high to favor an optimal operation of the emission control systems, thus reducing the amount of p-PAHs released.
3.3 Estimated p-PAH concentrations in Wilmington compound. The PAS signal measured in Wilmington was calibrated against the sum of the concentrations of the most abundant p-PAHs obtained from GC/MS analyses of extracts from 10 integrated filter samples collected in June 2007. The correlation between 24-h average PAS signals (fA) and the corresponding sum of the analyzed
0.00 0.02 0.04 0.06 0.08 0.10 1-M ethy lnap htha lene 2-M ethyl naph thal ene Phe nant hrene Ant hrace ne Fluora nthe ne Pyre ne Cyc lope nta(c d)p yrene Benz (a)a nthra cene Chry sene 1-M ethy lchr ysen e Benz o(b )fluora nthe ne Benz o(k) fluor anth ene Benz o(j)fl uora nthe ne* Benz o(e)p yrene Benz o(a)p yrene Pery lene Inde no(1 ,2,3 -cd)p yre ne Benz o(G HI)p eryl ene Coro nene
A
ve
rage
P
A
H
con
ce
n
tr
ati
on
(n
g/
m
3)
0.00 0.02 0.04 0.06 0.08 0.10 1-M ethy lnap htha lene 2-M ethyl naph thal ene Phe nant hrene Ant hrace ne Fluora nthe ne Pyre ne Cyc lope nta(c d)p yrene Benz (a)a nthra cene Chry sene 1-M ethy lchr ysen e Benz o(b )fluora nthe ne Benz o(k) fluor anth ene Benz o(j)fl uora nthe ne* Benz o(e)p yrene Benz o(a)p yrene Pery lene Inde no(1 ,2,3 -cd)p yre ne Benz o(G HI)p eryl ene Coro neneA
ve
rage
P
A
H
con
ce
n
tr
ati
on
(n
g/
m
3)
Fig. 7. Relative abundances of individual p-PAHs analyzed by GC/MS in Wilmington. Only those species with concentrations above the
detection limit were reported (integrated filter samples were also analyzed for Acenaphthene, Fluorene, 2,6-Dimethylnaphthalene, Retene, Dibenzo(ah)anthracene, Picene, and Dibenzo(ae)pyrene).
p-PAHs (ng/m3) was excellent (R2=0.9; Slope=17.5; Intercept=–1.33), and the resulting estimated concentrations (Average=0.64 ng/m3; Min=0.24 ng/m3; Max=3.05 ng/m3; Standard deviation=0.46 ng/m3) were in good agreement with those reported in previous studies conducted in Los Angeles in similar time periods (Schauer et al., 1996; Manchester-Neelvsg, 2003; Ning et al., 2007). For exam-ple, in the summer of 2006 Ning et al. (2007) reported that the average mass concentrations of total p-PAHs measured outside the University of Southern California (USC) campus (∼150 m from the I-110 freeway) were 1.93 and 0.49 ng/m3 in the morning and afternoon, respectively. Hourly-averaged p-PAH concentrations estimated in Wilmington were 1.18 and 0.38 ng/m3at 08:00 and 17:00, respectively. The slightly lower p-PAH concentrations of this study are probably due to the fact that our sampling site was located farther from both the I-110 (∼1.5 Km east) and the I-710 (∼4.5 Km west) free-ways compared to the site at USC.
Ambient concentrations of p-PAHs in Los Angeles are much lower than those detected in other metropolitan areas. For example, Marr et al. (2006) reported that in April 2003 ambient p-PAHs in Mexico-City peaked at ∼110 ng/m3 dur-ing the morndur-ing rush hour and rapidly decayed to ∼20 ng/m3 in the afternoon because of changes in source activity pat-terns and dilution as the boundary layer rises. Overnight concentrations were as high as 50 ng/m3, probably because of condensation of gas-phase PAHs onto existing particles driven by temperature decrease. Interestingly, in Mexico-City the surface concentration of p-PAH (measured by a PAS) decreased more rapidly than the bulk PAH concentra-tion (detected by an AMS) during the late morning, suggest-ing that freshly emitted combustion-related particles were quickly coated by non-photo-emitting secondary aerosol
material (organic and inorganic), and that p-PAHs might have been transformed/lost by heterogeneous reactions with ox-idants such as OH, ozone, nitrogen oxides, and nitric acid (photolysis may also be an important sink for p-PAHs) (Marr et al., 2006).
The distribution of p-PAH species varies significantly with season, location, and the relative source contributions, espe-cially those from gasoline- and diesel-fuelled vehicles. Fig-ure 7 illustrates the relative abundances of the individual p-PAHs analyzed by GC/MS; only those species with con-centrations above the detection limit were reported. Pre-vious roadway tunnel and dynamometer studies (Miguel et al., 1998; Marr et al., 1999; Zielinska et al., 2004; Phuleria et al., 2006; Ning et al., submitted) have shown that diesel vehicle emissions are enriched in lower molecular weight PAHs (e.g., phenantrene and alkylated phenanthrenes, flu-oranthene, and chrysene), whereas higher molecular weight PAHs are associated with gasoline vehicle emissions (e.g., benzo(ghi)perylene, indeno[1,2,3-cd]pyrene, and coronene). The presence of relatively high concentrations of both low and high molecular weight p-PAHs in the filter samples sug-gests that contributions from gasoline- and diesel-powered vehicles (from the I-110 and the I-710, respectively) were both important. Non-negligible concentrations of methyl-napthalene and methylchrysene (probably from unburned diesel fuel; Marr et al., 2006) were also detected in Wilm-ington. Retene, a semi-volatile PAH that originates predom-inately from the combustion of wood from conifer trees, and is considered to be a tracer for soft wood combustion, was not present in any of the analyzed samples. Because the en-ergy associated with the PAS lamp (6.0 eV) is less than the ionization energy of solid-phase naphthalene (6.4 eV) (Seki, 1989), the instrument does not detect this.
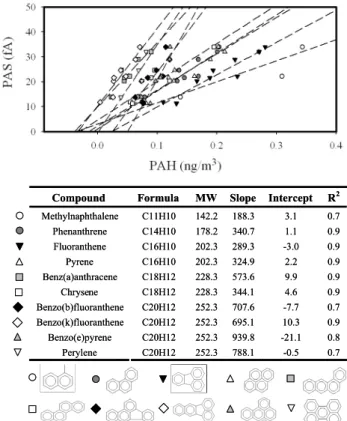
3.4 Photo-electric activity and molecular weight/structure To improve our understanding on how the PAS signal re-sponds to different p-PAHs deposited on the particle surface, and to investigate which class of PAH contributes the most to the sensor signal, we plotted the concentrations (ng/m3)
of individual p-PAHs against the corresponding 24-h av-erage PAS signals. The data–points (Fig. 8) include only species for which the R2was higher that 0.7; all other de-tected p-PAHs were not considered in this discussion. The relationship between photo-electric activity and molecular structure, as well as to microstructure (molecular packing) of the particle/adsorbate system is evident. Our results in-dicate that the larger the molecule, the higher its probabil-ity to be photo-ionized by one photon (because of the larger cross-section). With a few exceptions (phenanthrene and chrysene in particular), the regression slope was the low-est for Methylnaphtalene (slope=188.3; MW=142.2) and in-creased with the molecular weight of the considered species to a maximum value for Benzo (e) pyrene (slope=939.8; MW=252.3). As suggested by Niessner (1986) the degree of molecular packing of PAH molecules in a crystallitic ar-rangement also affects the intensity of the photo-electric ac-tivity. In fact, the regression slopes of Perylene and Benzo (e) pyrene (both characterized by a MW=252.3 and by a rather “packed” molecular structure) were higher than those of Benzo(b)fluoranthene and Benzo(k)fluoranthene (2 iso-mers also having a MW=252.3 but characterized by a more “linear” structure). It appears that the lower the separation distance between aromatic rings (i.e., the higher the degree of packing), the higher the adsorbate-substrate interaction and the resulting photo-electric activity (Niessner, 1986). How-ever, in urban environments, the intensity of the PAS re-sponse is also influenced by the presence or absence of sec-ondary inorganic or organic aerosols that could decrease the PAS signal by shielding surface-bound PAHs from detection by photo-ionization (Marr et al., 2006). Keeping this caveat in mind, the relationship between the PAS signal and the PAH molecular structure appears nonetheless to be remark-ably consistent, as evidenced in the data plotted in Fig. 8. 3.5 Lung-cancer Risk in the Wilmington Area
Because of their mutagenic and carcinogenic properties, ex-posure to BC, diesel exhaust particles, and p-PAHs may pose a severe health risk to individuals living in the Wilming-ton area. Estimating the potential health risk from these species and comparing the results to those obtained in other metropolitan areas is instructive, despite the large uncertain-ties involved in these calculations. Following the procedure adopted by Sauvain et al. (2003) we determined the lung-cancer risk associated with exposure to p-PAHs and BC from diesel combustion particles (DCPs). The most common ap-proach for estimating health-risks posed by multi-component p-PAH exposure is based on the individual compound’s
po-Compound Formula MW Slope Intercept R2
Methylnaphthalene C11H10 142.2 188.3 3.1 0.7 Phenanthrene C14H10 178.2 340.7 1.1 0.9 Fluoranthene C16H10 202.3 289.3 -3.0 0.9 Pyrene C16H10 202.3 324.9 2.2 0.9 Benz(a)anthracene C18H12 228.3 573.6 9.9 0.9 Chrysene C18H12 228.3 344.1 4.6 0.9 Benzo(b)fluoranthene C20H12 252.3 707.6 -7.7 0.7 Benzo(k)fluoranthene C20H12 252.3 695.1 10.3 0.9 Benzo(e)pyrene C20H12 252.3 939.8 -21.1 0.8 Perylene C20H12 252.3 788.1 -0.5 0.7
Compound Formula MW Slope Intercept R2
Methylnaphthalene C11H10 142.2 188.3 3.1 0.7 Phenanthrene C14H10 178.2 340.7 1.1 0.9 Fluoranthene C16H10 202.3 289.3 -3.0 0.9 Pyrene C16H10 202.3 324.9 2.2 0.9 Benz(a)anthracene C18H12 228.3 573.6 9.9 0.9 Chrysene C18H12 228.3 344.1 4.6 0.9 Benzo(b)fluoranthene C20H12 252.3 707.6 -7.7 0.7 Benzo(k)fluoranthene C20H12 252.3 695.1 10.3 0.9 Benzo(e)pyrene C20H12 252.3 939.8 -21.1 0.8 Perylene C20H12 252.3 788.1 -0.5 0.7
Fig. 8. Concentrations of individual p-PAHs detected by GC/MS
analyses of integrated filter samples collected in Wilmington in June 2007 against the corresponding 24-h average PAS signal. Slopes and intercepts of all regression equations, and molecular for-mulas and structures of each individual species are also reported
tency equivalence factor (PEF) relative to Benzo (a) pyrene (B(a)p; considered as a toxicological prototype for all other p-PAHs). A B(a)P equivalent concentration (B(a)Peq) is cal-culated by multiplying the individual p-PAH concentrations by the correspondent PEF (Bostrom et al., 2002; Sauvain et al., 2003; Chen and Liao, 2006), and the carcinogenic potency of all considered p-PAHs is then expressed as the sum of each individual B(a)Peq (PB(a)Peq). To simplify our calculations, BC was assumed to be emitted only from DCPs. Although this last assumption might not be com-pletely true (a non-negligible fraction of BC is also released from gasoline vehicles, power plants, and biomass burning; Schauer et al., 2003), it is likely that most of the BC in the Wilmington area is emitted from diesel combustion sources. The theoretical lung-cancer risk due to inhalation of p-PAHs and BC was then calculated by multiplying thePB(a)Peq and BC concentrations by the corresponding unit risk fac-tors, here defined as the risk corresponding to a lifetime (70 years per 24-h per day) exposure to 1 µg/m3ofPB(a)Peq or BC. The lifetime unit risk factor estimates considered in this work were obtained from both epidemiological studies and research conducted on rats (Sauvain et al., 2003), and compared reasonably well with those reported by the World
Table 3. Approximate theoretical lifetime (70 years per 24-h/day) lung-cancer risk in the Wilmington area due to inhalation of
multi-component p-PAHs and BC. Estimations of the contribution of the p-PAHs (genotoxic) risk to the total lung-cancer risk attributable to BC are also included.
Predicted lung-cancer risk Predicted genotoxic (p-PAH) p-PAH/BC risk (%)
based on BC concentrations lung-cancer risk based onP
B[a]Peq
* Unit risk factor (µg/m3)−1 * Unit risk factor (µg/m3)−1
Rodent** 1.31×10⁻⁵ Rodent** 2.99×10⁻³
Epidemiology*** 6.07×10⁻⁴ Epidemiology*** 5.60×10⁻²
BC concentrations PB[a]P concentrations
(µg/m3) (µg/m3)
Study mean 08:00 17:00 Study mean 08:00 17:00
Mean BC (µg/m3) 1.47 2.92 0.45 PB[a]Peq (µg/m3) 4.76×10⁻⁵ 8.81×10⁻⁵ 2.88×10⁻⁵
BC lung-cancer risk p-PAHs (genotoxic) lung-cancer risk Study mean Highest Lowest
Study mean 08:00 17:00 Study mean 08:00 17:00
Rodent** 1.92×10⁻⁵ 3.82×10⁻⁵ 5.94×10⁻⁶ Rodent** 1.42×10⁻⁷ 2.63×10⁻⁷ 8.59×10⁻⁸ Rodent** 0.74 1.44 0.69
Epidemiology*** 8.93×10⁻⁴ 1.77×10⁻³ 2.76×10⁻⁴ Epidemiology*** 2.66×10⁻⁶ 4.94×10⁻⁶ 1.61×10⁻⁶ Epidemiology*** 0.30 0.58 0.28
*defined as the risk corresponding to an average lifetime exposure (70 years per 24-h/day) to 1 µg/m3of BC or B(a)P. Our values are proportionally higher than those reported by Sauvain et al. (2003) for occupational exposure (45 years per 8-hr/day) to 1 µg/m3of diesel emission particles or B(a)P from diesel exhaust. **lifetime unit risk factor estimated from research conducted on rats; ***lifetime unit risk factor estimated from epidemiological studies. Note: the lifetime unit risk factor for exposure to total-p-PAHs reported by the World Health Organization for coke oven workers is 8.70×10⁻²(WHO: Air Quality Guidelines for Europe, 2000).
Health Organization for coke oven workers (WHO: Air Qual-ity Guidelines for Europe, 2000).
The results of these rather simplified risk calculations (Table 3) highlight two important points. First, the lung-cancer risk at the Wilmington site is highest during rush hour traffic (at 08:00; Risk[BC]=3.82×10⁻⁵for the rodent-based estimate to 1.77×10⁻³for the epidemiologic estimate; Risk[p-PAHs]=2.63×10⁻⁷ for the rodent-based estimate to 4.94×10⁻⁶for the epidemiologic estimate) and lowest in the afternoon (at 17:00, Risk[BC]=5.94×10⁻⁶ to 2.76×10⁻⁴; Risk[p-PAHs]=8.59×10⁻⁸ to 1.61×10⁻⁶). Secondly, the genotoxic risk of the considered p-PAHs does not seem to contribute to a significant part of the total lung-cancer risk attributable to BC (less than 2%). For comparison, Sauvain et al. (2003) estimated that the lifetime risk of lung can-cer associated with occupational exposure to p-PAHs mea-sured in a bus depot, a truck repair workshop, and an under-ground tunnel in Lausanne (Switzerland), was 3 to 8% of the total risk attributable to diesel exhaust particles emitted in the summertime. Marr et al. (2004) calculated a mean can-cer risk level for p-PAHs of approximately 5×10⁻⁵(a value ∼10 times higher than the highest p-PAH risk estimated in Wilmington) for lifetime exposure to p-PAHs concentrations found along a typical roadway in the Mexico-City metropoli-tan area. Although these calculations are rather uncertain and highly dependent on the sampling location and season (in the summer a higher percentage of semi-volatile PAHs is present in the gaseous phase), they suggest that the risk associated with inhalation to p-PAHs and BC is the highest along road-ways and in areas characterized by fresh vehicle emissions, and decreases with increasing distance from the roadways. This hypothesis is further validated by considering that the
maximum PAS signal (fA) measured for the “baseline” vehi-cle during our dynamometer tests was more than 250 times higher than the maximum ambient PAS measurements (fA) recorded in Wilmington. The health effects associated with exposure to other carcinogenic compounds present in the at-mosphere (e.g. nitro-PAHs and other organic compounds), may further amplify this risk.
4 Conclusions
The photo-electric aerosol sensor (PAS) was used in con-junction with other continuous instruments to provide infor-mation on p-PAH emissions a) in Wilmington (CA), near the Los Angeles port and close the I-110 and I-710 free-ways, and b) from 3 diesel trucks with and without emis-sion control technologies (SCRT and “baseline” vehicles, re-spectively). Ambient concentrations of p-PAHs peaked be-tween 09:00 and 11:00 (along with those of particle surface area, PN, and BC) because of increased contributions from both gasoline- and diesel-fuelled vehicles, and were 4 times higher than later in the afternoon. The observed changes in the chemical and physical properties of p-PAHs throughout the day suggest that the toxicity of fresh versus aged parti-cles may differ. In particular, the bioavailability of p-PAHs is likely to be the highest during rush hour traffic, when fresh combustion particles are not coated with other non photo-emitting compounds. p-PAH emissions from the “baseline” vehicle were up to 200 times higher than those from the SCRT trucks, and increased when the vehicle was acceler-ating. The highest PAS readings for SCRT trucks were ob-tained at start-up, probably because the engine temperature was not high enough to activate the catalyst (Vanadium or
Zeolite). Total p-PAHs concentrations in Wilmington (Av-erage=0.64 ng/m3; Min=0.24 ng/m3; Max=3.05 ng/m3; Stan-dard deviation=0.46 ng/m3) were in good agreement with
those reported in previous studies conducted in Los Ange-les in similar time periods, but much lower than those de-tected in other metropolitan areas such as Mexico-city (p-PAH ∼110 ng/m3 during morning rush hour; Marr et al., 2004, 2006). Finally, estimations of the theoretical lifetime (70 years per 24-h/day) lung-cancer risk in Wilmington as-sociated with exposure to p-PAHs and BC from diesel com-bustion particles revealed that the lung-cancer risk is highest during rush hour traffic (at 08:00; Risk[BC]=3.82×10⁻⁵ to 1.77×10⁻³; Risk[p-PAHs]=2.63×10⁻⁷ to 4.94×10⁻⁶) and lowest in the afternoon (at 17:00, Risk[BC]=5.94×10⁻⁶ to 2.76×10⁻⁴; Risk[p-PAHs]=8.59×10⁻⁸to 1.61×10⁻⁶). It is reasonable to assume that commuters spending several hours per day on the I-110 and the I-710 face an even higher lung-cancer risk than individuals living around the Wilmington area due to prolonged exposure to higher concentrations of p-PAHs and BC.
Acknowledgements. This research was supported by the Southern
California Particle Center (SCPC), funded by EPA under the STAR program through Grant RD-8324-1301-0 to the University of Southern California. The research described in this work has not been subjected to the agency’s required peer and policy review and therefore does not necessarily reflect the views of the agency, and no official endorsement should be inferred. Mention of trade names or commercial products does not constitute an endorsement or recommendation for use.The authors would like to thank the California Air Resource Board for their fundamental help with the dynamometer tests, J. Quintana of the Division of Occupational and Environmental Health at San Diego State University for providing the 2 photo-electric aerosol sensors, the South Coast Air Quality Management District for their important contributions to the field campaign, and M. Olson and J. Schauer at the Wisconsin State Laboratory of Hygiene for sample preparation and chemical analysis.
Edited by: C. Chan
References
Ayala, A., Kado, N. Y., Okamoto, R. A., Holmen, B. A., Kuzmicky, P. A., Kobayashi, R., Stiglitz, K. E. Diesel and CNG Heavy-duty Transit Bus: Emissions over Multiple Driving Schedules: Regu-lated Pollutants and Project Overview, Journal of Lubricants and Fuels, SAE Transactions, 111, 735–747, 2002.
Baltensperger, U., Streit, N., Weingartner, E., Nyeki, S., Pre-vot, A. S. H., Van Dingenen, R., Virkkula, A., Putaud, J. P., Even, A., et al.: Urban and rural aerosol characteriza-tion of summer smog events during the PIPAPO field cam-paign in Milan, Italy, J. Geophys. Res.-Atmos., 107(D22), 8193, doi:10.1029/2001JD001292, 2002.
Bostrom, C.-E., Gerde, P., Hanberg, A., Jernstrom, B., Johans-son, C., Kyrklund, T., Rannug, A., Tornqvist, M., Victorin, K.,
and Westerholm, R.: Cancer Risk Assessment, Indicators, and Guidelines for Polycyclic Aromatic Hydrocarbons in the Ambi-ent Air, Environ. Health Persp., 110, 451–489, 2002.
Bukowiecki, N., Kittelson, D. B., Watts, W. F., Burtscher, H., Wein-gartner, E., and Baltensperger, U.: Real-time characterization of ultrafine and accumulation mode particles in ambient combustion aerosols, J. Aerosol Sci., 33(8) 1139–1154, 2002.
Chen, S.-C. and Liao, C.-M.: Health risk assessment on human ex-posed to environmental polycyclic aromatic hydrocarbons pollu-tion sources, Sci. Total Environ., 366 112–123, 2006.
Chetwittayachan, T., Shimazaki, D., and Yamamoto, K. A.: A com-parison of temporal variation of particle-bound polycyclic aro-matic hydrocarbons (pPAHs) concentration in different urban en-vironments: Tokyo, Japan, and Bangkok, Thailand, Atmos. Env-iron., 36(12), 2027–2037, 2002.
Cho, A. K., Sioutas, C., Miguel, A. H., Kumagai, Y., Schmitz, D. A., Singh, M., Eiguren-Fernandez, A., and Froines, J. R.: Redox activity of airborne particulate matter at different sites in the Los Angeles Basin, Environ. Res., 99(1), 40–47, 2005.
Code of Federal Regulations, Vol. 40 CFR, Subpart M, 86.1215-85, Web-site: http://www.epa.gov/OMS/regs/hd-hwy/2000frm/ 2004frm.pdf, 2004.
Dunbar, J. C., Lin, C.-I., Vergucht, I., Wong, J., and Durant, J. L.: Estimating the contributions of mobile sources of PAH to urban air using real-time PAH monitoring, The Science of the Total Environment 279, 1–19, 2001.
Ferge, T., Maguhn, J., Hafner, K., Muhlberger, F., Davidovic, M., Warnecke, R., Zimmermann, R. On-line analysis of gas-phase composition in the combustion chamber and particle emission characteristics during combustion of wood and waste in a small batch reactor, Environ. Sci. Technol., 39(6), 1393–1402, 2005. Fissan, H., Neumann, S.,Trampe, A., Pui, D. Y. H., and Shin, W.
G.: Rationale and Principle of an Instrument Measuring Lung Deposited Nanoparticle Surface Area, J. Nanopart. Res., 9, 53– 59, 2007.
Fujita, E. M., Campbell, D. E., Arnott, W. P., Chow, J. C., and Zielinska, B.: Evaluations of the chemical mass balance method for determining contributions of gasoline and diesel exhaust to ambient carbonaceous aerosols, Journal of the Air and Waste Management Association, 57(6), 721–740, 2007.
Harrison, R. M., Smith, D. J. T., and Luhana, L.: Source apportion-ment of atmospheric polycyclic aromatic hydrocarbons collected from an urban location in Birmingham, UK, Environ. Sci. Tech-nol., 30(3), 825–832, 1996.
Hart, K. M., McDow, S. R., Giger, W., Steiner, D., and Burthscher, H.: The correlation between in-situ, real-time aerosol photoemis-sion intensity and particulate polycyclic aromatic hydrocarbon concentration in combustion aerosols, Water, Air, Soil Pollution, 68, 75–90, 1993.
Herndon, S. C., Onasch, T. B., Frank, B. P., Marr, L. C., Jayne, J. T., Canagaratna, M. R., Grygas, J., Lanni, T., Anderson, B. E., Worsnop, D., and Miake-Lye, R. C.: Particulate emissions from in-use commercial aircraft, Aerosol Sci. Tech., 39(8), 799–809, 2005.
International Agency for Research on Cancer (IARC, 2005), Over-all Evaluations of Carcinogenicity to Humans (World Health Or-ganization), IARC website: www.iarc.fr.
Jimenez, J. L., Jayne, J. T., Shi, Q., Kolb, C. E., Worsnop, D. R., Yourshaw, I., Seinfeld, J. H., Flagan, R. C., Zhang, X., Smith,
K. A., Morris, J., and Davidovits, P.: Ambient aerosol sampling with an aerosol mass spectrometer, J. Geophys. Res., 108, 8425– 8438, 2003.
Jung, H. and Kittelson, D. B.: Characterization of Aerosol Sur-face Instruments in Transition Regime, Aerosol Sci. Technol., 39, 902–911, 2005.
Kelly, K., Wagner, D., Lighty, J., Nunez, M. Q., Vazquez, F. A., Collins, K., and Barud-Zubillaga, A.: Black carbon and polycyclic aromatic hydrocarbon emissions from vehicles in the United States-Mexico border region: Pilot study, Journal of the Air and Waste Management Association, 56 (3), 285-293, 2006. Manchester-Neesvig, J. B., Schauer, J. J, and Cass, G.: The Distri-bution of Particle-Phase Organic Compounds in the Atmosphere and Their Use for Source Apportionment during the Southern California Children’s Health Study, Journal of Air and Waste Management Association, 53, 1065–1079, 2003.
Marr, L. C., Kirchstetter, T. W., Harley, R. A., Miguel, A. H., Her-ing, S. V., and Hammond, S. K. Characterization of polycyclic aromatic hydrocarbons in motor vehicle fuels and exhaust emis-sions, Environ. Sci. Technol., 33(18), 3091–3099, 1999. Marr, L. C., Grogan, L. A., Wohrnschimmel, H., Molina, L. T.,
Molina, M. J., Smith, T. J., and Garshick, E.: Vehicle traffic as a source of particulate polycyclic aromatic hydrocarbon expo-sure in the Mexico City metropolitan area, Environ. Sci. Tech-nol., 38(9), 2584–2592, 2004.
Marr, L. C., Dzepina, K., Jimenez, J. L., Reisen, F., Bethel, H. L., Arey, J., Gaffney, J. S., Marley, N. A., Molina, L. T., and Molina, M. J.: Sources and transformations of particle-bound polycyclic aromatic hydrocarbons in Mexico City, Atmos. Chem. Phys., 6, 1733–1745, 2006,
http://www.atmos-chem-phys.net/6/1733/2006/.
Matter, U., Siegman, H. C., and Burtscher, H.: Dynamic Field Mea-surements of Submicron Particles from Diesel engines, Environ. Sci. Technol., 33, 1946–1952, 1999.
Miguel, A. H., Kirchstetter, T. W., Harley, R. A., and Hering, S. V.: On-road emissions of particulate polycyclic aromatic hydrocar-bons and black carbon from gasoline and diesel vehicles, Envi-ron. Sci. Technol., 32(4), 450–455, 1998.
McDow, S. R., Giger, W., Burthscher, H., Schmidt-Ott, A., and Siegmann, H. C. Polycyclic aromatic hydrocarbons and combus-tion aerosol photoemission, Atmos. Environ., 24A, 2911–2916, 1990.
Naumova, Y. Y., Offenberg, J. H., Eisenreich, S. J., Meng, Q., Poli-dori, A., Turpin, B. J., Weisel, C. P., Morandi, M. T., Colome, S. D., Stock, T. H., Winer, A. M., Alimokhtari, S., Kwon, J., Maberti, S., Shendell, D., Jones, J., and Farrar, C.: Gas/particle distribution of polycyclic aromatic hydrocarbons in coupled out-door/indoor atmospheres, Atmos. Environ., 37, 703–719, 2003. Nel, A.: Air pollution-related illness: effects of particles, Science,
309(5739), 1326–1326, 2005.
Niessner, R.: The Chemical Response of the Photo-Electric Aerosol Sensor (PAS) to Different Aerosol Systems, J. Aerosol Sci., 17(4), 705–714, 1986.
Ning, Z., Geller, M. D., Moore, K. F., Sheesley, R., Schauer, J. J., and Sioutas, C.: Daily variation in chemical characteristics of urban ultrafine aerosols and inference of their sources, Environ. Sci. Technol., 41(17), 6000–6006, 2007.
Ning, Z., Polidori, A., Schauer, J. J., and Sioutas, C.: Light- and Heavy-Duty Vehicle Emission Factors of PM species Based on
Freeway Measurements and Comparison with Tunnel and Dy-namometer Studies, submitted for publication to Atmos. Envi-ron., in press, 2008.
Ntziachristos, L., Ning, A., Geller, M. D., Sheeseley, R. J., Schauer, J. J., and Sioutas, C.: Fine, ultrafine and nanoparticle trace ele-ment compositions near a major freeway with a high heavy-duty diesel fraction, Atmos. Environ., 41, 5684–5696, 2007a. Ntziachristos, L., Ning, Z., Geller, M. D., and Sioutas, C.:
Parti-cle concentration and characteristics near a major freeway with heavy-duty diesel traffic, Environ. Sci. Technol., 41(7), 2223– 2230, 2007b.
Ntziachristos, L., Polidori, A., Phuleria, H., Geller, M. D., Sioutas, C. Application of a diffusion charger for the measurement of particle surface concentration in different environments, Aerosol Sci. Technol., 41 (6), 571–580, 2007c.
Ott, W. R. and Siegmann, H. C.: Using multiple continuous fine particle monitors to characterize tobacco, incense, candle, cook-ing, wood burncook-ing, and vehicular sources in indoor, outdoor, and in-transit settings, Atmos. Environ., 40, 821–843, 2006. Phuleria, H. C., Geller, M. D., Fine, P. M., and Sioutas, C.:
Size-resolved emissions of organic tracers from light-and heavy-duty vehicles measured in a California roadway tunnel, Environ. Sci. Technol., 40(13), 4109–4118, 2006.
Pope, C. A., Burnett, R. T., Thun, M. J., Calle, E. E., Krewski, D., Ito, K., and Thurston, G. D.: Lung cancer, cardiopulmonary mor-tality, and long-term exposure to fine particulate air pollution, J. Am. Med. Assoc., 287(9), 1132–1141, 2002.
Pope, C. A., Burnett, R. T., Thurston, G. D., Thun, M. J., Calle, E. E., Krewski, D., and Godleski, J. J.: Cardiovascular mortality and long-term exposure to particulate air pollution – Epidemio-logical evidence of general pathophysioEpidemio-logical pathways of dis-ease, Circulation, 109 (1) 71–77, 2004.
Riddle, S. G., Robert, M. A., Jakober, C. A., Hannigan, M. P., and Kleeman, M. J.: Size Distribution of Trace Organic Species Emitted from Heavy-Duty Diesel Vehicles, Environ. Sci. Tech-nol., 41(6), 1962–1969, 2007a.
Riddle, S. G., Jakober, C. A., Robert, M. A., Cahill, T. M., Charles M. J. and Kleeman, M. J.: Large PAHs detected in fine particu-late matter emitted from light-duty gasoline vehicles, Atmos. En-viron., 41(38), 8658–8668, doi:10.1016/j.atmosenv.2007.07.023, 2007b.
Rogers, F., Arnott, P., Zielinska, B., Sagebiel, J., Kelly, K. E., Wag-ner, D., Lighty, J. S., and Sarofim, A. F.: Real-time measure-ments of jet aircraft engine exhaust, Journal of the Air and Waste Management Association, 55(5), 583–593, 2005.
Sauvain, J. J., Duc, T. V., and Guillemin, M.: Exposure to carcino-genic polycyclic aromatic compounds and health risk assessment for diesel-exhaust exposed workers, International Archives of Occupational and Environmental Health, 76(6), 443–455, 2003. Schauer, J. J., Rogge, W. F., Hildemann, L. M., Mazurek, M. A., and
Cass, G. R.: Source apportionment of airborne particulate mat-ter using organic compounds as tracers, Atmos. Environ., 30(22) 3837–3855, 1996.
Schauer, J. J., Kleeman, M. J., Cass, G. R., and Simoneit, B. R. T.: Measurement of emissions from air pollution sources, 2. C-1 through C-30 organic compounds from medium duty diesel trucks, Environ. Sci. Technol., 33(10), 1578–1587, 1999. Schauer, J. J., Kleeman, M. J., Cass, G. R., and Simoneit, B. R.
C1-C32 organic compounds from gasoline-powered motor vehicles, Environ. Sci. Technol., 36, 1169–1180, 2002.
Schauer, J. J.: Evaluation of elemental carbon as a marker for diesel particulate matter, Sci. Total Environ., 366, 112–123, 2003. Siegmann, K. and Siegmann, H. C.: Fast and reliable “in situ”
eval-uation of particles and their surfaces with special reference to diesel exhaust, SAE Technical Paper Series, 2000-01-1995, 1–7, 2000.
Sheesley, R. J., Schauer, J. J., Smith N. D., and Hays M. D.: De-velopment of a standardized method for the analysis of organic compounds present in PM2.5, in: Proceedings of the AWMA
An-nual Meeting 2000, Salt Lake City, UT, 2000.
Sheesley, R. J., Schauer, J. J., Bean, E., and Kenski, D.: Trends in secondary organic aerosol at a remote site in Michigan’s upper peninsula, Environ. Sci. Technol., 38(24), 6491–6500, 2004. Wallace, L.: Real-Time Measurements of Black Carbon Indoors
and Outdoors: A Comparison of the Photoelectric Aerosol Sen-sor and the Aethalometer, Aerosol Sci. Technol., 39, 1015–1025, 2005.
Wasserkort, R., Hartmann, A., Widmer, R. M., and Burthscher, H.: Correlation between on-line PAH detection in airborne particle samples and their bacterial genotoxicity, Ecotox. Environ. Safe., 40, 126–136, 1996.
World Health Organization (WHO): Air Quality Guidelines for Eu-rope, 2000. Website: http://www.euro.who.int/air.
Zhiqiang, Q., Siegmann, K., Keller, A., Matter, U., Scherrer, L., and Siegmann, H.C.: Nanoparticle air pollution in major cities and its origin, Atmos. Environ., 34, 443–451, 2000.
Zielinska, B., Sagebiel, J., McDonald, J. D., Whitney, K. and Law-son,D. R.: Emission rates and comparative chemical composition from selected in-use diesel and gasoline-fueled vehicles, Jour-nal of the Air and Waste Management Association, 54(9), 1138– 1150, 2004.