HAL Id: hal-00297976
https://hal.archives-ouvertes.fr/hal-00297976
Submitted on 21 Feb 2008HAL is a multi-disciplinary open access
archive for the deposit and dissemination of sci-entific research documents, whether they are pub-lished or not. The documents may come from teaching and research institutions in France or abroad, or from public or private research centers.
L’archive ouverte pluridisciplinaire HAL, est destinée au dépôt et à la diffusion de documents scientifiques de niveau recherche, publiés ou non, émanant des établissements d’enseignement et de recherche français ou étrangers, des laboratoires publics ou privés.
Carbon isotope discrimination of C3 vegetation in
Central Asian Grassland as related to long-term and
short-term precipitation patterns
M. Wittmer, K. Auerswald, R. Tungalag, Y. F. Bai, R. Schäufele, C. H. Bai,
H. Schnyder
To cite this version:
M. Wittmer, K. Auerswald, R. Tungalag, Y. F. Bai, R. Schäufele, et al.. Carbon isotope discrimination of C3 vegetation in Central Asian Grassland as related to long-term and short-term precipitation patterns. Biogeosciences Discussions, European Geosciences Union, 2008, 5 (1), pp.903-935. �hal-00297976�
BGD
5, 903–935, 2008 13 C discrimination anomalies of C3 plants in arid grasslands M. Wittmer et al. Title Page Abstract Introduction Conclusions References Tables Figures ◭ ◮ ◭ ◮ Back CloseFull Screen / Esc
Printer-friendly Version Interactive Discussion Biogeosciences Discuss., 5, 903–935, 2008
www.biogeosciences-discuss.net/5/903/2008/ © Author(s) 2008. This work is distributed under the Creative Commons Attribution 3.0 License.
Biogeosciences Discussions
Biogeosciences Discussions is the access reviewed discussion forum of Biogeosciences
Carbon isotope discrimination of C3
vegetation in Central Asian Grassland as
related to long-term and short-term
precipitation patterns
M. Wittmer1, K. Auerswald1, R. Tungalag2, Y. F. Bai3, R. Sch ¨aufele1, C. H. Bai3, and H. Schnyder1
1
Lehrstuhl f ¨ur Gr ¨unlandlehre, Technische Universit ¨at M ¨unchen, Am Hochanger 1, 85350 Freising-Weihenstephan, Germany
2
National University of Mongolia, Ikh surguulin gudalmj – 1, Baga toiruu, Sukhbataar district, Ulaanbaatar, Republic of Mongolia
3
Laboratory of Quantitative Vegetation Ecology, Institute of Botany, The Chinese Academy of Sciences, 20 Nanxincu, Xiangshan, Beijing, 100093, People’s Republic of China
Received: 18 January 2008 – Accepted: 24 January 2008 – Published: 21 February 2008 Correspondence to: K. Auerswald ([email protected])
BGD
5, 903–935, 2008 13 C discrimination anomalies of C3 plants in arid grasslands M. Wittmer et al. Title Page Abstract Introduction Conclusions References Tables Figures ◭ ◮ ◭ ◮ Back CloseFull Screen / Esc
Printer-friendly Version Interactive Discussion Abstract
The relationship between carbon isotope discrimination (13∆) of C3 vegetation and long-term (30 years) and short-term (growing period) precipitation was investigated. Members of Stipa, a dominant grass genus in the (semi-)arid Asian steppes, and other C3 species were collected along aridity gradients in Inner Mongolia in 2005 (11 sites, 5
71 samples) and in the Republic of Mongolia in 2006 (40 sites, 45 samples). The data set was expanded with published and unpublished data of Stipa and other C3 species (11 studies covering 8 years, including 64 observations of Stipa, and 103 observations of other C3 species) and C3 community bulk-samples (11 samples). Weather data were geostatistically interpolated for all sampling sites and years. 13∆ of Stipa followed 10
different relationships for the individual years when related to mean annual precipitation due to large anomalies between annual and long-term average precipitation patterns. But, the 13∆ response to rainfall converged when mean annual precipitation was re-placed by year-specific mean daily growing period precipitation (PG). Remarkably, the 13
∆-response to PG for C3 species as a whole (including herbaceous dicots, semi-15
shrubs and grasses) and also the C3 community-level response were virtually identical to that of Stipa. The relation was also valid outside the geographical and climatic range where it was developed, giving proof of its robustness.
1 Introduction
The Central Asian Grassland is the largest contiguous biome of the world and in-20
cludes the steppes of the Republic of Mongolia (1.3 million km2 of a total land area of 1.6 million km2, Kerven et al., 1996) and of the Inner Mongolia autonomous region (0.8 million km2 of a total land area of 1.2 million km2, Xiao et al., 1995a and citations therein) of the People’s Republic of China. This region has a continental climate with most of the rain falling in the summer. By far, the largest part of this grassland is 25
BGD
5, 903–935, 2008 13 C discrimination anomalies of C3 plants in arid grasslands M. Wittmer et al. Title Page Abstract Introduction Conclusions References Tables Figures ◭ ◮ ◭ ◮ Back CloseFull Screen / Esc
Printer-friendly Version Interactive Discussion major factor controlling vegetation composition, functioning and services, such as the
quality and availability of herbage for grazing livestock (Xiao et al., 1995a and citations therein). The Central Asian Grassland flora contains a large number of C4 species (approx. 20% of the flora; mostly dicots; Pyankov et al., 2000), but the vegetation is generally dominated by C3 species, mostly perennial grasses. In particular, members 5
of the genus Stipa are a frequent and often dominant component of most types of grassland in the region.
The carbon isotope composition (δ13C) of C3 vegetation generally correlates neg-atively with water availability. This is primarily attributed to the leaf-level response of 13
C discrimination (13∆) to water availability in C3 plants (Farquhar et al., 1989), which 10
translates to community and higher scales (e.g., Kaplan et al., 2002; Randerson et al., 2002; Schnyder et al., 2006). The carbon isotope composition of plants (δ13Cp) is related to13∆ as
δ13Cp= (δ13Ca−13∆)/(1 +13∆) (1)
whereδ13Ca is the δ13C of atmospheric CO2(Farquhar et al., 1989). Rearranging 15
Eq. (1) leads to13∆=(δ13Ca−δ13Cp)/(1+δ13Cp) and shows that13∆ can be calculated
directly fromδ13Cpifδ13Cais also known.
Precipitation is highly variable in time and space in the Mongolian grassland. Mean annual precipitation (MAP) varies from several hundred millimeters per year (mm yr−1; mainly in the northern and eastern part of the region) to less than one hundred millime-20
ters per year in the Gobi desert (Fig. 1). But, at a given site, hydrological conditions of one year may differ drastically from another year. For example, MAP at Erenhot is 158 mm yr−1, but exceeds 277 mm yr−1or falls bellow 44 mm yr−1 in every second year (NOAA NCDC Climate Data Online, 2007). These factors may exert strong influences on the carbon isotope composition of grassland via (i) effects on the relative abundance 25
of C3 and C4 species (which differ by about 10 to 18‰ in carbon isotope discrimination; Farquhar et al., 1989; O’Leary, 1981), and (ii) variation of13∆ in C3 plants which results from variation of stomatal conductance or photosynthesis (Farquhar et al., 1989).
BGD
5, 903–935, 2008 13 C discrimination anomalies of C3 plants in arid grasslands M. Wittmer et al. Title Page Abstract Introduction Conclusions References Tables Figures ◭ ◮ ◭ ◮ Back CloseFull Screen / Esc
Printer-friendly Version Interactive Discussion The carbon isotope signal produced by grassland vegetation is imprinted in
ecosys-tem carbon pools (such as soil carbon) and exchange fluxes (such as biosphere atmo-sphere CO2 exchange), and is therefore potentially highly useful for biogeochemical studies and ecosystem reconstruction. However, in C3:C4 mixed grassland in arid en-vironments, the separate effects of C3:C4 abundance and variation of13∆ in C3 plants 5
on community/ecosystem13∆ must be known, to allow interpretation of ecosystem or community carbon isotope signals in terms of C3:C4 variation. The present work con-centrates on one aspect of this problem, namely the effect of aridity on13∆ in C3 plants, and then discusses its implications for C3:C4 mixing models.
The effect of aridity on13∆ in C3 plants has generally been studied in aridity-transect 10
studies where the13∆ of species was related to mean annual precipitation at sampling sites. The responses observed in theses studies were highly variable (e.g., Stewart et al., 1995; Schulze et al., 1991, 1996; Wang et al., 2003; Liu et al., 2005; Zheng and Shangguan, 2007). Here, we test the hypothesis, that the variability of the 13 ∆-response of C3 plants to mean annual precipitation in (semi-)arid grasslands is related 15
to interannual variation of weather conditions. To test this prediction, we analysed the relationship between13∆ of C3 species and short-term (growing period) and long-term (climatic, 30 years) precipitation along aridity gradients in Inner Mongolia in 2005 and in the Republic of Mongolia in 2006. The data set was complemented with published and unpublished (partially own) data, thus expanding the temporal and geographic 20
representation.
2 Material and methods
2.1 Sampling area
Stipa species were sampled in the Republic of Mongolia in 2006 (total transect length
of approx. 1650 km) and in Inner Mongolia, People’s Republic of China in 2005 (to-25
BGD
5, 903–935, 2008 13 C discrimination anomalies of C3 plants in arid grasslands M. Wittmer et al. Title Page Abstract Introduction Conclusions References Tables Figures ◭ ◮ ◭ ◮ Back CloseFull Screen / Esc
Printer-friendly Version Interactive Discussion typical steppe and desert steppe, with MAP ranging from around 280 mm yr−1 near
Ulaanbaatar to 125 mm yr−1 and less in the Gobi area near Sainshand and Erenhot and rising again to 280 mm yr−1near Xilinhot (Fig. 1).
The mean temperature ranges from about −23◦C in winter in Ulaanbaatar to about 23◦C in summer in Zamyn-Uud. The local precipitation is highly variable in space and 5
time (Gong et al., 2004). Even climate stations within about 10 km show remarkably different characteristics. Although the distance between Zamyn-Uud (Republic of Mon-golia) and Erenhot (Inner MonMon-golia) is only 10 km, the mean monthly precipitation in August is 0.52 mm day−1for Zamyn-Uud and 1.29 mm day−1for Erenhot (mean for last normal period 1961–1990). Similarily, the MAP is 114 mm yr−1 for Zamyn-Uud and 10
166 mm yr−1 for Erenhot. The mean monthly temperatures are similar for Zamyn-Uud and Erenhot (calculated from NOAA NCDC Climate Data Online, 2007).
2.2 Sampling method and the sampled species
Sampling stops were made about every 30 km. Leaves of Stipa (if present), and other C3 species were cut with scissors from several plants within an area of about 15
50×50 m2(sometimes there were only one or two specimen of a species at a sampling site). The samples for each site were transferred to separate paper bags and dried behind the front window of the car. The current position was measured with a mobile outdoor global positioning system (Casio Satellite Navi 2 or Garmin GPS 12). In total 39 Stipa samples were taken in the Republic of Mongolia in 2006 and ten Stipa sam-20
ples were taken in Inner Mongolia in 2005 (see Table A1 in supplementary material,
http://www.biogeosciences-discuss.net/5/903/2008/bgd-5-903-2008-supplement.pdf, for original data). In a few cases specimens of Stipa could not be classified at the species level. The following species were collected: Stipa krylovii, Stipa grandis and
Stipa glareosa in Republic of Mongolia, and Stipa gobica and Stipa grandis in Inner
25
Mongolia. In addition to the Stipa samples, 61 samples, representing another 19 C3 species were collected in 2005; and six samples of six C3 species in 2006.
BGD
5, 903–935, 2008 13 C discrimination anomalies of C3 plants in arid grasslands M. Wittmer et al. Title Page Abstract Introduction Conclusions References Tables Figures ◭ ◮ ◭ ◮ Back CloseFull Screen / Esc
Printer-friendly Version Interactive Discussion For validation, the data set was expanded with two samples of Stipa and 20 samples
from 20 C3 species sampled in 2003 in Inner Mongolia, three bulk C3 samples sam-pled in Mongolia in 2006 and eight C3 bulk samples samsam-pled in Inner Mongolia in 2007. Sampling procedures were the same as during the 2005 and 2006 sampling campaigns.
5
2.3 Inclusion of published data and normalization for altitude effect
Published data (Table 1) were included in the validation data base with the primary aim of increasing the temporal (and secondarily the geographic) representation. Pub-lished data covered a wide range of site conditions, with altitudes above 2000 m above sea level (especially Ivanov et al., 2007). As altitude affects the δ13C of C3 plants 10
(K ¨orner et al., 1988), all data were normalized to an altitude of 1000 m above sea level, which is close to the average altitude of our sampling locations (mean: 1160 m a.s.l.; SD: 180 m). Altitude correction was performed by applying a correction of 1.15‰ per 1000 m following Maennel et al. (2007) with a mean absolute correction to 13∆ of 0.26‰. For publications containing no altitude data, this information was obtained 15
with Google Earth® using the coordinates of sample sites. 2.4 Isotope analysis
The vegetation samples were further dried in the laboratory for one hour in a forced air oven at 95◦C and thereafter for 48 h at 60◦C. Dried samples were ground with a ball mill. The samples were then combusted in an elemental analyser (NA 1110; Carlo 20
Erba, Milan) interfaced (ConFlo III; Finnigan MAT, Bremen) to an isotope ratio mass spectrometer (Delta Plus; Finnigan MAT). Carbon isotope data are presented asδ13C relative to the international VPDB standard:δ13C=(Rsample/Rstandard)−1; where Rsample and Rstandardare the ratios of
13
C/12C in the sample and standard.
All samples were measured against laboratory working standard gases, which were 25
BGD
5, 903–935, 2008 13 C discrimination anomalies of C3 plants in arid grasslands M. Wittmer et al. Title Page Abstract Introduction Conclusions References Tables Figures ◭ ◮ ◭ ◮ Back CloseFull Screen / Esc
Printer-friendly Version Interactive Discussion of calibration ±0.06‰ SD). Solid internal laboratory standards (SILS), with similar C/N
ratio as samples (wheat flour, C/N: 21.6), were calibrated against these references. One SILS was measured after every tenth sample. The precision for sample repeats was better than 0.2‰ forδ13C.
C3 community-mean13∆ was calculated as the biomass- or ground cover-weighted 5
average of all C3 species in the community. The ordinary (un-weighted) mean13∆ was calculated if information on ground cover or biomass fraction was missing. In this way C3 community-mean13∆ was obtained from 35 data sets by Gong et al. (2007)1, Chen et al. (2005), Wang et al. (2005), Liu et al. (2005) and for 10 own data sets obtained in 2005. This was complemented by 11 own C3 samples collected as bulk samples in 10
2006 and 2007.
2.5 Carbon isotope composition of atmospheric CO2
The calculation of13∆ with Eq. (1) considered the fact that δ13Cahas been decreasing continuously in the recent past, so that plants sampled in different years grew in the presence of CO2 with (slightly) different δ13C. So, δ13Ca was estimated for the year 15
when the sampled plant grew. A third order polynomial was developed from measured
δ13Ca to predict the annual average δ13Ca for every year starting in 1959, similar to the relation reported in Geist et al. (2005):
δ13Ca= m1× yr3+ m2× yr2+ m3× yr + m4, (2)
where yr is the sampling year and m1, m2, m3 and m4 are constants 20
(11 707.12×10⁻⁹; −69 789.99×10⁻⁶; 138 640.104×10⁻³ and −91 785.476 respectively for the period 1959 to 2006 withn=62). Data were taken from Keeling (1979); Friedli
1
Gong, X., Brueck, H., Giese, M., Limeng, Z., Sattelmacher, B., and Shan, L.: Slope di-rection has effects on productivity and species composition of hilly grassland in the Xilin River Basin, Inner Mongolia, China, Institute of Plant Nutrition and Soil Science, Christian-Albrechts Universit ¨at zu Kiel, J. Arid Environ., submitted, 2007.
BGD
5, 903–935, 2008 13 C discrimination anomalies of C3 plants in arid grasslands M. Wittmer et al. Title Page Abstract Introduction Conclusions References Tables Figures ◭ ◮ ◭ ◮ Back CloseFull Screen / Esc
Printer-friendly Version Interactive Discussion et al. (1986); Conway et al. (1994); Francey et al. (1999), Gat et al. (2001), Allison et
al. (2003) and NOAA NCDC Climate Data Online (2007) for the stations Mauna Loa, Siple, Antarctica, Ulan Uul, Shetland Islands, Hegyhatsal (Hungary) and Ochsenkopf (Germany). The standard error of this regression was 0.09‰. The predicted δ13Ca changed from −8.12‰ for 1996 to −8.48‰ for 2007. From this annual average the 5
meanδ13Caduring the growing period was estimated by taking into account the relative seasonal variability as measured at Ulan Uul (Tans et al., 2005), which is a long-term measuring station located near the center of the research area (44◦27′N, 111◦05′E). On averageδ13Cawas less negative by 0.25‰ between April and August as compared to the annual average. Thus aδ13Caof −8.17‰ was assumed for the growing period 10
in 2005 and a δ13Ca of −8.19‰ for the growing period in 2006. Other years were calculated accordingly.
2.6 Statistical methods
Linear and linearized regressions were used to evaluate the datasets. The coefficient of determination was tested with a two-sided test for significance of the regression. In 15
addition the 95%-confidence interval for the samples and the 95%-confidence inter-val for the regression were calculated to allow for comparison between data sets. A pairwise comparison of means was used to test whether the species differed regard-ing MAP and ∆. These statistical procedures followed standard protocols (Sachs and Hedderich, 2006).
20
Geostatistical analyses (for theory see Webster and Oliver, 2004; Nielsen and Wen-droth, 2003) were conducted with package geoR (Ribeiro and Diggle, 2001) of the soft-ware GNU R 2.6 (R Development Core Team, 2007). The semivariance of a parameter under consideration (e.g., precipitation) is the half mean quadratic difference of the pa-rameter values of points which are separated by a certain distance (called lag). For 25
calculation of the latter, the coordinates of sampling points had to be transformed from geographic coordinates to UTM coordinates with the package PBSmapping (Schnute
BGD
5, 903–935, 2008 13 C discrimination anomalies of C3 plants in arid grasslands M. Wittmer et al. Title Page Abstract Introduction Conclusions References Tables Figures ◭ ◮ ◭ ◮ Back CloseFull Screen / Esc
Printer-friendly Version Interactive Discussion et al., 2007, UTM zone=50). Semivariances were then grouped by lag classes and
semivariances and lags within a group were averaged yielding the empirical semivar-iogram (x axis: lag, y axis: semivariance). A theoretical semivarsemivar-iogram was fitted to minimize weighted least squares, with weights calculated from the ratio of pairs within a class to mean lag. This gives more weight to those classes, which are based on 5
many data pairs and which are more important for interpolation. The quality of the fit was controlled by calculating the Nash-Sutcliff-Index. Spatial interpolation to construct maps was then carried out for a rectangular grid by ordinary point kriging, based on the theoretical semivariogram. The quality of the predictions from the resulting maps is given as the krige standard deviation averaged for the sampling locations.
10
2.7 Meteorological data
The growing period in the sampling area starts in April with only one growth cycle (no regrowth after cutting or heavy grazing). Sampling took place in early July (in 2005) or at the end of July/beginning of August (in 2006). Sampled plant material thus in-cluded biomass grown in the period of April to mid of July (2005) or April to end of 15
July/beginning of August. We will call this “growing period” in the following and in-dex it with “G”. Most of the rainfall and hence most of the plant growth usually results in this period. For 40 meteorological stations in and around the sampling area, long-term mean precipitation from April to September correlated closely with MAP (r2=0.98) and contributed 74% to MAP. Normally only little growth occurs in September, which re-20
ceives only 10% of MAP in an average year. Hence, peak above-ground living biomass in ungrazed areas usually occurs between late July and late August (Xiao et al., 1995b). The effective water availability for plants in different years and studies was estimated as the mean daily precipitation during the respective growing period PGmm day−1). This accounted for the fact that sampling did not occur on exactly the same dates in the 25
different studies, but provided a common denominator for comparison of data gathered in different years.
meteoro-BGD
5, 903–935, 2008 13 C discrimination anomalies of C3 plants in arid grasslands M. Wittmer et al. Title Page Abstract Introduction Conclusions References Tables Figures ◭ ◮ ◭ ◮ Back CloseFull Screen / Esc
Printer-friendly Version Interactive Discussion logical stations. Two data sets were used to estimate meteorological data for the
sam-pling sites. (i) The long-term averages of the last normal period (1961–1990) of precipi-tation data (monthly and annual means) were taken from high resolution maps obtained from The Climate Source Inc., Corvallis, Oregon. These maps have a pixel resolution of 0.02◦
×0.02◦(approximately 1.5×1.5 km2, Fig. 1), judged sufficient to locate the sam-5
pling sites. These data were created using the PRISM method (parameter-elevation regressions on independent slopes model; Daly et al., 2002), which accounts for to-pography, rain shadows, lake effects, temperature inversions, and more. (ii) For year-specific data we assumed that the principal causes underlying the PRISM maps were also valid at the small scale but were modified by large-scale trends. Daily precipi-10
tation of 40 climate stations, provided by the NOAA Satellite and Information Service (NOAA NCDC Climate Data Online, 2007) were compiled. These stations were situ-ated inside or just outside the sampling area. The latter were included because they improved the geostatistical interpolation at the periphery of the sampling area. To cal-culate PG, the difference between the normal-period mean daily precipitation during 15
the growing period (MPG) and PG was calculated for each meteorological station to quantify the anomaly, dPG. These anomalies were geostatistically interpolated for the whole research area and each year to represent the large-scale spatial pattern of the anomalies. This trend was then superimposed on high-resolution normal-period maps to obtain high-resolution maps for individual years; e.g., for the year 2005 PG05 was 20
given by:
PG05= MGP + dPG05. (3)
While annual precipitation was similar in 2005 and 2006, PG05/06 differed
consider-ably (Fig. 2). In some locations anomalies in PG between the two years and between MGP and PG were as large as 0.6 mm day−1, which was more than one third of the 25
total precipitation. The best geostatistical interpolation was obtained by ordinary krig-ing interpolation with Gaussian models (Fig. 2). In both years there was a trend in
BGD
5, 903–935, 2008 13 C discrimination anomalies of C3 plants in arid grasslands M. Wittmer et al. Title Page Abstract Introduction Conclusions References Tables Figures ◭ ◮ ◭ ◮ Back CloseFull Screen / Esc
Printer-friendly Version Interactive Discussion the anomaly, which decreased from northwest to southeast. In 2005 the trend differed
somewhat in direction, strength, curvature and the position of the zero isohyet com-pared to 2006. In 2006 the zero isohyet was near the center of the sampling area, the south-eastern part of the sampling area was drier than average and the north-western part was wetter. In 2005 the zero isohyet was near the northern border of the research 5
area, and most of the sampling area received less precipitation during the vegetation period than in a normal year (Fig. 2).
3 Results
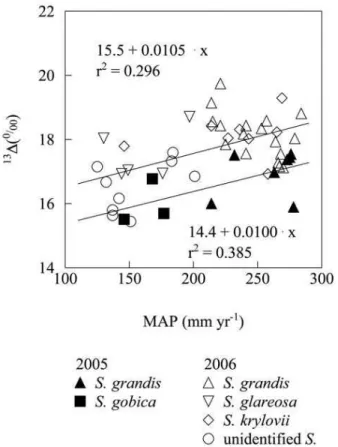
3.1 Carbon isotope discrimination of Stipa as related to mean annual precipitation The gradient of MAP covered by the sampling transects was similar in the two years, 10
and ranged between approx. 130 and 290 mm yr−1 (Fig. 3). 13∆ among Stipa in-creased with MAP in both years, although the increase was only significant in 2006 (P <0.01). The slope of this relationship (13∆ versus MAP) was very similar in both years (P >0.05), but there was a significant offset between the years, so that13∆ at a particular MAP was 1.1‰ higher in 2006 than in 2005. In both years, there was no 15
relationship between13∆ and the C/N ratio of samples.
In both years, the effect of MAP on 13∆ coincided at least partially with species re-placement along the aridity gradient: S. gobica and S. glareosa were only present in the most arid part of the transects (MAP<200 mm yr−1) and had lower than average 13
∆ (Table 2). Conversely, S. grandis and S. krylovii had higher than average13∆ and 20
mainly occurred where MAP was>210 mm yr−1. This was true except for one site with MAP=146 mm yr−1 where Stipa krylovii was also found in 2006. It is not known if S.
krylovii has a wider ecological range with respect to MAP, or if a local hydrological
pecu-liarity, such as local groundwater or lateral water flow, accounted for its presence. The significant separation between species regarding MAP and13∆ suggests that species 25
distribution in the area was (at least partially) determined by MAP, whereas species 13
BGD
5, 903–935, 2008 13 C discrimination anomalies of C3 plants in arid grasslands M. Wittmer et al. Title Page Abstract Introduction Conclusions References Tables Figures ◭ ◮ ◭ ◮ Back CloseFull Screen / Esc
Printer-friendly Version Interactive Discussion 3.2 Carbon isotope discrimination of Stipa as related to actual precipitation
Mean daily precipitation during the growing period ranged from 0.1 to 0.7 mm day−1 in 2005 and from 0.5 to 1.8 mm day−1 in 2006. 13∆ of Stipa collected in 2005 and 2006 followed the same relationship with PG, with13∆ (‰)=15.0+2.53 sqrt PG(Fig. 4). Thus, the difference between years (apparent when13∆ was regressed against MAP) disap-5
peared when13∆ was regressed against growing period precipitation. This suggested that interannual variations in13∆ were related to interannual variations in precipitation. The square root expression indicates that the effect was strong when PGwas very low and decreased with increasing precipitation.
Species did not differ in the relationship between13∆ and PG(highlighted for S. gran-10
dis in Fig. 4). Thus, it seemed that species-replacement was controlled by long-term
precipitation patterns, whereas the within-species response to short-term precipitation patterns controlled13∆.
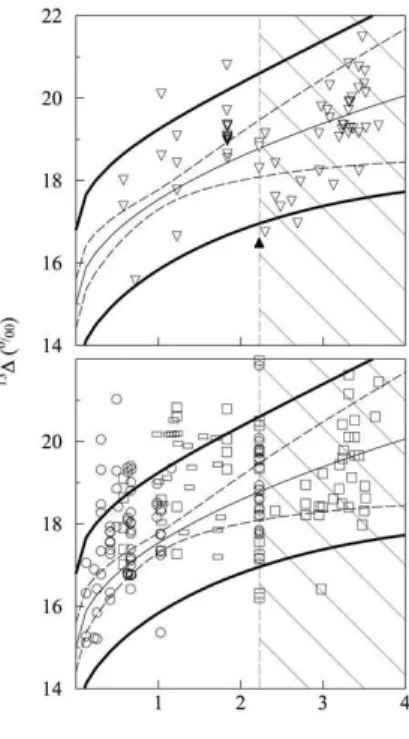
3.3 Comparison with published Stipa data
There were eight data sets (six published and two unpublished; see Table 1) for 15
which the relationship of 13∆ with actual precipitation could be calculated and com-pared with the results from our transects (see Table A2 in supplementary material,
http://www.biogeosciences-discuss.net/5/903/2008/bgd-5-903-2008-supplement.pdf, for precipitation data). These studies reported a total of 62 data for different species of
Stipa. The data corresponded well with the relation derived from the 2005 and 2006
20
samples (Fig. 5 top). Notably, this was also true for studies, in which Stipa experienced higher precipitation than the maximum encountered in our transect studies (Fig. 5, hatched areas denoting PG>2.2 mm day−1). Inclusion of data of Liu et al. (2005) reporting 13∆ of S. bungeana along a rainfall gradient in Northwest China further expanded the range of precipitation, and also agreed with the relationship derived 25
BGD
5, 903–935, 2008 13 C discrimination anomalies of C3 plants in arid grasslands M. Wittmer et al. Title Page Abstract Introduction Conclusions References Tables Figures ◭ ◮ ◭ ◮ Back CloseFull Screen / Esc
Printer-friendly Version Interactive Discussion the notion that the relationship presented in Fig. 4 provides a general and unbiased
prediction of the13∆ of Stipa in the grasslands of Mongolia.
The relation with PG even explained data obtained in 2001 (Table 1), which was an extremely dry year in Inner Mongolia. In that year more than half of the numerous lakes (more than 4000) of the province of Qinghai (in the west of Inner Mongolia) disappeared 5
(Reuters, 2001), and in the Republic of Mongolia the herders lost one quarter of their large-animal livestock such as horses and cattle (Retzer, 2007).
3.4 Comparison with other C3 species
The dependence of13∆ on growing period precipitation in Stipa was also compared with that of ‘non-Stipa’ C3 species. The latter included 170 data from a total of 55 10
species, collected in eight different years (1996, 1999, 2001, 2002, 2003, 2004, 2005 and 2006). Again, the comparison indicated a fair agreement between the precipitation response of13∆ in Stipa and that of the other species, although the scatter was some-what larger in the latter. Still, 80% (135 out of 170) of all non-Stipa data fell inside the 95% confidence interval of Stipa (Fig. 5 bottom). Subdivison of the whole data set in 15
functional groups (monocotsn=163 and dicots n=118; grasses n=143, forbs n=50 and shrubs and semi-shrubsn=68) also provided no evidence for a different precipitation
response at the level of functional groups. However, dicots deviated from monocots insofar as their13∆ was about 0.5‰ higher on average at a given precipitation level. In particular, leaves of Reaumuria soongorica, a short-statured woody shrub, had 1.8‰ 20
higher 13∆ than Stipa and other species at the same precipitation level. Yet, even in
R. soongorica, the slope of the13∆ versus PG relationship did not deviate from that of
Stipa or that of the whole of other species.
3.5 The13∆-response of C3 communities to growing period precipitation
The C3 community-mean 13∆ responded to mean daily growing period precipitation 25
BGD
5, 903–935, 2008 13 C discrimination anomalies of C3 plants in arid grasslands M. Wittmer et al. Title Page Abstract Introduction Conclusions References Tables Figures ◭ ◮ ◭ ◮ Back CloseFull Screen / Esc
Printer-friendly Version Interactive Discussion which compressed the 95% confidence interval for the data points. The regression
for the community data, calculated to obtain a robust relation over the entire range of precipitation, was virtually the same relation as that for Stipa, but the confidence interval of the regression remained narrow over the entire range due to the continuous support by data.
5
3.6 The relationship between precipitation anomalies and13∆ anomalies
The deviation of growing period precipitation from the long-term mean (precipitation anomaly) was directly related to the deviation between actual13∆ discrimination and 13
∆ predicted for mean conditions at the respective sites (13∆ anomaly). This effect was manifest at the level of C3 communities (Fig. 7), and species (data not shown). The 10
precipitation anomalies modified the community-mean13∆ by ±1‰. The response at the community level and the large spatial extension of precipitation anomalies imply that this response was also effective at larger scales.
4 Discussion
4.1 Interannual variation of13∆ results from growing period precipitation anomalies 15
This work reveals strong effects of interannual variation in precipitation on13∆ of C3 plants in the grasslands of Mongolia. This effect was particularly evident in the genus
Stipa for which a large data set was available from collections along precipitation
gradi-ents in two different years, and published data from several years. Moreover, the effect was also apparent at the level of communities and functional groups (grasses other 20
than Stipa, perennial forbs, and shrubs and semi-shrubs). An important consequence of the interannual variability of precipitation was that it caused interannual fluctuations in the relationship between (annually determined)13∆ and MAP. This means, that a sta-ble and unbiased relationship between13∆ and MAP can only be obtained by relating long-term averaged13∆ to MAP.
BGD
5, 903–935, 2008 13 C discrimination anomalies of C3 plants in arid grasslands M. Wittmer et al. Title Page Abstract Introduction Conclusions References Tables Figures ◭ ◮ ◭ ◮ Back CloseFull Screen / Esc
Printer-friendly Version Interactive Discussion Interannual variation of13∆ (or δ13C) has been observed before, particularly in trees
(Sparks and Ehleringer, 1997; Warren et al., 2001; Li et al., 2007), but also in grassland (Tsialtas et al., 2001; Mole et al., 1994), and was also explained by rainfall anomalies (Li et al., 2007; Mole et al., 1994) or other weather related factors (e.g., seasonal vari-ation in water vapour deficit as reported by Sparks and Ehleringer (1997), varivari-ation in 5
soil water content as reported by Tsialtas et al. (2001) and Schnyder et al. (2006)). However, effects of weather anomalies on13∆ have generally not been considered in aridity transect studies. It is evident from the present work, that (at least) part of the variation in13∆ observed in those studies (e.g., compare studies of Gong et al. (2007)1 or Wang et al. (2005)) can be explained by such deviations of growing year weather 10
conditions from long-term mean conditions. This may also include interannual variabil-ity of soil moisture and atmospheric vapour pressure, which exert direct effects on13∆ (Sparks and Ehleringer, 1997; Tsialtas et al., 2001). However, since these factors are usually (but not always, see Schulze et al., 1996) correlated with precipitation, their effect is (at least partially) included in the relationship of13∆ with year-specific growing 15
period precipitation.
4.2 Species, functional groups and communities share the same precipitation re-sponse of13∆
The13∆-response (that is the slope of the relationship between13∆ and PG) of S.
gran-dis was the same as that of the other members of Stipa in the data base. It was also
20
very similar to the “mean” species response, and the response of C3 communities. Even in R. soongorica, which had a comparatively high13∆ in all rainfall conditions, the slope of the relationship between13∆ and year-specific growing period precipitation was the same as that of the “mean” species. Although the relationship between13∆ and growing period precipitation has not been studied in any detail, the uniformity in 25
the13∆ responses of species’ or functional groups to rainfall, as seen here, was not expected: inter-specific differences in the13∆-response to environmental parameters
BGD
5, 903–935, 2008 13 C discrimination anomalies of C3 plants in arid grasslands M. Wittmer et al. Title Page Abstract Introduction Conclusions References Tables Figures ◭ ◮ ◭ ◮ Back CloseFull Screen / Esc
Printer-friendly Version Interactive Discussion have been observed before (e.g., Handley et al., 1994), and the adaptive significance
of different strategies of water use have been discussed and emphasized (e.g., Gollus-cio and Oesterheld, 2007). Yet, we acknowledge that, although the number of species in the data base was relatively large (55 C3 species, including 7 Stipa species), it was nevertheless a small fraction of the total flora of the grasslands of Mongolia. Moreover, 5
the data base was dominated by perennial grasses (over 50% of all data). But in this respect the data base reflects the species composition of most grassland communities of Mongolia. For instance, Stipa accounted for more than 40% and perennial grasses (including Stipa) for more than 70% of total aboveground biomass in the communities sampled in 2005. Perennial grasses from arid and semi-arid temperate grasslands 10
share great similarities in phenology, leaf structure, and root architecture and place-ment, which may explain the similarity in their water use (Golluscio and Oesterheld, 2007). Thus, the similarity in the precipitation response of13∆ by C3 communities was related to the predominance of perennial grasses (particularly Stipa) in these com-munities and the similarity in water use strategies among grasses. These similarities 15
might also explain, why species-replacement along the aridity gradient did not affect the precipitation response of13∆ (Fig. 4).
Nevertheless, there was significant scatter in the overall relationship between 13∆ and growing period precipitation. Although there was no difference between functional groups, the scatter may partly be due to differences between species within groups. 20
Differences between species have been interpreted in terms of differences in intrinsic water use efficiency (e.g., Condon et al., 1990; Meinzer et al., 1992; Ehleringer et al., 1992) and may be related to differences in phenology (e.g., Smedley et al., 1991), root-ing pattern/depth (Golluscio and Oesterheld, 2007) and leaf anatomy (includroot-ing leaf thickness and nitrogen content) (Farquhar et al., 1989; Schulze et al., 2006). Mech-25
anisms also include special adaptations to arid conditions such as leaf shedding in response to drought as expressed in R. soongorica (Ma et al., 2005) and phreatophyte lifestyle. This also explains, why the precipitation response at the community level was associated with much less scatter than that at the species level (cf. Figs. 4 and 6):
BGD
5, 903–935, 2008 13 C discrimination anomalies of C3 plants in arid grasslands M. Wittmer et al. Title Page Abstract Introduction Conclusions References Tables Figures ◭ ◮ ◭ ◮ Back CloseFull Screen / Esc
Printer-friendly Version Interactive Discussion communities include species with a range of functional attributes that imply differences
in13∆.
Finally, there exists large short-term, small-scale variability in precipitation in the re-gion, which is not represented entirely when interpolating precipitation at collection sites from weather station data. For instance, the Erenhot and Zamyn-Uud weather 5
stations are separated by approximately 10 km but differ by an average of 15 mm in the monthly precipitation during the growing period. Such variations in rainfall are fre-quent even within one kilometre and increase in strength with continentality (Fiener and Auerswald, 20082). Therefore, errors in precipitation estimates are probably substantial and explain some of the scatter in the13∆ versus precipitation relationship.
10
4.3 A stable and unbiased relationship between13∆ and precipitation for use in C3:C4 mixing models
The findings of this work are useful for estimation of the relative abundance of C3 and C4 vegetation in community biomass from community 13∆ (13∆community), which requires knowledge of the 13∆ of the C3 (13∆3) and C4 (
13
∆4) members in a two-15
component mixing model (e.g., Still et al., 2003). Evidently, errors in the assessment of 13
∆3and 13
∆4cause errors in the estimation of C3:C4 abundance. In general, neglect of variation of13∆3 or
13
∆4 overestimates the true variation of the fraction of C3 (and C4) vegetation in communities, because all variation of 13∆community is attributed to variation in the relative abundances of C3 and C4 plants. If variation of13∆3(or
13 ∆4) 20
is systematic, then neglect of this variation provokes a biased variation of the relative abundances of C3 and C4 plants. For instance, neglect of the effect of aridity on13∆ of C3 plants would lead to an underestimation of the relative abundance of C3 plants in the dry section of the transect. As shown above the potential variation of13∆3is large in semi-arid and arid grassland, creating opportunities for large errors in estimation of the 25
2
Fiener, P. and Auerswald, K.: Farm-scale spatio-temporal variability of rainfall characteris-tics, J. Hydrol., revised, 2008
BGD
5, 903–935, 2008 13 C discrimination anomalies of C3 plants in arid grasslands M. Wittmer et al. Title Page Abstract Introduction Conclusions References Tables Figures ◭ ◮ ◭ ◮ Back CloseFull Screen / Esc
Printer-friendly Version Interactive Discussion relative abundance of C3 and C4 plants from13∆community. In the present study aridity
caused a variation of13∆3of up to ∼5‰ (Fig. 6). This is about one third to one half of the difference in13∆ between C3 and C4 plants in arid and semiarid grassland (Schulze et al., 1996; Wang et al., 2005). Accordingly, the shift from the wet to the dry end of the aridity gradient has the same effect on13∆3, as a 33% to 50% replacement by C4 5
plants. A possible systematic variation of13∆community must also be considered when interpreting long-term records such as soil organic matter or sediments in terms of the C3:C4 abundance. Variation of 13∆4 would have a similar effect, although, variation in13∆4 is generally smaller (e.g., Liu et al., 2005; Wang et al., 2005) than that of C3 plants and communities as observed here, and13∆4 responds much less to drought 10
(Schulze et al., 1996; Ghannoum et al., 2002). Yet, there exist systematic differences in13∆ between C4 metabolic types (e.g., Schulze et al., 1996; Ghannoum et al., 2002) and the relative abundance of metabolic types may change with aridity (Schulze et al., 1996).
5 Conclusions
15
This work demonstrates that rainfall anomalies cause large variations of the13∆ ver-sus MAP relationship, which are greatly reduced when13∆ is related to growing period rainfall. Significantly, the 13∆-response to growing period rainfall was stable across years, and it was very similar for dominant species (Stipa members), functional groups (including herbaceous dicots, semi-shrubs and grasses), and C3 communities. More-20
over, the relation was also valid outside the geographical and climatic range where it was developed, giving proof of its robustness. Because of its generality and stability, the relationship between 13∆ and growing period rainfall allows an unbiased estima-tion of13∆ of the C3 member for use in C3:C4 mixing models based on community C isotope composition.
BGD
5, 903–935, 2008 13 C discrimination anomalies of C3 plants in arid grasslands M. Wittmer et al. Title Page Abstract Introduction Conclusions References Tables Figures ◭ ◮ ◭ ◮ Back CloseFull Screen / Esc
Printer-friendly Version Interactive Discussion
Acknowledgements. This research was funded by the DFG within the Research Group 563
MAGIM. We thank M. Breitsameter and A. Schmidt for assistance with sample preparation for isotope analysis, and W. Liu (Institute of Earth and Environment, The Chinese Academy of Sciences) and Y. Gao (Institut f ¨ur Pflanzenern ¨ahrung, Christian-Albrechts Universit ¨at zu Kiel) for providing data.
5
References
Allison, C. E., Francey, R. J., and Krummel, P. B.:δ13C in CO2from sites in the CSIRO Atmo-spheric Research GASLAB air sampling network, Trends: A Compendium of Data on Global Change, Carbon Dioxide Information Analysis Center, Oak Ridge National Laboratory, U.S. Department of Energy, Oak Ridge, TN, USA, 2003.
10
Buchmann, N., Brooks, J. R., Rapp, K. D., and Ehleringer, J. R.: Carbon isotope composition of C4 grasses is influenced by light and water supply, Plant Cell Environ., 19(4), 392–402, 1996.
Cerling, T. E. and Harris, J. M.: Carbon isotope fractionation between diet and bioapatite in ungulate mammals and implication for ecological and paleoecological studies, Oecologica, 15
120(3), 347–363, 1999.
Chen, S. P., Bai, Y. F., and Han, X. G.: Variation of Water-Use Efficiency of Leymus chinensis and Cleistogenes squarrosa in different plant communities in Xilin River Basin, Nei Mongol, Acta Bot. Sin., 44(12), 1484–1490, 2002.
Chen, S. P., Bai, Y. F., Guanghui, L., and Han, X. G.: Variations in life-form composition and 20
foliar carbon isotope discrimination among eight plant communities under different soil mois-ture conditions in the Xilin River Basin, Inner Mongolia, China, Ecol. Res., 20(2), 167–176, 2005.
Condon, A. G., Farquhar, G. D., and Richards, R. A.: Genotypic variation in carbon isotope discrimination and transpiration efficiency in wheat – leaf gas-exchange and whole plant 25
studies, Aust. J. Plant. Physiol., 17(1), 9–22, 1990.
Conway, T. J., Tans, P. P., and Waterman L. S.: Atmospheric CO2 records from sites in the NOAA/CMDL air sampling network, Trends ’93: A Compendium of Data on Global Change, Carbon Dioxide Information Analysis Center, Oak Ridge National Laboratory, U.S. Depart-ment of Energy, Oak Ridge, TN, USA, 1994.
BGD
5, 903–935, 2008 13 C discrimination anomalies of C3 plants in arid grasslands M. Wittmer et al. Title Page Abstract Introduction Conclusions References Tables Figures ◭ ◮ ◭ ◮ Back CloseFull Screen / Esc
Printer-friendly Version Interactive Discussion
Daly, C., Gibson, W. P., Taylor, G. H., Johnson, G. L., and Pasteris, P.: A knowledge-based approach to the statistical mapping of climate, Climate Res., 22, 99–113, 2002.
Ehleringer, J. R., Phillips, S. L., and Comstock, J. P.: Seasonal-variation in the carbon isotopic composition of desert plants, Funct. Ecol., 6(4), 396–404, 1992.
Farquhar, G. D., Ehleringer, J. R., and Hubick, K. T.: Carbon isotope discrimination and photo-5
synthesis, Annu. Rev. Plant Phys., 40, 503–537, 1989.
Francey, R. J., Allison, C. E., Etheridge, D. M., Trudinger, C. M., Enting, I. G., Leuenberger, M., Langenfelds, R. L., Michel, E., and Steele L. P.: A 1000-year high precision record ofδ13C in atmospheric CO2, Tellus B, 51(2), 170–193, 1999.
Friedli, H., L ¨otscher, H., Oeschger, H., Siegenthaler, U., and Stauffer, B.: Ice core record of the 10
C-13/C-12 ratio of the atmospheric CO2in the past 2 centuries, Nature, 324(6094), 237–238, 1986.
Garten, C. T. and Taylor, G. E.: Foliarδ13C within a temperate deciduous forest: spatial, tem-poral and species sources of variation, Oecologia, 90(1), 1–7, 1992.
Gat, J. R., Mook, W. G., and Meijer, H. A. J.: Environmental isotopes in the hydrological cycle, 15
principles and applications, Vol. II: Atmospheric water, www.iaea.org/programmes/ripc/ih/
volumes/volume2.htm, 2001.
Geist, J., Auerswald, K., and Boom, A.: Stable carbon isotopes in freshwater mussel shells: En-vironmental record or marker for metabolic activity?, Geochim. Cosmochim. Ac., 69, 3545– 3554, 2005.
20
Ghannoum, O., von Caemmerer, S., and Conroy, J. P.: The effect of drought on plant water use efficiency of nine NAD-ME and nine NADP-ME Australian C4 grasses, Funct. Plant Biol., 29(11), 1337–1348, 2002.
Golluscio, R. A. and Oesterheld, M.: Water use efficiency of twenty-five co-existing Patagonian species growing under different soil water availability, Oecologia, 54(1), 207–217, 2007. 25
Gong, D. Y., Shi, P. J., and Wang, J. A.: Daily precipitation changes in the semi-arid region over northern China, J. Arid Environ., 59(4), 771–778, 2004.
Google Earth: Google Inc. CA 94043, USA, Version 4.2.0181.2634 (beta), 2007.
Handley, L. L., Odee, D., and Scrimgeour, C. M.:δ15N andδ13C patterns in savannah vegeta-tion: dependence on water availability and disturbance, Funct. Ecol., 8(3), 306–314, 1994. 30
Ivanov, L. A., Ivanova, L. A., Ronzhina, D. A., Ziegler, H., Deigele, K., Gunin, P. D., and Pyankov, V. I.: Effects of interspecific competition on functional properties of plants in mountain-steppe communities of the Gobi, Russ. Plant Physiol., 38(3), 155–160, 2007.
BGD
5, 903–935, 2008 13 C discrimination anomalies of C3 plants in arid grasslands M. Wittmer et al. Title Page Abstract Introduction Conclusions References Tables Figures ◭ ◮ ◭ ◮ Back CloseFull Screen / Esc
Printer-friendly Version Interactive Discussion
Kaplan, J. O., Prentice, I. C., and Buchmann, N.: The stable carbon isotope composition of the terrestrial biosphere: modelling at scales from the leaf to the globe, Global Biogeochem. Cy., 16(4), 1060, doi:10.1029/2001GB001403, 2002.
Keeling, C. D., Mook, W. G., and Tans, P. P.: Recent trends in the C-13-C-12 ratio of atmo-spheric carbon-dioxide, Nature, 277(5692), 121–123, 1979.
5
Kerven, C., Channon, J., and Behnke, R.: Planning and policies on extensive livestock develop-ment in Central Asia, Overseas Developdevelop-ment Institute, Working Paper 91, London: Overseas Development Institute, 1996.
K ¨orner, C., Farquhar, G. D., and Roksandic, Z.: A global survey of carbon isotope discrimination in plants from high-altitude, Oecologia, 74(4), 623–632, 1988.
10
Li, Y. B., Chen, T., Zhang, Y. F., and An, L. Z.: The relation of seasonal pattern in stable carbon composition to meteorological variables in the leaves of Sabina przewalskii Kom. and Sabina
chinensis (Lin.) Ant., Environ. Geol., 51(7), 1279–1284, 2007.
Liu, X. Q., Wang, R. Z., and Li, Y. Z.: Photosynthetic pathway types in rangeland plant species from Inner Mongolia, North China, Photosynthetica, 42(3), 339–344, 2004.
15
Liu, W. G., Feng, X. H., Ning, Y. F., Zhang, Q. L., Cao, Y. N., and An, Z. S.:δ13C variation of C3 and C4 plants across an Asian monsoon rainfall gradient in arid northwestern China, Glob. Change Biol., 11, 1094–1100, 2005.
Ma, J. Y., Chen, T., Qiang, W. Y., and Wang, G.: Correlations between foliar stable isotope composition and environmental factors in desert plant Reaumuria soongorica (Pall.) Maxim, 20
J. Integr. Plant Biol., 47, 1065–1073, 2005.
Maennel, T. T., Auerswald, K., and Schnyder, H.: Altitude gradients of grassland carbon and nitrogen isotope composition are recorded in hair of grazers, Global Ecol. Biogeogr., 16(5), 583–592, 2007.
Meinzer, F. C., Rundel, P. W., Goldstein, G., and Sharifi, M. R.: Carbon isotope composition 25
in relation to leaf gas-exchange and environmental-conditions in Hawaiian metrosideros-polymorpha populations, Oecologia, 91(3), 305–311, 1992.
Mole, S., Joern, A., O’Leary, M. H., and Madhaven, S.: Spatial and temporal variation in carbon-isotope discrimination in prairie graminoids, Oecologia, 97(3), 316–321, 1994.
Nielsen, D. R. and Wendroth, O.: Spatial and temporal statistics – Sampling field soils and their 30
vegetation, Catena Verlag, Reiskirchen, 398 pp., 2003.
NOAA NCDC Climate Data Online:http://cdo.ncdc.noaa.gov/CDO/cdo, 2007.
BGD
5, 903–935, 2008 13 C discrimination anomalies of C3 plants in arid grasslands M. Wittmer et al. Title Page Abstract Introduction Conclusions References Tables Figures ◭ ◮ ◭ ◮ Back CloseFull Screen / Esc
Printer-friendly Version Interactive Discussion
Pyankov, V. I., Gunin, P. D., Tsoog, S., and Black, C. C.: C-4 plants in the vegetation of Mongo-lia: their natural occurrence and geographical distribution in relation to climate, Oecologia, 123(1), 15–31, 2000.
R Development Core Team: R: A language and environment for statistical computing, R Foun-dation for Statistical Computing, Vienna, Austria, ISBN 3-900051-07-0,http://www.R-project.
5
org, 2007.
Randerson, J. T., Collatz, G. J., Fessenden, J. E., Munoz, A. D., Still, C. J., Berry, J. A., Fung, I. Y., Suits, N., and Denning, A. S.: A possible global covariance between ter-restrial gross primary production and C-13 discrimination: Consequences for the atmo-spheric C-13 budget and its response to ENSO, Global Biogeochem. Cy., 16(4), 1136, 10
doi:10.1029/2001GB001845, 2002.
Retzer, V.: Forage competition between livestock and Mongolian pika, Basic Appl. Ecol., 8(2), 147–157, 2007.
Reuters: Water sources for China Yellow River dry up Xinhua, Reuters News Service, Beijing, China,www.planetark.org/dailynewsstory.cfm/newsid/12711/story.htm, 10 October, 2001. 15
Ribeiro, P. J. and Diggle, P. J.: geoR: a package for geostatistical analysis, R-NEWS, 1(2), 15–18, 2001.
Sachs, L. and Hedderich, J.: Angewandte Statistik, Springer, Berlin, 2006.
Schnute, J., Boers, N., Haigh, R., et al.: PBSmapping: PBS Mapping 2.54, R package version 2.54, 2007.
20
Schnyder, H., Schwertl, M., Auerswald, K., and Sch ¨aufele, R.: Hair of grazing cattle provides an integrated measure of the effects of the site conditions and interannual weather variability onδ13C of temperate humid grassland, Glob. Change Biol., 12, 1–15, 2006.
Schulze, E. D., Ellis, R., Schulze, W., and Trimborn, P.: Diversity, metabolic types and delta C-13 carbon isotope ratios in the grass flora of Namibia in relation to growth form, precipitation 25
and habitat conditions, Oecologia, 106(3), 352–369, 1996.
Schulze, E. D., Turner, N. C., Nicolle, D., and Schumacher, J.: Species differences in carbon isotope ratios, specific leaf area and nitrogen concentrations in leaves of Eucalyptus growing in a common garden compared with along an aridity gradient, Physiol. Plantarum, 127(3), 434–444, 2006.
30
Smedley, M. P., Dawson, T. E., Comstock, J. P., Donovan, L. A., Sherrill, D. E., Cook, C. S., and Ehleringer, J. R.: Seasonal carbon isotope discrimination in a grassland community, Oecologia, 85(3), 314–320, 1991.
BGD
5, 903–935, 2008 13 C discrimination anomalies of C3 plants in arid grasslands M. Wittmer et al. Title Page Abstract Introduction Conclusions References Tables Figures ◭ ◮ ◭ ◮ Back CloseFull Screen / Esc
Printer-friendly Version Interactive Discussion
Sparks, J. P. and Ehleringer, J. R.: Leaf carbon isotope discrimination and nitrogen content for riparian trees along elevational transects, Oecologia, 109(3), 362–367, 1997.
Still, C. J., Berry, J. A., Ribas-Carbo, M., and Helliker, B. R.: The contribution of C3 and C4 plants to the carbon cycle of a tallgrass prairie: an isotopic approach, Oecologia, 136(3), 347–359, 2003.
5
Tans, P. P. and Conway, T. J.: Monthly atmospheric CO2 mixing ratios from the NOAA CMDL Carbon Cycle Cooperative Global Air Sampling Network, 1968–2002, A Compendium of Data on Global Change, Carbon Dioxide Information Analysis Center, Oak Ridge National Laboratory, U.S. Department of Energy, Oak Ridge, TN, USA, 2005.
The Climate Source LLC, Corvallis, OR, USA: PRISM spatial climate datasets for Mongolia and 10
Inner Mongolia, 2002.
Tsialtas, J. T., Handley, L. L., Kassioumi, M. T., Veresoglou, D. S., and Gagianas, A. A.: Inter-specific variation in potential water-use efficiency and its relation to plant species abundance in a water-limited grassland, Funct. Ecol., 15(5), 605–614, 2001.
Wang, G., Han, J. M., and Liu, D.: The carbon isotope composition of C3 herbaceous plants in 15
loess area of Northern China, Sci. China Ser. D, 46(10), 1069–1076, 2003.
Wang, G. A., Han, J. M., Zhou, L. P., Xiong, X. G., and Wu, Z.: Carbon isotope ratios of plants and occurrences of C4species under different soil moisture regimes in arid region of Northwest China, Physiol. Plantarum, 125(1), 74–81, 2005.
Warren, C. R., McGrath, J. F., and Adams, M. A.: Water availability and carbon isotope discrim-20
ination in conifers, Oecologia, 127(4), 476–486, 2001.
Webster, R. and Oliver, M.: Geostatistics for environmental scientists, Statistics in Practice, Wiley & Sons, Chichester, ISBN 0-471-96553-7, 2004.
Xiao, X., Ojima, D. S., Parton, W. J., Chen, Z., and Chen, D.: Sensitivity of Inner Mongolian grasslands to Climate Change, J. Biogeogr., 22, 643–648, 1995a.
25
Xiao, X., Wang, Y. F., Jiang, S., Ojima, D. S., and Bonham, C. D.: Interannual variation in the Climate and aboveground biomass of Leymus chinense Steppe and Stipa grandis steppe in the Xilin River Basin, Inner-Mongolia, China, J. Arid Environ., 31(3), 283–299, 1995b. Zheng, S. X. and Shangguan, Z. P.: Foliarδ13C values of nine dominant species in the Loess
Plateau of China, Photosynthetica, 45(1), 110–119, 2007. 30
BGD
5, 903–935, 2008 13 C discrimination anomalies of C3 plants in arid grasslands M. Wittmer et al. Title Page Abstract Introduction Conclusions References Tables Figures ◭ ◮ ◭ ◮ Back CloseFull Screen / Esc
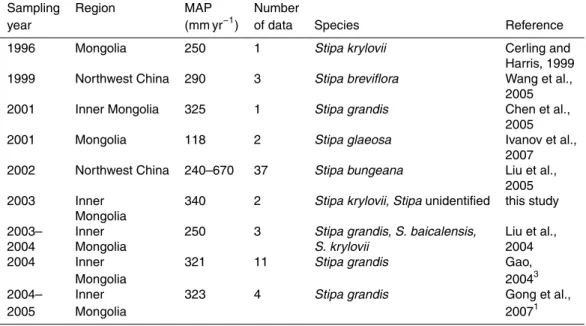
Printer-friendly Version Interactive Discussion Table 1. Sampling year, region, mean annual precipitation (MAP) and species name of
litera-ture references and own data used for validation. Top: Stipa data, bottom: other C3 species.
Sampling Region MAP Number
year (mm yr−1) of data Species Reference
1996 Mongolia 250 1 Stipa krylovii Cerling and
Harris, 1999
1999 Northwest China 290 3 Stipa breviflora Wang et al.,
2005
2001 Inner Mongolia 325 1 Stipa grandis Chen et al.,
2005
2001 Mongolia 118 2 Stipa glaeosa Ivanov et al.,
2007
2002 Northwest China 240–670 37 Stipa bungeana Liu et al.,
2005 2003 Inner 340 2 Stipa krylovii, Stipa unidentified this study
Mongolia
2003– Inner 250 3 Stipa grandis, S. baicalensis, Liu et al.,
2004 Mongolia S. krylovii 2004
2004 Inner 321 11 Stipa grandis Gao,
Mongolia 20043
2004– Inner 323 4 Stipa grandis Gong et al.,
BGD
5, 903–935, 2008 13 C discrimination anomalies of C3 plants in arid grasslands M. Wittmer et al. Title Page Abstract Introduction Conclusions References Tables Figures ◭ ◮ ◭ ◮ Back CloseFull Screen / Esc
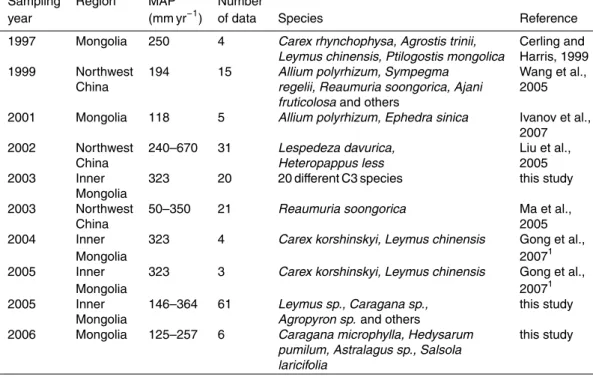
Printer-friendly Version Interactive Discussion Table 1. Continued.
Sampling Region MAP Number
year (mm yr−1) of data Species Reference
1997 Mongolia 250 4 Carex rhynchophysa, Agrostis trinii, Cerling and Leymus chinensis, Ptilogostis mongolica Harris, 1999
1999 Northwest 194 15 Allium polyrhizum, Sympegma Wang et al.,
China regelii, Reaumuria soongorica, Ajani 2005
fruticolosa and others
2001 Mongolia 118 5 Allium polyrhizum, Ephedra sinica Ivanov et al., 2007
2002 Northwest 240–670 31 Lespedeza davurica, Liu et al.,
China Heteropappus less 2005
2003 Inner 323 20 20 different C3 species this study
Mongolia
2003 Northwest 50–350 21 Reaumuria soongorica Ma et al.,
China 2005
2004 Inner 323 4 Carex korshinskyi, Leymus chinensis Gong et al.,
Mongolia 20071
2005 Inner 323 3 Carex korshinskyi, Leymus chinensis Gong et al.,
Mongolia 20071
2005 Inner 146–364 61 Leymus sp., Caragana sp., this study
Mongolia Agropyron sp. and others
2006 Mongolia 125–257 6 Caragana microphylla, Hedysarum this study pumilum, Astralagus sp., Salsola
laricifolia
1
Gong, X., Brueck, H., Giese, M., Limeng, Z., Sattelmacher, B., and Shan, L.: Slope direction has effects on productivity and species composition of hilly grassland in the Xilin River Basin, Inner Mongolia, China, Institute of Plant Nutrition and Soil Science, Christian-Albrechts Univer-sit ¨at zu Kiel, J. Arid Environ., submitted, 2007.
3
Gao, Y.: Yinzhi Gao, Institut f ¨ur Pflanzenern ¨ahrung, Christian-Albrechts Universit ¨at zu Kiel, unpublished data, 2004.
BGD
5, 903–935, 2008 13 C discrimination anomalies of C3 plants in arid grasslands M. Wittmer et al. Title Page Abstract Introduction Conclusions References Tables Figures ◭ ◮ ◭ ◮ Back CloseFull Screen / Esc
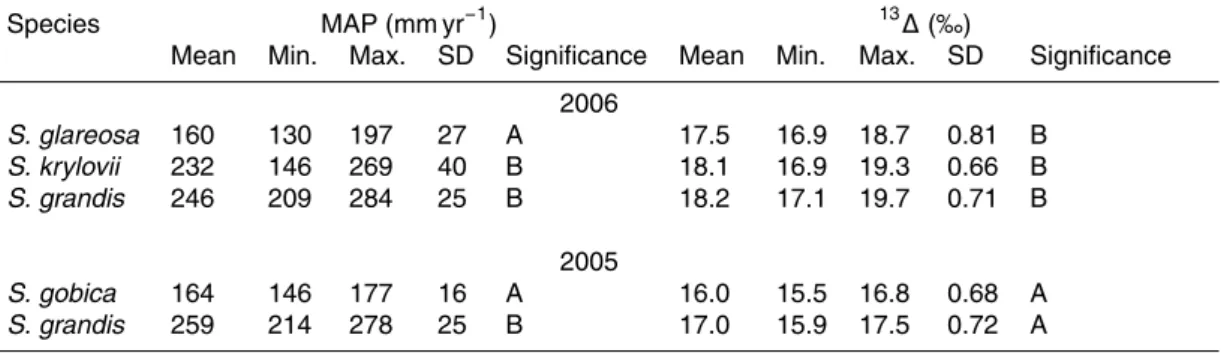
Printer-friendly Version Interactive Discussion Table 2. Mean annual precipitation (MAP) at sampling sites and carbon isotope discrimination
(13∆) of different species of Stipa in the 2005 and 2006 transect studies. Mean, minimum and maximum, standard deviation (SD), and significance of species separation atP <0.05.
Species MAP (mm yr−1) 13
∆ (‰)
Mean Min. Max. SD Significance Mean Min. Max. SD Significance
2006 S. glareosa 160 130 197 27 A 17.5 16.9 18.7 0.81 B S. krylovii 232 146 269 40 B 18.1 16.9 19.3 0.66 B S. grandis 246 209 284 25 B 18.2 17.1 19.7 0.71 B 2005 S. gobica 164 146 177 16 A 16.0 15.5 16.8 0.68 A S. grandis 259 214 278 25 B 17.0 15.9 17.5 0.72 A
BGD
5, 903–935, 2008 13 C discrimination anomalies of C3 plants in arid grasslands M. Wittmer et al. Title Page Abstract Introduction Conclusions References Tables Figures ◭ ◮ ◭ ◮ Back CloseFull Screen / Esc
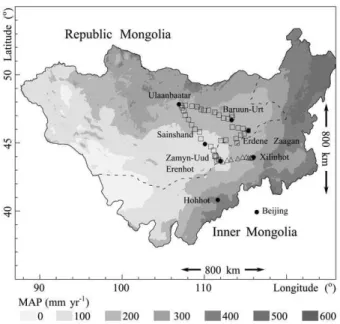
Printer-friendly Version Interactive Discussion Fig. 1. Mean Annual Precipitation (MAP, mm yr−1; normal period 1961–1990), major towns and
sampling sites (triangles denote the 2005 and squares the 2006 sampling campaign; data from Climate Source Inc.).
BGD
5, 903–935, 2008 13 C discrimination anomalies of C3 plants in arid grasslands M. Wittmer et al. Title Page Abstract Introduction Conclusions References Tables Figures ◭ ◮ ◭ ◮ Back CloseFull Screen / Esc
Printer-friendly Version Interactive Discussion Fig. 2. Isohyet maps for the annual precipitation in 2005 (top left) and 2006 (top right) and of
the anomalies in mean daily precipitation during the growing period (dPG) 2005 (bottom left) and 2006 (bottom right). For details see text. Circles denote sampling sites, dashed lines the border between the Republic of Mongolia and Inner Mongolia Autonomous Region of China. Mean krige standard deviation is 46 mm yr−1 (top left), 52 mm yr−1 (top right), 0.32 mm day−1
BGD
5, 903–935, 2008 13 C discrimination anomalies of C3 plants in arid grasslands M. Wittmer et al. Title Page Abstract Introduction Conclusions References Tables Figures ◭ ◮ ◭ ◮ Back CloseFull Screen / Esc
Printer-friendly Version Interactive Discussion Fig. 3. Carbon isotope discrimination (13∆) of different Stipa species depending on mean
BGD
5, 903–935, 2008 13 C discrimination anomalies of C3 plants in arid grasslands M. Wittmer et al. Title Page Abstract Introduction Conclusions References Tables Figures ◭ ◮ ◭ ◮ Back CloseFull Screen / Esc
Printer-friendly Version Interactive Discussion Fig. 4. 13∆ and mean daily precipitation during the growing period (PG) for Stipa species
BGD
5, 903–935, 2008 13 C discrimination anomalies of C3 plants in arid grasslands M. Wittmer et al. Title Page Abstract Introduction Conclusions References Tables Figures ◭ ◮ ◭ ◮ Back CloseFull Screen / Esc
Printer-friendly Version Interactive Discussion Fig. 5. Validation of the13∆ versus mean daily precipitation relationship of Stipa sp. shown in
Fig. 4. Top panel: Stipa data from eight studies (n=64) given in Table 2. Bottom panel: data
from other (“non-Stipa”) C3 species as taken from literature (squares; n=83; see Table 1) or collected in our own 2005 and 2006 transect studies (circles;n=87, see Table 1). Data from
Reaumuria soongorica (from Ma et al., 2005; samples obtained in 2003) are shown as
rect-angles (n=21). In both panels, the lines denote the Stipa regression from Fig. 4, which was obtained from the 2005 and 2006 samples (central line), the 95% confidence intervals for the regression (dashed inner lines) and the 95% confidence intervals for the individual Stipa sam-ples collected in 2005 and 2006 (thick outer lines). The hatched areas denote the precipitation range that exceeded the range covered by the 2005 and 2006 sampling transects.
BGD
5, 903–935, 2008 13 C discrimination anomalies of C3 plants in arid grasslands M. Wittmer et al. Title Page Abstract Introduction Conclusions References Tables Figures ◭ ◮ ◭ ◮ Back CloseFull Screen / Esc
Printer-friendly Version Interactive Discussion Fig. 6.13∆ and PGfor C3 communities from this study (closed triangles) in 2005 (n=10), in 2006
(n=3) and in 2007 (n=8) and from literature data (squares; n=35). All data were adjusted to a
common altitude of 1000 m a.s.l. The middle line denotes the square-root regression, dashed lines the 95%-confidence interval for the regression and outer bold lines the 95%-confidence interval for the data points.
BGD
5, 903–935, 2008 13 C discrimination anomalies of C3 plants in arid grasslands M. Wittmer et al. Title Page Abstract Introduction Conclusions References Tables Figures ◭ ◮ ◭ ◮ Back CloseFull Screen / Esc
Printer-friendly Version Interactive Discussion Fig. 7. Relation of the anomalies in C3 community mean13∆ and growing period precipitation
(same communities as in Fig. 6). Both anomalies are expressed as the difference between the annual and the long-term value. The long-term average discrimination,13∆MP, was calculated
from the equation shown in Fig. 6. Year-specific precipitation for the sites of other studies was obtained by geostatistical interpolation analogously to our own data.