HAL Id: hal-00297703
https://hal.archives-ouvertes.fr/hal-00297703
Submitted on 11 Jun 2008
HAL is a multi-disciplinary open access
archive for the deposit and dissemination of
sci-entific research documents, whether they are
pub-lished or not. The documents may come from
teaching and research institutions in France or
abroad, or from public or private research centers.
L’archive ouverte pluridisciplinaire HAL, est
destinée au dépôt et à la diffusion de documents
scientifiques de niveau recherche, publiés ou non,
émanant des établissements d’enseignement et de
recherche français ou étrangers, des laboratoires
publics ou privés.
Central Asian grassland as related to long-term and
short-term precipitation patterns
M. H. O. M. Wittmer, K. Auerswald, R. Tungalag, Y. F. Bai, R. Schäufele, H.
Schnyder
To cite this version:
M. H. O. M. Wittmer, K. Auerswald, R. Tungalag, Y. F. Bai, R. Schäufele, et al.. Carbon isotope
discrimination of C3 vegetation in Central Asian grassland as related to long-term and short-term
precipitation patterns. Biogeosciences, European Geosciences Union, 2008, 5 (3), pp.913-924.
�hal-00297703�
www.biogeosciences.net/5/913/2008/
© Author(s) 2008. This work is distributed under the Creative Commons Attribution 3.0 License.
Biogeosciences
Carbon isotope discrimination of C3 vegetation in Central Asian
grassland as related to long-term and short-term precipitation
patterns
M. H. O. M. Wittmer1, K. Auerswald1, R. Tungalag2, Y. F. Bai3, R. Sch¨aufele1, and H. Schnyder1
1Lehrstuhl f¨ur Gr¨unlandlehre, Technische Universit¨at M¨unchen, Am Hochanger 1, 85350 Freising-Weihenstephan, Germany 2National University of Mongolia, Ikh surguulin gudalmj – 1, Baga toiruu, Sukhbataar district, Ulaanbaatar, Republic of
Mongolia
3Laboratory of Quantitative Vegetation Ecology, Institute of Botany, The Chinese Academy of Sciences, 20 Nanxincu,
Xiangshan, Beijing, 100093, People’s Republic of China
Received: 18 January 2008 – Published in Biogeosciences Discuss.: 21 February 2008 Revised: 9 May 2008 – Accepted: 21 May 2008 – Published: 11 June 2008
Abstract. The relationship between carbon isotope discrim-ination (131) of C3 vegetation and long-term (30 years) and short-term (growing period) precipitation was investigated. Different species of Stipa, a dominant grass genus in the (semi-)arid Asian steppes, and other C3 species were col-lected along aridity gradients in Inner Mongolia in 2005 (11 sites, 71 samples) and in the Republic of Mongolia in 2006 (40 sites, 45 samples). The data set was expanded with pub-lished and unpubpub-lished data of Stipa and other C3 species (11 studies covering 8 years, including 64 observations of
Stipa, and 103 observations of other C3 species) and C3
community bulk-samples (11 samples). Weather data were geostatistically interpolated for all sampling sites and years.
131of Stipa followed different relationships for the
individ-ual years when related to mean annindivid-ual precipitation due to large anomalies between annual and long-term average pre-cipitation patterns. However, the131 response to rainfall converged when the (long-term) mean annual precipitation was replaced by year-specific mean daily precipitation dur-ing the growdur-ing period (PG). Remarkably, the131-response
to (PG) for C3 species as a whole (including herbaceous
di-cots, semi-shrubs and grasses) and also the C3 community-level response were virtually identical to that of Stipa. The relation was also valid outside the geographical and climatic range where it was developed, giving proof of its robustness.
Correspondence to: K. Auerswald
1 Introduction
The Central Asian grassland is the largest continuous biome of the world and includes the steppes of the Republic of Mon-golia (1.3 Mio km2of a total land area of 1.6 Mio km2, Ker-ven et al., 1996) and of the Inner Mongolia autonomous re-gion (0.8 Mio km2of a total land area of 1.2 Mio km2, Xiao et al., 1995a and citations therein) of the People’s Republic of China. This region has a continental climate with most of the rain falling from June to August. By far, the largest part of this grassland is situated in arid and semiarid zones, and the amount and distribution of rainfall is a major fac-tor controlling vegetation composition, functioning and ser-vices, such as the quality and availability of herbage for graz-ing livestock (Xiao et al., 1995a and citations therein). The Central Asian grassland flora contains a large number of C4 species (approx. 20% of the flora; mostly dicots; Pyankov et al., 2000), but the vegetation is generally dominated by C3 species, mostly perennial grasses. In particular, species of the genus Stipa are a frequent and often dominant compo-nent of most grassland types in the region.
The carbon isotope composition (δ13C) of C3 vegetation generally correlates negatively with water availability. This is primarily attributed to the leaf-level response of13C dis-crimination (131) to water availability in C3 plants (Far-quhar et al., 1989), which translates to community and higher scales (e.g., Kaplan et al., 2002; Randerson et al., 2002; Schnyder et al., 2006). The carbon isotope composition of plants (δ13Cp)is related to131as
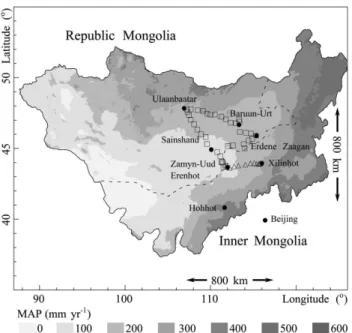
Fig. 1. Mean annual precipitation (MAP, mm yr−1); normal period 1961–1990; data from Climate Source Inc.), major towns and sam-pling sites (triangles denote the 2005 and squares the 2006 samsam-pling campaign).
where δ13Ca is the δ13C of atmospheric CO2 (Farquhar
et al., 1989). Rearranging Eq. (1) leads to 131=(δ13Ca– δ13Cp)/(1+δ13Cp)and shows that131can be calculated
di-rectly from δ13Cpif δ13Cais also known.
Precipitation is highly variable in time and space in the Mongolian grassland. Mean annual precipitation (MAP) varies from several hundred millimeters per year (mm yr−1; mainly in the northern and eastern part of the region) to less than one hundred millimeters per year in the Gobi desert (Fig. 1). But, at a given site, hydrological conditions may differ drastically between years. For example, MAP at Eren-hot is 158 mm yr−1, but exceeds 275 mm yr−1or falls below 45 mm yr−1 in every second year (NOAA NCDC Climate Data Online, 2007). These factors may exert strong influ-ences on the carbon isotope composition of grassland via (i) effects on the relative abundance of C3 and C4 species (which differ by about 10 to 18‰ in carbon isotope discrim-ination; O’Leary, 1981; Farquhar et al., 1989), and (ii) varia-tion of131in C3 plants.
The carbon isotope signal produced by grassland vege-tation is imprinted in ecosystem carbon pools (such as soil carbon) and exchange fluxes (such as biosphere atmosphere CO2exchange), and is therefore potentially highly useful for
biogeochemical studies and ecosystem reconstruction. How-ever, in C3:C4 mixed grassland, the separate effects of C3:C4 abundance and variation of 131 in C3 plants on commu-nity/ecosystem131must be known, to allow interpretation of ecosystem or community carbon isotope signals. The present work concentrates on one aspect of this problem, namely the
effect of aridity on131in C3 plants, and then discusses its implications for C3:C4 mixing models.
The effect of aridity on 131 in C3 plants has generally been studied in aridity-transect studies where the 131 of species was related to mean annual precipitation at the sam-pling sites. The responses observed in theses studies were highly variable (e.g., Stewart et al., 1995; Schulze et al., 1991, 1996; Wang et al., 2003; Liu et al., 2005; Zheng and Shangguan, 2007). Here, we test the hypothesis, that the variability of the 131-response of C3 plants to MAP in (semi-)arid grasslands is related to interannual variation of weather conditions. To test this prediction, we analysed the relationship between131 of C3 species and short-term (growing period) and long-term (climatic, 30 years) precipi-tation along aridity gradients in Inner Mongolia in 2005 and in the Republic of Mongolia in 2006. The data set was com-plemented with published and unpublished (partially own) data, thus expanding the temporal and geographic represen-tation.
2 Material and methods 2.1 Sampling area
Stipa species were sampled in the Republic of Mongolia in
2006 (total transect length of approx. 1650 km) and in In-ner Mongolia, People’s Republic of China in 2005 (total transect length of approx. 400 km) passing three vegetation zones, forest steppe, typical steppe and desert steppe (Wal-lis de Vries et al., 1996), with MAP ranging from around 280 mm yr−1 near Ulaanbaatar to 125 mm yr−1 and less in
the Gobi area near Sainshand and Erenhot and rising again to 280 mm yr−1near Xilinhot (Fig. 1).
The mean temperature ranges from about −23◦C in winter in Ulaanbaatar to about 23◦in summer in Zamyn-Uud. The local precipitation is highly variable in space and time (Gong et al., 2004). Even closely vicinal climate stations show re-markable differences: although the distance between Zamyn-Uud (Republic of Mongolia) and Erenhot (Inner Mongolia) is only 10 km, the mean monthly precipitation in August is 0.52 mm day−1 for Zamyn-Uud and 1.29 mm day−1 for Erenhot (mean for last normal period 1961–1990). Similarly, the MAP is 114 mm yr−1for Zamyn-Uud and 158 mm yr−1 for Erenhot, while mean monthly temperatures are similar for both locations (calculated from NOAA NCDC Climate Data Online, 2007).
2.2 Sampling method and the sampled species
Sampling stops were made about every 30 km. Leaves of
Stipa (if present), and other C3 species were cut with scissors
from several plants within an area of about 50×50 m (some-times there were only one or two specimen of a species at a sampling site). The samples for each site were transferred to separate paper bags and dried behind the front window of
the car. The current position was measured with a mobile outdoor global positioning system (Casio Satellite Navi 2 or Garmin GPS 12). In total 39 Stipa samples were taken in the Republic of Mongolia in 2006 and ten Stipa samples were taken in Inner Mongolia in 2005 (see Table A1 in supplemen-tary material for original data – http://www.biogeosciences. net/5/913/2008/bg-5-913-2008-supplement.pdf). In a few cases specimens of Stipa could not be classified at the species level. The following species were collected: Stipa krylovii,
Stipa grandis and Stipa glareosa in Republic of Mongolia,
and Stipa gobica and Stipa grandis in Inner Mongolia. In addition, 61 samples of another 19 C3 species were collected in 2005; and six samples of six C3 species in 2006.
For validation, the data set was expanded with two sam-ples of Stipa and 20 samsam-ples from 20 C3 species sampled in 2003 in Inner Mongolia, three bulk C3 samples collected in Mongolia in 2006 and eight C3 bulk samples collected in In-ner Mongolia in 2007. Sampling procedures were the same as during the 2005 and 2006 sampling campaigns.
2.3 Inclusion of published data and normalization for alti-tude effect
Published data (Table 1) were included in the validation data base with the primary aim of increasing the temporal (and secondarily the geographic) representation. These data cov-ered a wide range of site conditions, with altitudes extending above 2000 m a.s.l. (especially Ivanov et al., 2007). As alti-tude affects the δ13C of C3 plants (K¨orner et al., 1988), all data were normalized to an altitude of 1000 m a.s.l., which is close to the average altitude of our sampling locations (mean: 1160 m a.s.l; SD: 180 m). The altitude effect was corrected for by 1.15‰ per 1000 m following M¨annel et al. (2007) with a mean absolute correction to131of 0.26‰. For publi-cations containing no altitude data, this information was ob-tained with Google Earth® using the coordinates of the sam-ple sites.
2.4 Isotope analysis
Samples were further dried in the laboratory (1 h at 95◦C and 48 h at 60◦C), ground with a ball mill and then combusted in an elemental analyser (NA 1110; Carlo Erba, Milan) in-terfaced (ConFlo III; Finnigan MAT, Bremen) to an isotope ratio mass spectrometer (Delta Plus; Finnigan MAT). Car-bon isotope data are presented as δ13C relative to the inter-national VPDB standard: δ13C=(Rsample/Rstandard)−1; where Rsample and Rstandard are the ratios of13C/12C in the sample
and standard. All samples were measured against laboratory working standard gases, which were previously calibrated against IAEA secondary standards (IAEA CH6 for13C, ac-curacy of calibration ±0.06‰ SD). Wheat flour (C/N 21:6) as solid internal laboratory standard (SILS) was calibrated against these references. One SILS was measured after
ev-ery tenth sample. The precision for sample repeats was better than 0.2‰ for δ13C.
C3 community-mean131was calculated as the biomass-or ground cover-weighted average of all C3 species in the community. The arithmetic (unweighted) mean131was cal-culated if information on ground cover or biomass fraction was missing. In this way C3 community-mean 131 was obtained from 35 data sets by Chen et al. (2005), Wang et al. (2005), Liu et al. (2005), Gong et al. (2008) and for 10 data sets obtained by us in 2005. This was complemented by 11 C3 samples collected as bulk samples in our 2006 and 2007 sampling trips.
2.5 Carbon isotope composition of atmospheric CO2 δ13Ca of sampling years was estimated with a third order
polynomial that was fitted to measured δ13Cadata of Keeling
(1979), Friedli et al. (1986), Conway et al. (1994), Francey et al. (1999), Gat et al. (2001), Allison et al. (2003) and the NOAA data base (NOAA NCDC Climate Data Online, 2007) for the stations Mauna Loa, Siple, Antarctica, Ulan Uul, Shetland Islands, Hegyhatsal and Ochsenkopf (n=62), as in Geist et al. (2005):
δ13Ca=m1×yr3+m2×yr2+m3×yr + m4, (2)
where yr is the sampling year and m1, m2, m3and m4are
constants (11.70712×10⁻⁶; −69.78999×10⁻³; 138.640104 and −91.785 valid from 1959 to 2006). The standard error of this regression was 0.09‰. δ13Ca decreased from −8.12‰
in 1996 to −8.48‰ in 2007. The mean δ13Ca during the
growing period was then estimated from the mean δ13Caof
the year (Eq. 2) by applying a correction for the seasonal de-parture from the annual mean δ13Ca. This correction was
obtained from air samples collected at Ulan Uul (Tans et al., 2005), which is a long-term measuring station located near the center of the sampling area (44◦27′N, 111◦05′E).
Av-erage δ13Cawas less negative by 0.25‰ between April and
August as compared to the annual average. Thus a δ13Ca
of −8.17‰ and −8.19‰ resulted for the growing periods in 2005 and 2006 respectively. The mean δ13Caduring the
growing period of other years was estimated accordingly. 2.6 Statistical methods
Linear and linearised regressions were used to evaluate the datasets. The coefficient of determination was tested with a two-sided test for significance of the regression. In addition the confidence interval for the samples and the 95%-confidence interval for the regression were calculated to al-low for comparison between data sets. A pairwise compar-ison of means was used to test whether the species differed regarding MAP and 1. These statistical procedures followed standard protocols (Sachs and Hedderich, 2006).
Geostatistical analyses (for theory see Nielsen and Wen-droth, 2003; Webster and Oliver, 2004) were conducted
Table 1. Sampling year, region, mean annual precipitation (MAP) and species name of literature references and own data used for validation.
Top: Stipa data, bottom: other C3 species.
Sampling Region MAP Altitude Number Species Reference year (mm yr−1) (m a.s.l.) of data
1996 Mongolia 250 750 1 Stipa krylovii Cerling and Harris (1999) 1999 Northwest China 290 1730 3 Stipa breviflora Wang et al. (2005) 2001 Inner Mongolia 325 1267 1 Stipa grandis Chen et al. (2005) 2001 Mongolia 118 2170 2 Stipa glaeosa Ivanov et al. (2007) 2002 Northwest China 240–670 498–2095 37 Stipa bungeana Liu et al. (2005) 2003 Inner Mongolia 340 1180 2 Stipa krylovii, Stipa unidentified This study 2003–2004 Inner Mongolia 250 1200 3 Stipa grandis, S. krylovii, Liu et al. (2004)
S. baicalensis
2004 Inner Mongolia 321 1184 11 Stipa grandis Gao (2004)1 2004–2005 Inner Mongolia 323 1267 4 Stipa grandis Gong et al. (2008) 1997 Mongolia 250 1750 4 Carex rhynchophysa, Cerling and Harris (1999)
Agrostis trinii, Leymus chinensis, Ptilogostis mongolica
1999 Northwest China 194 1730–1850 15 Allium polyrhizum, Wang et al. (2005)
Reaumuria soongorica, Sympegma regelii,
Ajania fruticolosa and others
2001 Mongolia 118 2170 5 Allium polyrhizum, Ivanov et al. (2007)
Ephedra sinica
2002 Northwest China 240–670 498–2095 31 Lespedeza davurica, Liu et al. (2005)
Heteropappus less
2003 Inner Mongolia 323 1180 20 20 different C3 species This study 2003 Northwest China 50–350 395–1956 21 Reaumuria soongorica Ma et al. (2005) 2004 Inner Mongolia 323 1267 4 Carex korshinskyi, Gong et al. (2008)
Leymus chinensis
2005 Inner Mongolia 323 1267 3 Carex korshinskyi, Gong et al. (2008)
Leymus chinensis
2005 Inner Mongolia 146–364 951–1204 61 Leymus sp., This study
Caragana sp.,
Agropyron sp. and others
2006 Mongolia 125–257 1253–1479 6 Caragana microphylla, This study
Hedysarum pumilum, Astralagus sp., Salsola laricifolia
1Gao, Y.: Yinzhi Gao, Institut f¨ur Pflanzenern¨ahrung, Christian-Albrechts Universit¨at zu Kiel, unpublished data, 2004.
with package geoR (Ribeiro and Diggle, 2001) of the soft-ware GNU R 2.6 (R Development Core Team, 2007). The semivariance of a parameter (e.g. precipitation) is defined as the half mean quadratic difference of the parameter val-ues of points which are separated by a certain distance (called lag). For calculation of the latter, the coordinates of sampling points were transformed from geographic co-ordinates to UTM coco-ordinates using the package PBSmap-ping (Schnute et al., 2007, UTM zone=50). Semivariances were then grouped by lag classes and semivariances and lags within a group were averaged yielding the empirical semi-variogram (x-axis: lag, y-axis: semivariance). A theoretical
semivariogram was fitted to minimize weighted least squares, with weights calculated from the ratio of pairs within a class to mean lag. This gives more weight to the classes, which are based on many data pairs and which are more important for interpolation. Maps were constructed by spatial interpola-tion, which was carried out for a rectangular grid by ordinary point kriging, based on the theoretical semivariogram. The quality of the predictions from the resulting maps is given as the krige standard deviation averaged for the sampling loca-tions.
2.7 Meteorological data
The growing period in the sampling area starts in April with only one growth cycle (no regrowth after cutting or heavy grazing). Sampled plant material thus included biomass grown in the period of April to mid of July (2005) or April to end of July/beginning of August (2006). This period is termed “growing period” in the following and indexed with “G”. Most of the rain usually falls during this period. For 40 meteorological stations in and around the sampling area, long-term mean precipitation from April to Septem-ber correlated closely with MAP (r2=0.98) and contributed 74‰ to MAP. Normally only little growth occurs in Septem-ber, which receives only 10‰ of MAP in an average year. Hence, above-ground living biomass in ungrazed areas gen-erally peaks between late July and late August (Xiao et al., 1995b). The effective water availability for plants in different years and studies was estimated as the mean daily precipita-tion during the respective growing period (PG; mm day−1).
This accounted for the fact that sampling did not occur on exactly the same dates in the different studies, but provided a common denominator for comparison of data gathered in different years.
Sampling sites, either own or from literature, were usually not located near meteorological stations. Two data sets were used to estimate meteorological data for the sampling sites. (i) The long-term averages of the last normal period (1961– 1990) of precipitation data (monthly and annual means) were taken from high resolution maps obtained from The Climate Source Inc., Corvallis, Oregon. These maps have a pixel res-olution of 0.02◦×0.02◦(approximately 1.5×1.5 km2, Fig. 1), judged sufficient to locate the sampling sites. These data were created using the PRISM method (parameter-elevation regressions on independent slopes model; Daly et al., 2002), which accounts for topography, rain shadows, lake effects, temperature inversions, and more. (ii) For year-specific data we assumed that the principal causes underlying the PRISM maps were also valid at the small scale but were modified by large-scale trends. Daily precipitation data at 40 climate sta-tions, provided by the NOAA Satellite and Information Ser-vice (NOAA NCDC Climate Data Online, 2007) was com-piled. These stations were situated inside or just outside the sampling area. The latter were included to improve the geo-statistical interpolation at the periphery of the sampling area. To calculate PG, the difference between the normal-period
mean daily precipitation during the growing period (MPG) and PG was calculated for each meteorological station to
quantify the anomaly, PG. These anomalies were
geosta-tistically interpolated for the whole sampling area and each year to represent the large-scale spatial pattern of the anoma-lies. This trend was then superimposed on high-resolution normal-period maps to obtain high-resolution maps for indi-vidual years; e.g. for the year 2005 PGwas given by:
PG05 = MGP + dPG05. (3)
Fig. 2. Isohyet maps for the annual precipitation in 2005 (top left)
and 2006 (top right) and of the anomalies in mean daily precipi-tation during the growing period (dPG) in 2005 (bottom left) and
2006 (bottom right). For details see text. Circles denote sampling sites; dashed lines are the border between the Republic of Mongo-lia and Inner MongoMongo-lia Autonomous Region of China. Mean krige standard deviation is 46 mm yr−1(top left), 52 mm yr−1(top right), 0.32 mm day−1(bottom left) and 0.41 mm day−1(bottom right) for the locations of vegetation sampling.
While annual precipitation was similar in 2005 and 2006,
PG05/06 differed considerably (Fig. 2). In some locations
anomalies in PG between the two years and between MGP
and PGwere as large as 0.6 mm day−1, which was more than
one third of the mean precipitation. The best geostatisti-cal interpolation was obtained by ordinary kriging interpo-lation with Gaussian models (Fig. 2). In both years there was a trend in the anomaly, which decreased from northwest to southeast. In 2005 the trend differed somewhat in direction, strength, curvature and the position of the zero isohyet com-pared to 2006. In 2006 the zero isohyet was near the center of the sampling area, the south-eastern part of the sampling area being drier than average and the north-western part wet-ter. In 2005 the zero isohyet was near the northern border of the sampling area, and most of the area received less pre-cipitation during the vegetation period than in a normal year (Fig. 2).
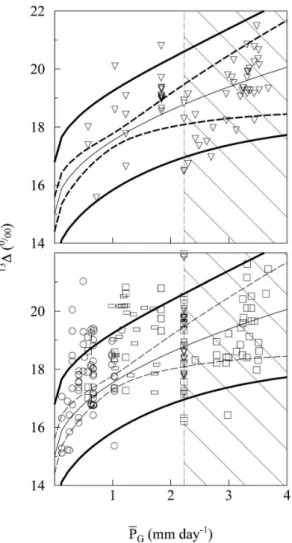
Fig. 3. Carbon isotope discrimination (131) of different Stipa species depending on mean annual precipitation (MAP) for sam-ples collected in 2005 (r2=0.385, P <0.1) and in 2006 (r2=0.296,
P <0.001).
3 Results
3.1 Carbon isotope discrimination of Stipa as related to mean annual precipitation
The gradient of MAP covered by the sampling transects was similar in the two years, and ranged between approx. 130 and 290 mm yr−1(Fig. 3). 131among Stipa increased with MAP in both years, although the increase was only signifi-cant in 2006 (P<0.01). The slope of this relationship (131
versus MAP) was very similar in both years (P >0.05), but there was a significant offset between the years, so that131
at a particular MAP was 1.1‰ higher in 2006 than in 2005. In both years, there was no relationship between131and the C/N ratio of samples suggesting that variation in photosyn-thetic capacity related to changed nitrogen concentration did not cause the variation in131.
In both years, the effect of MAP on131coincided at least partially with species replacement along the aridity gradient:
S. gobica and S. glareosa were only present in the most arid
part of the transects (MAP<200 mm yr−1) and had lower than average131(Table 2). Conversely, S. grandis and S.
krylovii had higher than average 131 and mainly occurred where MAP was >210 mm yr−1. This was true except for one site with MAP=146 mm yr−1where S. krylovii was also found in 2006. It is not known if S. krylovii has a wider
eco-Fig. 4.131and mean daily precipitation during the growing period (dPG) for Stipa species sampled in 2005 (triangels) and in 2006
(squares). Closed symbols: S. grandis. r2=0.352, P ≪0.001.
logical range with respect to MAP, or if a local hydrological peculiarity, such as local groundwater or lateral water flow, accounted for its presence. The significant separation be-tween species regarding MAP and131suggests that species distribution in the area was (at least partially) determined by MAP, whereas species131was strongly influenced by year-to-year variability in precipitation.
3.2 Carbon isotope discrimination of Stipa as related to ac-tual precipitation
Mean daily precipitation during the growing period ranged from 0.1 to 0.7 mm day−1 in 2005 and from 0.5 to
1.8 mm day−1 in 2006. 131 of Stipa collected in 2005 and 2006 followed the same relationship with PG, with
131(‰)=15.0+2.53 sqrt(P
G) (Fig. 4). Thus, the difference
between years (apparent when 131 was regressed against MAP) disappeared when131was regressed against growing period precipitation. This suggested that interannual varia-tions in131were related to interannual variations in precip-itation. The square root expression indicates that the effect was strong when PG was very low and decreased with
in-creasing precipitation.
Species did not differ in the relationship between131and
PG (highlighted for S. grandis in Fig. 4). Thus, it seemed
that species-replacement was controlled by long-term pre-cipitation patterns, whereas the within-species response to short-term precipitation patterns controlled131.
3.3 Comparison with published Stipa data
There were eight data sets (six published and two unpublished; see Table 1) for which the relationship
Table 2. Mean annual precipitation (MAP) at sampling sites and carbon isotope discrimination (131) of different species of Stipa in the 2005 and 2006 transect studies. Mean, minimum and maximum, standard deviation (SD), and significance of species separation at P <0.05.
Species MAP (mm yr−1) 13δ(%)
Mean Min. Max. SD Significance Mean Min. Max. SD Significance 2006 S. glareosa 160 130 197 27 A 17.5 16.9 18.7 0.81 B S. krylovii 232 146 269 40 B 18.1 16.9 19.3 0.66 B S. grandis 246 209 284 25 B 18.2 17.1 19.7 0.71 B 2005 S. gobica 164 146 177 16 A 16.0 15.5 16.8 0.68 A S. grandis 259 214 278 25 B 17.0 15.9 17.5 0.72 A
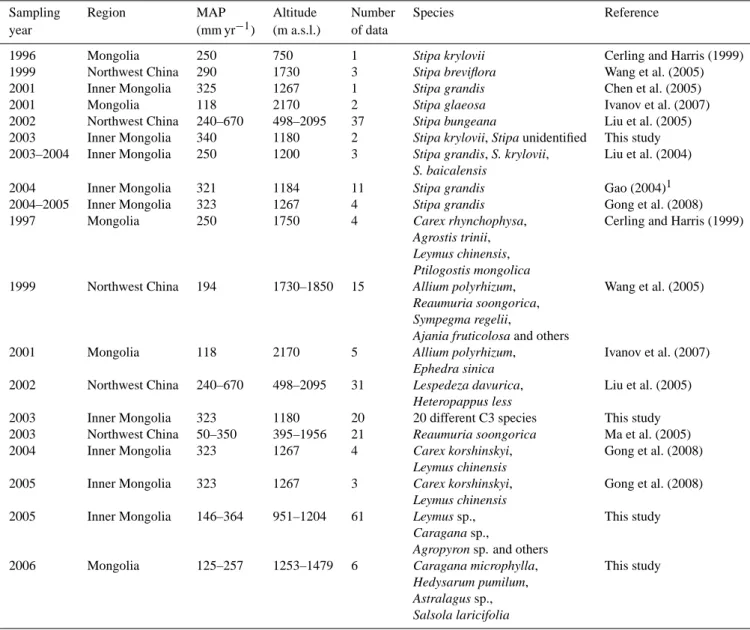
between 131 and actual precipitation could be calcu-lated and compared with the results from our tran-sects (see Table A2 in supplementary material for pre-cipitation data – http://www.biogeosciences.net/5/913/2008/ bg-5-913-2008-supplement.pdf). These studies reported a total of 62 data for different species of Stipa. The data cor-responded well with the relation derived from the 2005 and 2006 samples (Fig. 5, top). Notably, this was also true for studies in which Stipa experienced higher precipitation than the maximum encountered in our transect studies (Fig. 5, hatched areas denoting (PG)>2.2 mm day−1). Inclusion of
data of Liu et al. (2005) reporting131of S. bungeana along a rainfall gradient in Northwest China further expanded the range of precipitation, and also agreed with the relationship derived from the 2005 and 2006 collections of Stipa. Overall, these comparisons supported the notion that the relationship presented in Fig. 4 provides a general and unbiased predic-tion of the131of Stipa in the grasslands of Mongolia.
The relation with PGeven explained data obtained in 2001
(Table 1), which was an extremely dry year in Inner Mongo-lia. In that year more than half of the numerous lakes of the province of Qinghai (in the west of Inner Mongolia) disap-peared (Reuters, 2001), and in the Republic of Mongolia the herders lost one quarter of their large-animal livestock such as horses and cattle (Retzer, 2007).
3.4 Comparison with other C3 species
“Non-Stipa” C3 species included 170 data from a total of 55 species, collected in eight different years (1996, 1999, 2001, 2002, 2003, 2004, 2005 and 2006). Again, the comparison indicated a fair agreement between the precipitation response of 131in Stipa and that of the other species, although the scatter was somewhat larger in the latter. Still, 80% (135 out of 170) of all non-Stipa data fell inside the 95‰ confi-dence interval of Stipa (Fig. 5, bottom). Subdivison of the whole data set in functional groups (monocots n=163 and dicots n=118; grasses n=143, forbs n=50 and shrubs and semi-shrubs n=68) also provided no evidence for a
differ-ent precipitation response at the level of functional groups. However, dicots deviated from monocots insofar as their131
was about 0.5‰ higher on average at a given precipitation level. In particular, leaves of Reaumuria soongorica, a short-statured woody shrub, had 1.8‰ higher131than Stipa and other species at the same precipitation level. Yet, even in R.
soongorica, the slope of the131versus PGrelationship did
not deviate from that of Stipa or that of the whole of other species.
3.5 The131-response of C3 communities to growing pe-riod precipitation
The C3 community-mean 131 responded to mean daily growing period precipitation in the same way as131of Stipa (Fig. 6; see Table A3 in supplementary material for main species and biomass data – http://www.biogeosciences.net/ 5/913/2008/bg-5-913-2008-supplement.pdf) but with less scatter due to an averaging effect, which compressed the 95‰ confidence interval for the data points. The regression for the community data, calculated to obtain a robust relation over the entire range of precipitation, was virtually the same relation as that for Stipa, but the confidence interval of the regression remained narrow over the entire range due to the continuous support by data.
3.6 The relationship between precipitation anomalies and
131anomalies
The deviation of growing period precipitation from the long-term mean (precipitation anomaly) was directly related to the deviation between actual 131and 131 predicted for mean conditions at the respective sites (131anomaly). This effect was manifested at the level of C3 communities (Fig. 7), and species (data not shown). The precipitation anomalies modi-fied the community-mean131by ±1‰. The response at the community level and the large spatial extension of precipita-tion anomalies imply that this response was also effective at larger scales.
Fig. 5. Validation of the131versus mean daily precipitation
rela-tionship of Stipa sp. shown in Fig. 4. Top panel: Stipa data from nine studies (n=64) given in Table 1. Bottom panel: Data from other (“non-Stipa”) C3 species as taken from literature (squares;
n=83; see Table 1) or collected in our own 2005 and 2006 transect studies (circles; n=87, see Table 1). Data from Reaumuria
soongor-ica (from Ma et al., 2005; samples obtained in 2003) are shown as
rectangles (n=21). In both panels, the lines denote the Stipa regres-sion from Fig. 4, which was obtained from the 2005 and 2006 sam-ples (central line), the 95% confidence intervals for the regression (dashed inner lines) and the 95% confidence intervals for the indi-vidual Stipa samples collected in 2005 and 2006 (thick outer lines). The hatched areas denote the precipitation range that exceeded the range covered by the 2005 and 2006 sampling transects.
4 Discussion
4.1 Interannual variation of131results from growing pe-riod precipitation anomalies
This work reveals strong effects of interannual variation in precipitation on131of C3 plants in the grasslands of Mon-golia. This effect was particularly evident in the genus Stipa
Fig. 6. 131and PGfor C3 communities from this study (closed
triangles) in 2005 (n=10), in 2006 (n=3) and in 2007 (n=8) and from literature data (squares; n=35). All data were adjusted to a common altitude of 1000 m a.s.l. The middle line denotes the square-root regression (r2=0.753, P ≪0.001), dashed lines the 95%-confidence interval for the regression and outer bold lines the 95%-confidence interval for the data points.
for which a large data set was available from collections along precipitation gradients in two different years, and pub-lished data from several years. Moreover, the effect was also apparent at the level of communities and functional groups (grasses other than Stipa, perennial forbs, and shrubs and semi-shrubs). An important consequence of the interannual variability of precipitation was that it caused interannual fluc-tuations in the relationship between (annually determined)
131 and MAP. This means, that a stable and unbiased
re-lationship between131and MAP can only be obtained by relating long-term averaged131to MAP.
Interannual variation of131(or δ13C) has been observed before, particularly in trees (Sparks and Ehleringer, 1997; Warren et al., 2001; Li et al., 2007), but also in Grassland taxa (Mole et al., 1994; Tsialtas et al., 2001), and was also explained by rainfall anomalies (Mole et al., 1994; Li et al., 2007) or other weather related factors (e.g. seasonal variation in water vapour deficit as reported by Sparks and Ehleringer (1997), variation in soil water content as reported by Tsial-tas et al. (2001) and Schnyder et al. (2006)). However, ef-fects of weather anomalies on131have generally not been considered in aridity transect studies. It is evident from the present work, that (at least) part of the variation in131 ob-served in those studies (e.g. compare studies of Gong et al., 2008, or Wang et al., 2005) can be explained by such de-viations of growing year weather conditions from long-term mean conditions. This may also include interannual variabil-ity of soil moisture and atmospheric vapour pressure, which
exert direct effects on 131 (Sparks and Ehleringer, 1997; Tsialtas et al., 2001). However, since these factors are usu-ally (but not always, see Schulze et al., 1996) correlated with precipitation, their effect is (at least partially) included in the relationship of131with year-specific growing period precip-itation.
4.2 Species, functional groups and communities share the same precipitation response of131
The131-response (that is the slope of the relationship be-tween131and PG) of S. grandis was the same as that of
the other species of Stipa in the data base. It was also very similar to the “mean” species response, and the response of C3 communities. Even in R. soongorica, which had a com-paratively high131 in all rainfall conditions, the slope of the relationship between131and year-specific growing pe-riod precipitation was the same as that of the “mean” species. Although the relationship between131and growing period precipitation has not been studied in any detail, the unifor-mity in the131responses of species’ or functional groups to rainfall, as seen here, was not expected: inter-specific differences in the 131-response to environmental parame-ters have been observed before (e.g. Handley et al., 1994), and the adaptive significance of different strategies of water use have been discussed and emphasized (e.g. Golluscio and Oesterheld, 2007). Yet, it is acknowledged that, although the number of species in the data base was relatively large (55 C3 species, including 7 Stipa species), it was nevertheless a small fraction of the total flora of the grasslands of Mongolia. Moreover, the data base was dominated by perennial grasses (over 50% of all data). But in this respect the data base re-flects the species composition of most Grassland communi-ties of Mongolia. For instance, Stipa accounted for more than 40% and perennial grasses (including Stipa) for more than 70% of total aboveground biomass in the communities sampled in 2005. Perennial grasses from arid and semi-arid temperate grasslands share great similarities in phenology, leaf structure, and root architecture and placement, which may explain the similarity in their water use (Golluscio and Oesterheld, 2007). Thus, the similarity in the precipitation response of131by C3 communities was related to the pre-dominance of perennial grasses (particularly Stipa) in these communities and the similarity in water use strategies among grasses. These similarities might also explain, why species-replacement along the aridity gradient did not affect the pre-cipitation response of131(Fig. 4).
Nevertheless, there was significant scatter in the overall relationship between131and growing period precipitation. Although there was no difference between functional groups, the scatter may partly be due to differences between species within groups. Differences between species have been inter-preted in terms of differences in intrinsic water use efficiency (e.g. Condon et al., 1990; Ehleringer et al., 1992; Meinzer et al., 1992) and may be related to differences in
phenol-Fig. 7. Relation of the anomalies in C3 community mean131and growing period precipitation (r2=0.556, P ≪0.001; same commu-nities as in Fig. 6). Both anomalies are expressed as the difference between the annual and the long-term value. The long-term average discrimination,131MP, was calculated from the equation shown
in Fig. 6. Year-specific precipitation for the sites of other studies was obtained by geostatistical interpolation analogously to our own data.
ogy (e.g. Smedley et al., 1991), rooting pattern/depth (Gol-luscio and Oesterheld, 2007) and leaf anatomy (including leaf thickness and nitrogen content) (Farquhar et al., 1989; Schulze et al., 2006). Mechanisms also include special adap-tations to arid conditions such as leaf shedding in response to drought as expressed in R. soongorica (Ma et al., 2005) and phreatophyte lifestyle. This also explains, why the precipi-tation response at the community level was associated with much less scatter than that at the species level (cf. Figs. 4 and 6): communities include species with a range of functional attributes which are related to differences in131.
Finally, there exists large short-term, small-scale variabil-ity in precipitation in the region, which is not represented en-tirely when interpolating precipitation at collection sites from weather station data. For instance, the Erenhot and Zamyn-Uud weather stations are separated by approximately 10 km but differ by an average of 15 mm in the monthly precipita-tion during the growing period. Therefore, errors in precipi-tation estimates are probably substantial and explain some of the scatter in the131versus precipitation relationship.
4.3 A stable and unbiased relationship between 131 and precipitation for use in C3:C4 mixing models
The findings of this work are useful for estimation of the relative abundance of C3 and C4 vegetation in community biomass from community 131 (131community), which re-quires knowledge of the131of the C3 (1313)and C4 (1314)
members in a two-component mixing model (e.g. Still et al., 2003). Evidently, errors in the assessment of1313 and 131
4cause errors in the estimation of C3:C4 abundance. In
general, neglect of variation of1313or1314overestimates
the true variation of the fraction of C3 (and C4) vegetation in communities, because all variation of131community is
at-tributed to variation in the relative abundances of C3 and C4 plants. If variation of1313(or1314)is systematic, then
ne-glect of this variation provokes a biased variation of the rel-ative abundances of C3 and C4 plants. For instance, neglect of the effect of aridity on131of C3 plants would underesti-mate the relative abundance of C3 plants in the dry section of the transect. As shown above the potential variation of1313
is large in semi-arid and arid Grassland, creating opportuni-ties for large errors in estimation of the relative abundance of C3 and C4 plants from131community.In the present study aridity caused a variation of1313 of up to ∼5‰ (Fig. 6).
This is about one third to one half of the difference in131
between C3 and C4 plants in arid and semiarid Grassland (Schulze et al., 1996; Wang et al., 2005). Accordingly, the shift from the wet to the dry end of the aridity gradient has the same effect on131community, as a 33–50% replacement
by C4 plants. A possible systematic variation of1313must
also be considered when interpreting long-term records such as soil organic matter or sediments in terms of the C3:C4 abundance. Variation of1314 would have a similar effect, although, variation in1314is generally smaller (e.g. Liu et al., 2005; Wang et al., 2005) than that of C3 plants and com-munities as observed here, and1314responds much less to drought (Schulze et al., 1996; Ghannoum et al., 2002). Yet, systematic differences in131 between C4 metabolic types exist (e.g. Schulze et al., 1996; Ghannoum et al., 2002) and the relative abundance of metabolic types may change with aridity (Schulze et al., 1996).
5 Conclusions
This work demonstrates that rainfall anomalies cause large variations of the 131 versus MAP relationship, which are greatly reduced when131is related to actual rainfall during the growing period. Significantly, the131-response to grow-ing period rainfall was stable across years, and it was very similar for dominant taxa (Stipa members), functional groups (including herbaceous dicots, semi-shrubs and grasses), and C3 communities. Moreover, the relation was also valid out-side the geographical and climatic range where it was devel-oped, giving proof of its robustness. Because of its generality
and stability, the relationship between131and growing pe-riod rainfall allows an unbiased estimation of131of the C3 member for use in C3:C4 mixing models based on commu-nity C isotope composition.
Acknowledgements. This research was funded by the DFG within
the Research Group 563 MAGIM. We thank Monika Breitsameter and Anja Schmidt for assistance with sample preparation for iso-tope analysis, and Weiguo Liu (Institute of Earth and Environment, The Chinese Academy of Sciences) and Yinzhi Gao (Institut f¨ur Pflanzenern¨ahrung, Christian-Albrechts Universit¨at zu Kiel) for providing data. Chun Hua Bai is thanked for assistance during sampling trips.
Edited by: D. Hammarlund
References
Allison, C. E., Francey, R. J., and Krummel, P. B.: δ13C in CO2from sites in the CSIRO Atmospheric Research GASLAB
air sampling network, Trends: A Compendium of Data on Global Change, Carbon Dioxide Information Analysis Center, Oak Ridge National Laboratory, US Department of Energy, Oak Ridge, TN, USA, 2003.
Cerling, T. E. and Harris, J. M.: Carbon isotope fractionation be-tween diet and bioapatite in ungulate mammals and implica-tion for ecological and paleoecological studies, Oecologica, 120, 347–363, 1999.
Chen, S. P., Bai, Y. F., and Han, X. G.: Variation of Water-Use Efficiency of Leymus chinensis and Cleistogenes squarrosa in different plant communities in Xilin River Basin, Nei Mongol, Acta Bot. Sin., 44, 1484–1490, 2002.
Chen, S. P., Bai, Y. F., Guanghui, L., and Han, X. G.: Variations in life-form composition and foliar carbon isotope discrimina-tion among eight plant communities under different soil moisture conditions in the Xilin River Basin, Inner Mongolia, China, Ecol. Res., 20, 167–176, 2005.
Condon, A. G., Farquhar, G. D., and Richards, R. A.: Genotypic variation in carbon isotope discrimination and transpiration ef-ficiency in wheat – leaf gas-exchange and whole plant studies, Aust. J. Plant Physiol., 17, 9–22, 1990.
Conway, T. J., Tans, P. P., and Waterman, L. S.: Atmospheric CO2 records from sites in the NOAA/CMDL air sampling network, Trends ’93: A Compendium of Data on Global Change, Carbon Dioxide Information Analysis Center, Oak Ridge National Lab-oratory, US Department of Energy, Oak Ridge, TN, USA, 1994. Daly, C., Gibson, W. P., Taylor, G. H., Johnson, G. L., and Pasteris, P.: A knowledge-based approach to the statistical mapping of climate, Climate Res., 22, 99–113, 2002.
Ehleringer, J. R., Phillips, S. L., and Comstock, J. P.: Seasonal vari-ation in the carbon isotopic composition of desert plants, Funct. Ecol., 6, 396–404, 1992.
Farquhar, G. D., Ehleringer, J. R., and Hubick, K. T.: Carbon iso-tope discrimination and photosynthesis, Annu. Rev. Plant Phys., 40, 503–537, 1989.
Francey, R. J., Allison, C. E., Etheridge, D. M., Trudinger, C. M., Enting, I. G., Leuenberger, M., Langenfelds, R. L., Michel, E., and Steele, L. P.: A 1000-year high precision record of δ13C in atmospheric CO2, Tellus B, 51, 170–193, 1999.
Friedli, H., L¨otscher, H., Oeschger, H., Siegenthaler, U., and Stauf-fer, B.: Ice core record of the C-13/C-12 ratio of the atmospheric CO2in the past 2 centuries, Nature, 324, 237–238, 1986. Garten, C. T. and Taylor, G. E.: Foliar δ13C within a temperate
de-ciduous forest: spatial, temporal and species sources of variation, Oecologia, 90, 1–7, 1992.
Gat, J. R., Mook, W. G., and Meijer, H. A. J.: Environmental iso-topes in the hydrological cycle, principles and applications, Vol. II, Atmospheric water, http://www.iaea.org/programmes/ripc/ih/ volumes/volume2.htm, 2001.
Geist, J., Auerswald, K., and Boom, A.: Stable carbon isotopes in freshwater mussel shells: Environmental record or marker for metabolic activity?, Geochim. Cosmochim. Ac., 69, 3545–3554, 2005.
Ghannoum, O., von Caemmerer, S., and Conroy, J. P.: The effect of drought on plant water use efficiency of nine NAD-ME and nine NADP-ME Australian C4 grasses, Funct. Plant Biol., 29, 1337–1348, 2002.
Golluscio, R. A. and Oesterheld, M.: Water use efficiency of twenty-five co-existing Patagonian species growing under differ-ent soil water availability, Oecologia, 54, 207–217, 2007. Gong, D. Y., Shi, P. J., and Wang, J. A.: Daily precipitation changes
in the semi-arid region over northern China, J. Arid Environ., 59, 771–778, 2004.
Gong, X., Brueck, H., Giese, M., Limeng, Z., Sattelmacher, B., and Shan, L.: Slope direction has effects on productivity and species composition of hilly Grassland in the Xilin River Basin, Inner Mongolia, J. Arid Environ., 72, 483–493, 2008.
Google Earth: Google Inc. CA 94043, USA, Version 4.2.0205.5730, 2007.
Handley, L. L., Odee, D., and Scrimgeour, C. M.: δ15N and δ13C patterns in savannah vegetation: dependence on water availabil-ity and disturbance, Funct. Ecol., 8, 306–314, 1994.
Ivanov, L. A., Ivanova, L. A., Ronzhina, D. A., Ziegler, H., Deigele, K., Gunin, P. D., and Pyankov, V. I.: Effects of interspecific com-petition on functional properties of plants in mountain-steppe communities of the Gobi, Russ. Plant Physiol., 38, 155–160, 2007.
Kaplan, J. O., Prentice, I. C., and Buchmann, N.: The stable car-bon isotope composition of the terrestrial biosphere: modelling at scales from the leaf to the globe, Global Biogeochem. Cy., 16, 1060, doi:10.1029/2001GB001403, 2002.
Keeling, C. D., Mook, W. G., and Tans, P. P.: Recent trends in the C-13-C-12 ratio of atmospheric carbon-dioxide, Nature, 277, 121–123, 1979.
Kerven, C., Channon, J., and Behnke, R.: Planning and policies on extensive livestock development in Central Asia, Overseas velopment Institute, Working Paper 91, London, Overseas De-velopment Institute, 1996.
K¨orner, C., Farquhar, G. D., and Roksandic, Z.: A global survey of carbon isotope discrimination in plants from high-altitude, Oe-cologia, 74, 623–632, 1988.
Li, Y. B., Chen, T., Zhang, Y. F., and An, L. Z.: The relation of seasonal pattern in stable carbon composition to meteorological variables in the leaves of Sabina przewalskii Kom. and Sabina
chinensis (Lin.) Ant., Environ. Geol., 51, 1279–1284, 2007
Liu, X. Q., Wang, R. Z., and Li, Y. Z.: Photosynthetic pathway types in rangeland plant species from Inner Mongolia, North China, Photosynthetica, 42, 339–344, 2004.
Liu, W. G., Feng, X. H., Ning, Y. F., Zhang, Q. L., Cao, Y. N., and An, Z. S.: δ13C variation of C3and C4 plants across
an Asian monsoon rainfall gradient in arid northwestern China, Glob. Change Biol., 11, 1094–1100, 2005.
Ma, J. Y., Chen, T., Qiang, W. Y., and Wang, G.: Correlations be-tween foliar stable isotope composition and environmental fac-tors in desert plant Reaumuria soongorica (Pall.), Maxim. J. In-tegr. Plant Biol., 47, 1065–1073, 2005.
M¨annel, T. T., Auerswald, K., and Schnyder, H.: Altitude gradi-ents of Grassland carbon and nitrogen isotope composition are recorded in hair of grazers, Global Ecol. Biogeogr., 16, 583–592, 2007.
Meinzer, F. C., Rundel, P. W., Goldstein, G., and Sharifi, M. R.: Carbon isotope composition in relation to leaf gas-exchange and environmental-conditions in Hawaiian metrosideros-polymorpha populations, Oecologia 91, 305–311, 1992.
Mole, S., Joern, A., O’Leary, M. H., and Madhaven, S.: Spatial and temporal variation in carbon-isotope discrimination in prairie graminoids, Oecologia, 97, 316–321, 1994.
Nielsen, D. R. and Wendroth, O.: Spatial and temporal statis-tics – Sampling field soils and their vegetation, Catena Verlag, Reiskirchen, 398 pp., 2003.
NOAA NCDC Climate Data Online: http://cdo.ncdc.noaa.gov/ CDO/cdo,2007.
O’Leary, M. H.: Carbon isotope fractionation in plants, Phytochem-istry, 20, 553–567, 1981.
Pyankov, V. I., Gunin, P. D., Tsoog, S., and Black, C. C.: C-4 plants in the vegetation of Mongolia: their natural occurrence and geo-graphical distribution in relation to climate, Oecologia, 123, 15– 31, 2000.
R Development Core Team: R: A language and environment for sta-tistical computing, R Foundation for Stasta-tistical Computing, Vi-enna, Austria, ISBN 3-900051-07-0, http://www.R-project.org, 2007.
Randerson, J. T., Collatz, G. J., Fessenden, J. E., Munoz, A. D., Still, C. J., Berry, J. A., Fung, I. Y., Suits, N., and Denning, A. S.: A possible global covariance between terrestrial gross pri-mary production and C-13 discrimination: Consequences for the atmospheric C-13 budget and its response to ENSO, Global Bio-geochem. Cy., 16(4), 1136, doi:10.1029/2001GB001845, 2002. Retzer, V.: Forage competition between livestock and Mongolian
pika, Basic Appl. Ecol., 8, 147–157, 2007.
Reuters: Water sources for China Yellow River dry up Xinhua, Reuters News Service, Beijing, China, http//www.planetark.org/ dailynewsstory.cfm/newsid/12711/story.htm, 10 Oct 2001. Ribeiro, P. J. and Diggle, P. J.: geoR: a package for geostatistical
analysis, R-NEWS, 1, 15–18, 2001.
Sachs, L. and Hedderich, J.: Angewandte Statistik, Springer, Berlin, 2006
Schnute, J., Boers, N., Haigh, R., et al.: PBSmapping: PBS Map-ping 2.54, R package version 2.54, 2007.
Schnyder, H., Schwertl, M., Auerswald, K., and Sch¨aufele, R.: Hair of grazing cattle provides an integrated measure of the effects of the site conditions and interannual weather variability on δ13C of temperate humid Grassland, Glob. Change Biol., 12, 1–15, 2006. Schulze, E. D., Ellis, R., Schulze, W., and Trimborn, P.: Diversity, metabolic types and delta C-13 carbon isotope ratios in the grass flora of Namibia in relation to growth form, precipitation and habitat conditions, Oecologia, 106, 352–369, 1996.
Schulze, E. D., Turner, N. C., Nicolle, D., and Schumacher, J.: Species differences in carbon isotope ratios, specific leaf area and nitrogen concentrations in leaves of Eucalyptus growing in a common garden compared with along an aridity gradient, Phys-iol. Plantarum, 127, 434–444, 2006.
Smedley, M. P., Dawson, T. E., Comstock, J. P., Donovan, L. A., Sherrill, D. E., Cook, C. S., and Ehleringer, J. R.: Seasonal car-bon isotope discrimination in a Grassland community, Oecologia 85, 314–320, 1991.
Sparks, J. P. and Ehleringer, J. R.: Leaf carbon isotope discrimi-nation and nitrogen content for riparian trees along elevational transects, Oecologia, 109, 362–367, 1997.
Still, C. J., Berry, J. A., Ribas-Carbo, M., and Helliker, B. R.: The contribution of C3and C4plants to the carbon cycle of a tallgrass
prairie: an isotopic approach, Oecologia, 136, 347–359, 2003. Tans, P. P. and Conway, T. J.: Monthly atmospheric CO2mixing
ratios from the NOAA CMDL Carbon Cycle Cooperative Global Air Sampling Network, 1968–2002. A Compendium of Data on Global Change, Carbon Dioxide Information Analysis Center, Oak Ridge National Laboratory, US Department of Energy, Oak Ridge, TN, USA, 2005.
The Climate Source LLC: Corvallis, OR, USA, PRISM spatial cli-mate datasets for Mongolia and Inner Mongolia, 2002.
Tsialtas, J. T., Handley, L. L., Kassioumi, M. T., Veresoglou, D. S., and Gagianas, A. A.: Interspecific variation in potential water-use efficiency and its relation to plant species abundance in a water-limited Grassland, Funct. Ecol., 15, 605–614, 2001. Wallis de Vries, M. F., Manibazar, N., and D¨ugerlham, S.: The
veg-etation of the forest-steppe region of Hustain Nuruu, Mongolia. Plant Ecol., 122, 11–127, 1996.
Wang, G., Han, J. M., and Liu, D.: The carbon isotope composition of C3 herbaceous plants in loess area of Northern China, Sci. Chin. Ser. D, 46, 1069–1076, 2003.
Wang, G. A., Han, J. M., Zhou, L. P., Xiong, X. G., and Wu, Z.: Carbon isotope ratios of plants and occurrences of C4species
under different soil moisture regimes in arid region of Northwest China, Physiol. Plantarum, 125, 74–81, 2005.
Warren, C. R., McGrath, J. F., and Adams, M. A.: Water availability and carbon isotope discrimination in conifers, Oecologia, 127, 476–486, 2001.
Webster, R. and Oliver, M.: Geostatistics for environmental sci-entists, Statistics in Practice, Wiley & Sons, Chichester, ISBN 0-471-96553-7, 2004.
Xiao, X., Ojima, D. S., Parton, W. J., Chen, Z., and Chen, D.: Sen-sitivity of Inner Mongolian Grasslands to climate change, J. Bio-geogr., 22, 643–648, 1995a.
Xiao, X., Wang, Y. F., Jiang, S., Ojima, D. S., and Bonham, C. D.: Interannual variation in the Climate and aboveground biomass of Leymus chinense Steppe and Stipa grandis steppe in the Xilin River Basin, Inner-Mongolia, China, J. Arid Environ., 31, 283– 299, 1995b.
Zheng, S. X. and Shangguan, Z. P.: Foliar δ13C values of nine dom-inant species in the Loess Plateau of China, Photosynthetica, 45, 110–119, 2007.