En vue de l'obtention du
DOCTORAT DE L'UNIVERSITÉ DE TOULOUSE
Délivré par :Institut National Polytechnique de Toulouse (INP Toulouse)
Discipline ou spécialité :
Pathologie, Toxicologie, Génétique et Nutrition
Présentée et soutenue par :
M. YAYU HUANG le mardi 27 février 2018
Titre :
Unité de recherche : Ecole doctorale :
Effect of live yeast on the fermentation and microbiological
physico-chemical parameters of the rumen, depending on the nature of the diet:
modeling and validation in ruminant
Sciences Ecologiques, Vétérinaires, Agronomiques et Bioingénieries (SEVAB) Génétique, Physiologie et Systèmes d'Elevage (GenPhySE)
Directeur(s) de Thèse :
MME CORINNE BAYOURTHE M. QINGXIANG MENG
Rapporteurs :
M. JAN DIJKSTRA, WAGENINGEN UNIVERSITY M. PIERRE NOZIERE, INRA CLERMONT FERRAND
Membre(s) du jury :
M. FRANCIS ENJALBERT, ECOLE NATIONALE VETERINAIRE DE TOULOUSE, Président Mme CHRISTINE JULIEN, PHILEO LESAFFRE ANIMAL CARE, Membre
Mme CORINNE BAYOURTHE, INP TOULOUSE, Membre M. OLIVIER HUSSON, CIRAD MONTPELLIER, Membre
1
Acknowledgments
Cette thèse a été réalisée dans le cadre d’un contrat de Recherche Industrie CIFRE, financée par l’Association National de la Recherche Technique (ANRT) et Phileo Lesaffre Animal Care. Le manuscrit vient clôturer 3 ans d’expérience scientifique et humaine, je remercie toutes les personnes qui ont contribué à l’aboutissement de ce projet.
Je présente tout d’abord mes remerciements aux membres du jury: M. Jan DIJKSTRA (Wageningen University), M. Francis ENJALBERT (ENVT), M. Olivier HUSSON (CIRAD), Mme Christine JULIEN (Phileo Lesaffre Animal Care), M. Pierre NOZIERE (INRA de Theix) pour avoir accepté de participer à ce jury. Je remercie tout particulièrement Christine pour tout le temps qu’elle m’a accordé en répondant à mes questions.
Je tiens à remercier mes directeurs de thèse, Corine Bayourthe et Qingxiang Meng pour leurs encadrements et leur appui scientifique. Merci à Corine de m’avoir accordé la confiance et permis d’effectuer cette thèse dans les meilleures conditions. Merci à Professeur Meng pour m’avoir accueilli et m’avoir aidé depuis plusieurs années.
Je suis très reconnaissant à Phileo Lesaffre Animal Care qui a assuré le financement de cette thèse, en particulier sa directrice Frederique Clusel et son directeur R&D Eric Auclair. Je remercie mon responsable Jean Philippe Marden qui s’est attaché à m’offrir les meilleures conditions matérielles pour réaliser mes études et notamment mon essai à « The Farm ». Je remercie Brigitte Geste et Anaïs Fernandez pour leur aide tout au long de l’expérimentation à « The Farm ». Merci à Johanna Haroux et à Cendrine Luzuy pour leurs aides lors de mes déplacements à Lille. Je remercie également les collègues Phileo en Chine : Xiaosong Liu, Bo Zhang, Wei Ji et Lei Zhou pour leurs aides lors de mes déplacements à Shanghai.
Je remercie ensuite les membres de mon comité de thèse qui m’ont formulé de précieux conseils : Daniel Sauvant et Djamel Ali-Haimoud.
Je souhaite remercier tous les collègues de l’UMR GenPhySE pour leur investissement dans ce travail. Merci à Xavier Fernandez, Martine Bouissou-Matet Yerle et Christèle Rober-Granie pour leur accueil au sein de l’UMR GenPhySE. Merci à Sylvie Combes, Laurent Cauquil, Géraldine Pascal, Béatrice Gabinaud, Muriel Segura, Olivier Zemb, Caroline Achard, Annabelle Meynadier-Troegeler, Asma Zened, Laurence Lamothe, Thierry Gidenne, Michèle Theau-Clement, Corinne Pautot, Carole Bannelier, Michel Bouillier-Oudot, Herve Rémignon,
2
Hélène Manse, Nathalie Marty-Gasset, Stéphane Seidlinger, Cécile Bonnefont, Yves Farizon, Marie-Luce Chemit pour m’avoir accompagné tout au long de cette thèse. Je remercie également les gestionnaires de l’unité : Viviane, Manuela, Florence, Nancy, Valérie G, Valérie L, Evelyne et surtout Chrystelle pour avoir assuré tous mes ordres de missions. Merci à Philippe Schmidely de AgroParisTech pour m’avoir appris à faire des méta-analyses avec SAS. Merci aussi à Cécile Canlet de l’UMR 1331 ToxAlim pour nous avoir aidés pour les analyses métabolomiques.
Je remercie également Defa Li pour son accueil au sein de la China Agricultural University. Merci également à Hailing Luo, Yanling Li, Zhengming Zhou, Hao Wu, Rui Li, Fei Wang, Yuanlong Yang, Qianglin Liu, Deyong Li, Liweng He, Ping Liu, Xin Wu,Xinzhuang Zhang, Liping Zhao, Yunlong Huo, Yuming Jiang, Guoyin Wang, Wanbao Chen, Yan Li, Lei Shi pour m’avoir aidé à Pékin. Merci également à Shujie Liu, Shatuo Chai, et Lizhuang Hao pour leur aide à différentes occasions.
J’ai une pensée toute particulière pour Professeur Liping Ren qui m’a aidé depuis de nombreuses années et qui nous a quitté pendant mon séjour à la China Agricultural University. Je tiens à remercier les stagiaires qui ont travaillé sur ce projet de thèse : Océane Cartoscelli et Gerges Hanna, grâce à vous ce travail a pu avancer.
Je remercie tous mes jeunes compagnons du couloir : Héloïse, Christelle, Clémentine, Céline, Davi, Ivan, Malo, Charlotte, Marie, Manon, Marie-Léa, Chloé, Juliette, Tehya, Tao. Avec vous j’ai partagé de très bons moments. J’ai beaucoup apprécié la petite balade du midi avec vous accompagnée de pleine de discussions intéressantes qui m’ont amenées à des réflexions originales sur la vie professionnelle et privée.
Avant de rejoindre Toulouse, j'ai parcouru un long chemin. Je tiens spécialement à remercier toutes les personnes qui m’ont donné ma chance en me laissant l’opportunité de faire une thèse :
Sophie Prache pour m’avoir initié à faire de la recherche, et surtout m’a appris la fraternité ; Jean-François Hocquette pour m’avoir aidé à plusieurs reprises pour mettre mes compétences en valeurs ; Dominique Pomiès, Isabelle Veissier, Jacques Agabriel, Bruno Martin qui m’ont beaucoup appris sur les ruminants ; Catherine Jondreville, Elisabeth Baéza et Angelique Travel pour m’avoir accueilli à Nancy. Je remercie également Benoit Malpaux, ancien chef de département PHASE; Dominique Gigan et
3
Jean-Luis Porry du Ministère Français de l’Agriculture ; Jean-Baptiste Coulon, président du centre INRA de Auvergne-Rhône-Alpes; Erwin Dreyer, président du centre INRA de Nancy-Lorraine ; Anne Mrowicki, sous-directrice de l'Accueil International de l’Université de Lorraine ; Sandrine et Marie-Lise, gestionnaires RH du centre INRA de Nancy-Lorraine ; Maryse Teyssèdre et Annie Royet, gestionnaires de l’UMRH ; Gong Aiqi du Ministère de l’Agriculture de Chine.
Je tiens à remercier Luc Delaby pour m’avoir transmis la passion de travailler avec les ruminants.
Merci à William Martin-Rosset pour m’avoir appris les moindres détails de l’ingestion et la digestion des aliments chez différentes espèces d’herbivores.
Merci à Djamel Ali-Haimoud et Marie Odile Bisch, grâce à vous, j’ai pu avoir des expériences d'enseignement à l’école d’ingénieurs de Purpan pendant la thèse.
Merci à Maryline Kouba pour m’avoir reçu en 2008, où commence ma vie en France.
Merci à Marie-Jeanne et Robert Rahn pour m’avoir accueilli au Caradeuc et à Pont-Aven et surtout m’avoir aidé à trouver mon premier stage en ferme laitière.
Merci à l’experte anonyme qui a validé mon dossier CIFRE pour que je puisse apprendre la nouvelle le jour de mon anniversaire.
Un grand merci à Céline Chevance, grâce à toi j’ai pu rester en France. Merci à Patrick et Olivier de la chèvrerie de Corps-Nuds qui m’ont appris que les chèvres savent pâturer. En fin, merci à ma famille qui m’a soutenu de loin. Merci grand-mère.
4
List of publications and communications
Publications
Article 1: Huang Y., Marden J.P., Julien C., Bayourthe C. Redox potential: an intrinsic parameter of the rumen environment. Journal of Animal Physiology and Animal Nutrition (In press).
Article 2: Huang Y., Marden J.P., Benchaar C., Julien C., Auclair E., Bayourthe C. 2017. Quantitative analysis of the relationship between ruminal redox potential and pH in dairy cattle: influence of dietary characteristics. Agricultural Sciences, 8, 616-630.
Article 3: Huang Y., Marden J.P., Julien C., Auclair E., Benchaar C., Bayourthe C. Relationship between ruminal redox potential and fermentation parameters from in vivo experiments in dairy cattle: influence of dietary characteristics. In prep. Journal of Dairy Science.
Article 4: Huang Y., Marden J.P., Julien C., Auclair E., Bayourthe C. Response of redox potential and fermentation parameters to live yeast supplementation in dairy cow: quantitative analysis. In prep. Livestock Science.
Article 5: Huang Y., Marden J.P., Julien C., Auclair E., Bayourthe C. Effect of live yeast supplementation in early-lactating cows fed diets differing in content of soluble sugars. In prep. Animal.
Article 6: Huang Y., Castoscelli O., Canlet C. Cauquil L. Marden J.P., Julien C., Auclair E., Bayourthe C. Effects of live yeast supplementation and dietary soluble sugars content on rumen microbial composition and metabolomic profile in early-lactating cows. In prep. Environmental Microbiology.
5
Communications
Huang Y., Julien C., Marden J.P., Bayourthe C. 2016. Relationship between ruminal redox potential and pH in dairy cattle. 20th Congress of the European Society of Veterinary and Comparative Nutrition. 123. (Poster).
Huang Y., Julien C., Marden J.P., Bayourthe C. 2016. Analyse quantitative de l’effet des levures vivantes sur le potentiel redox ruminal chez la vache laitière. Rencontres autour des Recherches sur les Ruminants 23, 41. (Poster).
Huang Y., Marden J.P., Julien C., Auclair E., Bayourthe C. 2017. Improvement of ruminal fermentation by live yeast in dairy cattle : a quantitative analysis. Journée scientifique de l’école doctorale SEVAB, 27 mars, Toulouse, France. (Oral communication).
Huang Y., Marden J.P., Julien C., Auclair E., Bayourthe C. 2017. Improvement of ruminal fermentation by live yeast in dairy cows. ADSA Annual Meeting, June 25-28, Pittsburgh, Pennsylvania, USA. (Oral communication).
Huang Y., Marden J.P., Julien C., Auclair E., Hanna G. Bayourthe C. 2017. Changes in ruminal redox potential and pH of lactating cows during a dietary transition. ADSA Annual Meeting, June 25-28, Pittsburgh, Pennsylvania, USA. (Oral communication).
6
Contents
Acknowledgments ... 1
List of publications and communications ... 4
Contents ... 6
List of Tables ... 9
List of Figures ... 11
Abbreviations ... 13
GENERAL INTRODUCTION ... 15
PART I. REDOX POTENTIAL: AN IMPORTANT PARAMETER OF THE RUMINAL BIOTOPE ... 21
Chapter 1. Redox potential: an intrinsic parameter of the rumen environment (Article 1) ... 23
Summary ... 25
Introduction ... 26
Literature review ... 27
Analyses of relationships between Eh, dietary factors and fermentation parameters ... 31
Results and Discussion ... 33
Impact of the diet on ruminal redox status ... 33
Ruminal redox conditions and bacterial activity ... 36
Conclusions ... 41
References ... 41
Chapter 2. Study of the relationship between ruminal redox potential, pH, and fermentation parameters and diet composition: a meta-analysis approach ... 47
A. Presentation of the database ... 48
Introduction ... 49
Selection of studies and data collection ... 49
B. Quantitative analysis of the relationship between ruminal redox potential and pH in dairy cattle: influence of dietary characteristics (Article 2) ... 55
Abstract ... 57
1. Introduction ... 58
2. Materials and methods ... 59
2.1. Selection of studies ... 59
2.2. Measurement of ruminal Eh and pH ... 60
2.3. Statistical Analysis ... 61
2.3.1. Influence of dietary characteristics on Eh and pH ... 61
2.3.2. Relationship between ruminal Eh and pH ... 62
3. Results ... 62
7
3.2 Relationship between ruminal Eh and pH ... 65
3.3 Variables influencing the relationship between ruminal Eh and pH ... 66
4. Discussion ... 67
4.1 Dietary characteristics influencing ruminal Eh ... 67
4.2 Dietary characteristics influencing ruminal pH ... 68
4.3 Relationship between ruminal Eh and pH ... 69
5. Conclusions ... 70
References ... 70
C. Relationship between ruminal redox potential and fermentation parameters from in vivo experiments in dairy cattle: influence of dietary characteristics (Article 3) ... 77
Abstract ... 79
Introduction ... 80
Materials and methods ... 81
Results and discussion ... 83
References ... 89
PART II. RESPONSE OF REDOX POTENTIAL AND FERMENTATION PARAMETERS TO LIVE YEAST SUPPLEMENTATION IN DAIRY COW: A QUANTITATIVE ANALYSIS (ARTICLE 4) ... 95
Abstract ... 98
1. Introduction ... 98
2. Materials and methods ... 100
2.1. Selection of studies ... 100
2.2. Measurement of ruminal Eh and pH ... 101
2.3. Statistical Analysis ... 102
3. Results ... 102
3.1 Qualitative analysis: LY vs. control ... 102
3.2. Response of rumen parameters to LY supplementation ... 104
3.3. Relationship between response of ruminal Eh and that of control group ... 105
3.4. Influence of dietary characteristic on ruminal Eh response ... 105
3.5. Relationship between response of rumen fermentation parameters and that of Eh ... 106
4. Discussion ... 106
4.1. Qualitative analysis: LY vs. Control ... 106
4.2. Relationship between response of ruminal Eh and that of control group ... 108
4.3. Influence of dietary characteristics on ruminal Eh response ... 109
4.4. Relationship between response of rumen fermentation parameters and that of Eh ... 109
5. Conclusions ... 110
References ... 110
PART III. SOLUBLE SUGAR CONTENT OF THE DIET AND LIVE YEAST SUPPLEMENTATION IN DAIRY CATTLE ... 117
Chapiter 1 Effect of live yeast supplementation in early-lactating cows fed diets differing in content of soluble sugars (Article 5) ... 119
Introduction ... 122
Materials and methods ... 123
Cows, experimental design, and treatments ... 123
Measurement and sample collection ... 124
Sample analysis ... 125
Statistical analysis ... 126
8
DM and water intake ... 126
Ruminal Eh, pH and temperature ... 126
Ruminal fermentation end products ... 129
Milk production and milk composition ... 130
Discussion ... 131
Conclusion ... 135
References ... 135
Chapter 2. Effects of live yeast supplementation and dietary soluble sugars content on rumen microbial composition and metabolomic profile in early-lactating cows (Article 6) ... 141
Summary ... 143
Introduction ... 144
Experimental procedures ... 145
Animals and experimental design ... 145
Rumen sampling ... 146
PCR amplification of bacterial 16S ribosomal genes for Illumina MiSeq pyrosequencing ... 147
Sample preparation for Proton Nuclear Magnetic Resonance (1H-NMR) ... 148
Statistical analysis ... 148
Results ... 149
Rumen microbiota ... 149
Rumen metabolome ... 153
Discussion ... 156
Effects on rumen microbiota ... 156
Effects on rumen metabolome ... 158
Conclusion ... 160
References ... 160
GENERAL DISCUSSION ... 167
1. Ruminal Eh and rumen function ... 169
1.1. Ruminal Eh could be a potential indicator of digestive disorder ... 169
1.2. Ruminal Eh was related to classical parameters and could reflect the transfer and use of electrons in the rumen ... 172
1.3. Ruminal Eh was influenced by dietary characteristics ... 175
2. Effect of LY on ruminal Eh in dairy cattle ... 175
2.1 Mode of actions of LY explained by Eh measurement ... 175
2.2 Prediction of LY effect on ruminal Eh ... 178
3. Contributions for application purposes from this work ... 179
3.1 Prediction tool of ruminal Eh ... 179
3.2 Alternative indicators of acidosis ... 180
4. Limits and perspectives for future studies ... 180
4.1. Meta-analysis of existing data from experiments ... 180
4.2. Measurement of ruminal Eh ... 181
4.3. Experimental design ... 182
CONCLUSION ... 183
BIBLIOGRAPHY ... 187
9
List of Tables
Table 1. Range of values of the ruminal redox potential measured in various ruminants ... 28
Table 2. Description of ruminal redox potential (mV) data (n = 35) depending on the measurement method used ... 30
Table 3. Descriptive statistics for data set (n = 24) used to analyze relation between ruminal Eh and diet composition ... 32
Table 4. Descriptive statistics for data set (n = 24) to analyze relation between ruminal Eh and pH, rH, and VFA ... 33
Table 5. Hierarchical ascendant classification in two groups according Eh value (n = 24). ... 35
Table 6. Summarize of 22 experiments in the database... 50
Table 7. Descriptive variables of the diets composition (n = 57) for data set used in the meta-analysis. ... 51
Table 8. Summary of the redox potential and pH value in the database... 63
Table 9. Relationship between ruminal redox potential and dietary characteristics. ... 64
Table 10. Relationship between ruminal pH and dietary characteristics. ... 65
Table 11. Description of each trial involved in the meta-analyse. ... 81
Table 12. Summary of dietary characteristics of data set. ... 82
Table 13. Statistical descriptions of variables measured in the data set. ... 84
Table 14. Typical reactions producing VFAs in the rumen ... 88
Table 15. Description of diet characteristics in the data set. ... 101
Table 16. Effect of live yeast supplementation on rumen parameters in dry cows. ... 103
Table 17. Effect of live yeast supplementation on rumen parameters in lactating cows. ... 104
Table 18. Summary of response of rumen parameters to live yeast supplementation in dry and lactating cows. ... 105
Table 19. Relationship between response of ruminal Eh and that of control group. ... 105
Table 20. Relationship between responses of rumen fermentation parameters and mean Eh response. ... 106
10
Table 22. Effect of live yeast supplementation and soluble sugars level on DMI and water intake .. 126 Table 23. Effect of live yeast supplementation and soluble sugars level on ruminal redox potential, pH
and temperature. ... 128
Table 24. Effect of live yeast supplementation and soluble sugars level on urine pH. ... 128 Table 25. Effect of live yeast supplementation and soluble sugars level on ruminal fermentation
characteristics. ... 129
Table 26. Effect of live yeast supplementation and soluble sugars level on milk production and milk
composition ... 130
Table 27. Ingredient and chemical composition of experimental diets. ... 146 Table 28. Effect of live yeast supplementation and dietary soluble sugars content on relative
abundance (%) of bacterial phyla present in the liquid fraction. ... 151
Table 29. Effect of live yeast supplementation and dietary soluble sugars content on relative
abundance (%) of bacterial phyla present in the solid fraction. ... 151
Table 30. Effect of live yeast supplementation and dietary soluble sugars content on relative
abundance (%) of bacterial genera present in the liquid fraction. ... 152
Table 31. Effect of live yeast supplementation and dietary soluble sugars content on relative
abundance of bacterial genera present in the solid fraction. ... 153
Table 32. Discriminant rumen metabolites from cows fed a high or a low soluble sugars diet. ... 155 Table 33. Discriminant rumen metabolites from cows fed a high or a low soluble sugars diet,
11
List of Figures
Figure 1. Electron microscopy image of yeast Saccharomyces cerevisiae. ... 18 Figure 2. Simplified mode of action of live yeasts proposed by Marden (2007). ... 19 Figure 3. Loading plot describing the relationships between Eh and diets composition derived from a
principal component analysis. ... 34
Figure 4. Changes in ruminal redox potential (Eh) in heifers fed high starch-diet or fed high fibre diet.
... 36
Figure 5. Redox potential and energetic pathways: tower showing electron cascade. ... 37 Figure 6. Loading plot describing the relationships between redox potential (Eh) and fermentative
parameters derived from a principal component analysis. ... 38
Figure 7. Relationship between ruminal redox potential (Eh) and pH. ... 38 Figure 8. Relationship between Eh and tVFA produced (moles/d) (a), proportions (% tVFA) of acetate
(b) and propionate (c). ... 40
Figure 9. The ex vivo measurement (Method 1) of Eh and pH performed on continuously pumped
rumen fluid without air contact (Marden et al., 2005)... 52
Figure 10. Wireless data logger (Dascor, Escondido, CA, USA) used for in vivo mesurements of
ruminal Eh and pH (Method 2). ... 52
Figure 11. Relationship between ruminal redox potential (Eh) and pH. ... 66 Figure 12. Relationship between Eh and, total VFA (mM), acetate (%), propionate (%), butyrate (%),
acetate:propionate ratio, and ammonia (NH3-N, mg/L). ... 85 Figure 13. Circadian redox potential (Eh) changes of cows fed LS diet, LY-supplemented LS diet HS
diet and LY-supplemented HS diet. ... 127
Figure 14. Circadian pH changes of cows fed LS diet , supplemented LS diet, HS diet ,
LY-supplemented HS diet. ... 127
Figure 15. Effect of live yeast (LY) supplementation and soluble sugars content of the diet (D) on
richness (estimated by the Chao1 value) and diversity (estimated by the Shannon index) of ruminal bacterial communities of liquid and solid fractions... 150
Figure 16. Two-dimensional PLS-DA score plot of integrated 1H-NMR spectra to explore
dissimilarities among treatments consisting in a high soluble sugars diet (HS) or a low soluble sugars diet (LS), supplemented or not with live yeast (LY). ... 154
12
Figure 18. Example of digestive disorder recorded by kinetic of ruminal Eh and pH in dairy cow. .. 172 Figure 19. Relationship between ruminal VFA profile responses and that of Eh: (a) total VFA
responses and that of Eh, (b) acetate proportion response and that of Eh, (c) propionate proportion
response and that of Eh, (d) acetate to propionate ratio response and that of Eh. ... 174 Figure 20. Positioning of results from experimental trial (Article 5) in the database of Article 4:
relationship between (a) total VFA responses and Eh response, (b) acetate proportion response and Eh
response, (c) propionate proportion response and Eh response, (d) Acetate to propionate ration.. ... 177 Figure 21. Positioning of Eh responses following LY supplementation from experimental trial (Article
13
Abbreviations
ACE: acetate;
ADF: Acid Detergent Fiber ADL: Acid Detergent Lignin ANOVA: Analysis Of Variance ATP: Adenosime Tri-Phosphate BUT: Butyrate;
BW: Body Weight
CV: Coefficient of Variation
DACD: Dietary Anion Cation Difference DIM: Days In Milk
DM: Dry Matter; DMI: Dry Matter Intake DNA: Deoxyribonucleic Acid EB: Electrolytic Balance Eh: Redox Potential
HAC: Hierarchical Ascendant Classification HS: High Soluble Sugars
LS: Low Soluble Sugars LY: Live Yeasts
NAD: Pyridine Nucleotides NDF: Neutral Detergent Fiber
NDFF: Neutral Detergent Fibre from Forages NH3: Ammonia
NMR: Nuclear Magnetic Resonance OM: Organic Matter
OPLS-DA: Orthogonal Projection of Latent Structures–Discriminant Analysis OUT: Operational Taxonomic Unit
PCA: Principal Component Analysis PCO: Proportion of Concentrate PCR: Polymerase Chain Reaction PRO: Propionate
14
RFC: Readily Fermentable Carbohydrates rH: Clark's exponent
RPB: Rumen Protein Balance SARA: Sub-acute Ruminal Acidosis SEM: Standard Error Mean
TMR: Total Mixed Ration tVFA: total Volatile Fatty Acids
VIP: Variable Importance in Projection VFA: Volatile Fatty Acids
15
17
Agriculture, in particular ruminant livestock farming, presents today strong societal issues rhyming with environment and animal welfare that sometimes put a veil on the economic issues of production for society. The farmers, by setting goals, direct their strategic and technical choices for the management of their production playing on the shifting equilibrium between productivism, quality and economic profitability. At the scale of the herd, in the case of the search for an optimized production of ruminants, the farmers will focus on the control of the feeding of animals, sensitive lever of evolution and control of the production giving rise to a great deal of work in the field of research and development.
In fact, in ruminant, production and quality have their origin in the quantity and quality of products derived from ruminal fermentations. Feeding a ruminant feed is first of its ruminal microbiota which lives in symbiosis with the animal: microbial digestion in the rumen could be improved. The optimization of this system through improved ruminal fibrolysis, microbial synthesis, lower amylolysis and proteolysis to promote the arrival of glucose and protein in the intestine. The choice of the quantity and quality of feedstuffs can design a diet adapted to the requirements of animals as well as the production target set by the farmer. Recommendations for feeding ruminants are all responses to the optimization of the production system at the animal and herd scale.
Feeding high-producing dairy cows with high-readily fermentable carbohydrates (RFC, such as starch and sugar) diets is common practice to meet the energy requirements for milk production. However, this feeding practice can contribute to create fermentation disorder, such as ruminal acidosis characterized by more or less extended periods of pH depression (Plaizier et al., 2008). Sub-acute ruminal acidosis (SARA) is one of the major concerns of current dairy farms because it is poorly detected in herds and has many consequences, such as feed intake depression, reduced fiber digestibility, milk fat depression, diarrhea and laminitis (Plaizier et al., 2008). To improve ruminal fermentation, various additives (including probiotics) can be incorporated into their diet. Their use is particularly aimed at modifying the balance of microbial populations in the rumen in order to redirect the fermentative facies towards the formation of final products of digestion that are more beneficial for the animal's metabolism. As an alternative to growth promoting antibiotics, probiotics remain at the forefront of the animal feed industry. Among the probiotics, the positive effect of the yeast Saccharomyces cerevisiae (Figure 1) on performance of beef and dairy cattle has been widely demonstrated (Bach et al., 2007; Thrune
18
et al., 2007; Marden et al., 2008; Desnoyers et al., 2009). Their main positive effects include an increase in rumen pH and a reduction in lactic acid, especially in cases of higher proportion of concentrate in the diet and to higher intake levels (Desnoyers et al., 2009). Until now, pH has been one of the most commonly used descriptors to define acidotic conditions. However pH is a measure that merely reflects one aspect of the rumen environment.
Figure 1. Electron microscopy image of yeast Saccharomyces cerevisiae (Murtey and
Ramasamy 2016).
Recently, measurement of ruminal redox potential (Eh, in mV) has been considered as an
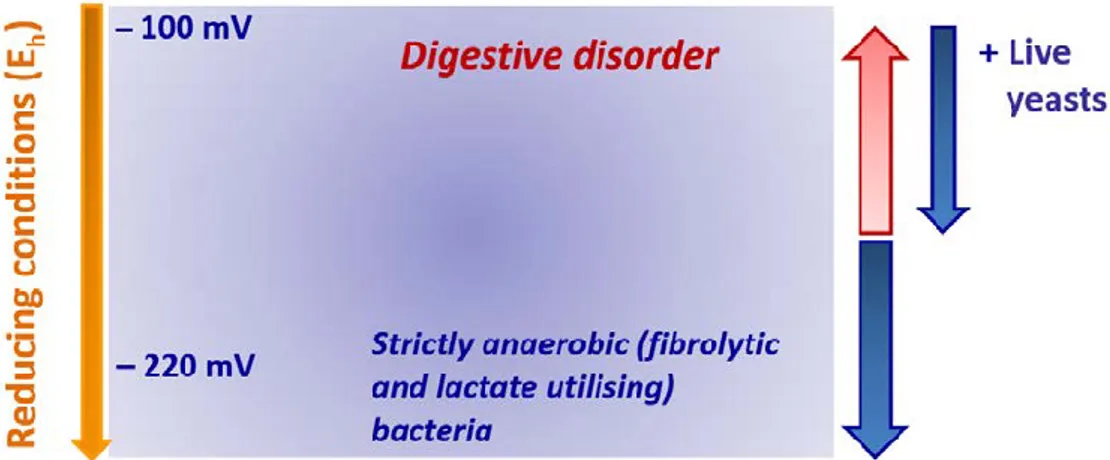
interesting tool to indicate ruminal fermentation disorder, such as SARA (Marden et al., 2005; Marden et al., 2008; Julien et al., 2010). The role of Eh has been reported in many biological
media such as dairy products (Brasca et al., 2007), wine (Tomlinson and Kilmartin, 1997) and rumen fluid (Marounek et al., 1982; Marden et al., 2005; Julien et al., 2010). In fact, Eh is a
basic physicochemical measurement characterizing the reducing status of a milieu. Each bacteria has its favorable range of Eh (Husson, 2013; Friedman et al., 2017), and the negative
Eh seems to be favorable to strict anaerobic bacteria such as fibrolytic and lactate utilizing
bacteria (Pinloche et al., 2013; Friedman et al., 2017). The positive effect of live yeasts (LY) on ruminal Eh has been reported (Mathieu et al., 1996; Marden 2007). The decrease of ruminal Eh (enforcement of reducing power) following LY might favorited fibrolytic and lactate utilizing bacteria and contributed to stabilization of rumen function. Marden (2007) then proposed to use ruminal Eh as a key tool for understanding the mode of action of this additive
19
Figure 2. Simplified mode of action of live yeasts proposed by Marden (2007).
However, effects of LY on the digestion, the metabolism and the performances remain variable according to the experimental conditions: strain and dose of LY, physiological stage of the animal, and also dietary characteristics (Julien 2010). Our knowledge on mode of actions of
LY is still limited, the challenge of this work was to improve our understanding on the mode of actions of LY, and to define the optimal condition of LY utilization in livestock production. On the one hand, from a purely cognitive point of view, there is a need to specify
the relationships between the two physicochemical parameters (pH and Eh), the fermention
parameters, and the dietary chractaristics, in order to have an integrated comprehention of rumen function. On the other hand, producers and users of LY are seeking practice to optimize its condition of utilization and to predict its effect.
Ruminal Eh is rarely discussed in dairy cows due to the difficulty of measurement (Marden et
al., 2005). The accurate ruminal Eh measurement requires strict anaerobic conditions which are
not always satisfied (Marden et al., 2005). For several years, our research team has conducted numerous experiments with simultaneous measurements of ruminal Eh of dairy cows fed
various diets under anaerobic conditions, many of these experiments also investigated the effect of LY in dairy cattle. Analysis of these measurements could provide better understanding of i) factors controlling ruminal Eh, ii) relationship between ruminal Eh and other ruminal parameters
such as pH and volatile fatty acids (VFA) profile. In addition, associate the response of ruminal Eh and other parameters following LY supplementation might provide new knowledge about
mode of actions of LY. Therefore, a great part of this work consisted to quantitative analysis of existing results from 22 experiments with cannulated dairy cattle and try to:
20
- investigate the relationship between ruminal Eh and other main ruminal parameters
including pH and VFA profile;
- quantify the influence of dietary characteristics on ruminal Eh, in order to predict the
ruminal Eh and evaluate the risk level of given diet;
- investigate the effect of LY on ruminal Eh and other parameters in order to improve our
understanding on the mode of actions of LY. The manuscript is organized in three parts:
- part I focused on ruminal Eh as an important parameter of the ruminal biotope, which
include i) a literature review of published articles on ruminal Eh (Article 1) and ii)
quantitative analysis of internal dataset on the relationship between ruminal redox potential and other ruminal parameters such as pH and VFA profile, as well as the influence of dietary characteristics (Article 2 and 3).
- By using quantitative analysis of internal dataset, Part II studied the effect of live yeast on ruminal redox potential in dairy cattle (Article 4).
- part III consisted to verify some of the findings from quantitative analysis by an in vivo experiment. Since the quantitative analysis revealed strong influence of soluble sugars on ruminal Eh, and greater response of ruminal Eh following LY supplementation was
related to higher intake of soluble sugars, the experiment aimed to validate these findings by investigating the effect of LY supplementation on ruminal Eh in early-lactating cows
fed high amount of soluble sugars (Article 5). In addition to ruminal physicochemical and fermentation parameters, rumen microbial composition and metabolomic profile were analyzed to explain the mode of actions of LY (Article 6).
21
Part I. Redox potential: an important
23
Chapter 1. Redox potential: an intrinsic parameter of the
rumen environment (Article 1)
24
REVIEW
Article 1
Redox potential: an intrinsic parameter of the rumen environment
Y. Huang1,2, J. P. Marden3,C. Julien3 and C. Bayourthe1,2*25
Summary
The ruminal ecosystem is a fermentative milieu which is interesting to discuss in terms of its redox status as a reflection of an intense bacterial activity. The objective of this systematic literature review is to quantitatively analyze data collected on redox potential (Eh) in the rumen
and to explore relationship between ruminal Eh, nature of the diet fed to ruminants, and ruminal
fermentation parameters. Data obtained from 15 studies comprising 24 different diets was used in the analysis. Studies included in the data file were selected based on the criteria of: (i) the nature of the reference electrode was specified, (ii) the ruminal Eh was recorded simultaneously
to pH, (iii) animal body weight (BW) and dry matter intake (DMI) were reported and (iv) the composition of the diet was precisely described. Results showed a high variability in ruminal Eh values. However, all recorded values are markedly negative reflecting the absence of oxygen and the strong reducing power of the rumen environment. The main factors contributing to the variation were the method of Ehmeasurement and the nature of the diet fed to ruminants. Redox
potential was positively correlated with DMI and proportion of concentrate in the diet, and tended to be positively correlated with soluble carbohydrates content. In contrast, it was negatively correlated with neutral detergent fibre from forages. The hierarchical ascendant classification discriminated two groups of diets leading to significant change in ruminal Eh
level. Ruminal Eh was negatively correlated with pH, total volatile fatty acids produced and
proportion of acetate, and positively correlated with proportion of propionate. This review revealed Eh to be dependent on the diet composition and DMI, at least within the range of diets
included in the database.
26
Introduction
The rumen is an open ecosystem in which lives a highly diversified and predominantly strictly anaerobic microflora.The physico-chemical conditions of the biotope (high moisture content, temperature of 39°C,negative redox potential)are very favorable to the development and the fermentative activity of this flora. Like in other biological media, redox potential (Eh) is an
important parameter because oxidation-reduction reactions are essential for the maintenance of all living microorganisms (Falkowski et al., 2008; Husson, 2013). Each microorganism type is adapted to specific Eh conditions and is characterized by its ability to develop within a range of
Eh (Husson, 2013): in general, aerobes require a range of Eh between +500 to +300 mV,
facultative anaerobes between +300 to -100 mV, and anaerobes between +100 to less than -250 mV (Ray, 2004). Redox potential may occur at different levels in microorganisms and so, potentially modify their growth capacity and production of metabolites. Van Dijk and Veeger (1981) and Kalachniuk et al. (1994) demonstrated that the metabolic activity of some key ruminal bacteria (Selenomonas ruminantium, Streptococcus bovis, Megasphera elsdneii) was affected by redox conditions, as previously reported by some authors in other biological media during fermentation processes (Vivas and Glories, 1995; Tomlinson and Kilmartin, 1997; Picek et al., 2000; Hirano, 2008; Escalante-Minakata et al., 2009).
Ruminal oxidation-reduction conditions are regularly disturbed by the entrance of oxygen via feeding cycle and blood. The consumption of oxygen by facultative anaerobic bacteria allows to maintain the state of anaerobiosis of the ruminal medium as indicated by the very low values of oxygen partial pressure i.e. 10-66 - 10-60 atm (Marden et al., 2005) and, inside of the
rumen, reducing conditions are essential for anaerobic bacteria such as fibrolytic populations. These bacteria are unable to use O2 as the final electron acceptor and thus derive their energy
from fermentation reactions in which the electron acceptors are various organic compounds (acetate, butyrate, formiate, propionate, oxalate, fumarate, CO2). So, ruminal reducing
conditions directly originated from microbial activity. This was demonstrated by Mathieu et al. (1996) who reported Eh value of -322 mV in faunated animals and -282 mV in defaunated
animals, and by Julien et al. (2010b) who reported positive Eh values (+ 270 mV) in sterilized
ruminal fluid and negative Eh values (from −220 to −110 mV) measured in vivo. Moreover, the
27
particularly the strict anaerobic bacteria such as cellulolytic and lactate-utilizing bacteria (Marden et al., 2008) was confirmed by Pinloche et al. (2013).
Since the Eh has an important effect on the enzymatic processes which are essential for
bacteria metabolism, it seems important to investigate the reductive characteristics of rumen environment. However, very little information is available concerning the Eh of rumen contents
and how this changes with type of diet, known to also impact the profile of microbiota. Thus, the aim of this literature review is to provide a comprehensive overview on the current knowledge regarding the ruminal Eh and to identify the relationships between the Eh, the nature
of the diet and the activity of the rumen microbiota.
Literature review
The redox conditions in the digestive tract of animals determine whether aerobic oxidation or anaerobic fermentation of nutrients should prevail and, consequently, may have a major impact on the digestion, metabolism, and assimilation of ingested nutrients. Few authors have assessed the redox conditions in different parts of the digestive tract of animals. The first researchers were Veivers et al. (1982) and Brune (1998) in herbivorous insects (termites). They observed that the dilated hindgut is a strictly anoxic habitat (Eh values from -230 to -270 mV) while Eh
in the midgut content is markedly positive with values greater than +100 mV. Similarly, in the gastrointestinal tract of goat and sheep, Marounek et al. (1987) found that the range of Eh was
rather very wide ranging from +100 mV (in the abomasum) to -220 mV (in the rumen and the colon). In piglet, Stewart (1997) showed a drastic fall of Eh towards negative values from the
beginning of the small intestine (+150 mV) to the large intestine (-250 mV), associated with a progressive increase in the number of bacteria. The concentration of oxygen decreases from the median segments of the small intestine and the proportion of anaerobic bacteria species begins to increase at the expense of aerobic species (Pidello, 2014). Thus, whether in monogastrics or ruminants, in the digestive compartment where fermentation processes occur (rumen, caecum and colon), Eh values are lower than those recorded in other parts of digestive tract. However,
Eh values in these biological fermenters differ between animals: from -210 to -290 mV in the
caecum of horse (Da Veiga et al., 2005; Philippeau et al., 2009), -210 mV in the caecum of rabbit (Kimsé et al., 2009), -185 mV in the colon of swine (Lizardo et al., 2012), -322 mV in the first compartment stomach of alpaca (Liu et al., 2009), and from -115 to -300 mV in the rumen of ruminants (Table 1).
28
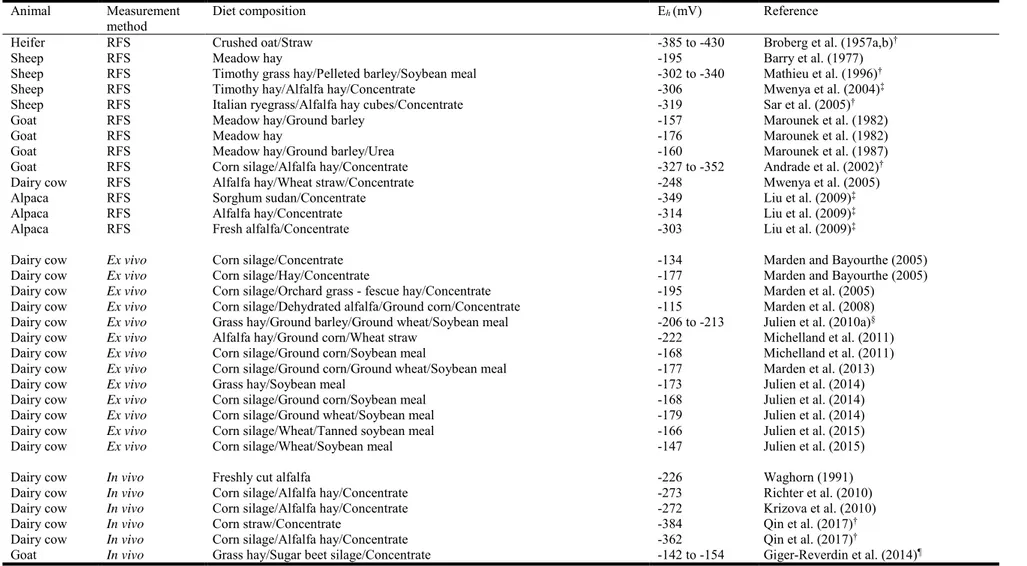
Table 1. Range of values of the ruminal redox potential measured in various ruminants Animal Measurement
method Diet composition Eh(mV) Reference
Heifer RFS Crushed oat/Straw -385 to -430 Broberg et al. (1957a,b)†
Sheep RFS Meadow hay -195 Barry et al. (1977)
Sheep RFS Timothy grass hay/Pelleted barley/Soybean meal -302 to -340 Mathieu et al. (1996)†
Sheep RFS Timothy hay/Alfalfa hay/Concentrate -306 Mwenya et al. (2004)‡
Sheep RFS Italian ryegrass/Alfalfa hay cubes/Concentrate -319 Sar et al. (2005)†
Goat
Goat RFS RFS Meadow hay/Ground barley Meadow hay -157 -176 Marounek et al. (1982) Marounek et al. (1982)
Goat RFS Meadow hay/Ground barley/Urea -160 Marounek et al. (1987)
Goat RFS Corn silage/Alfalfa hay/Concentrate -327 to -352 Andrade et al. (2002)†
Dairy cow RFS Alfalfa hay/Wheat straw/Concentrate -248 Mwenya et al. (2005)
Alpaca RFS Sorghum sudan/Concentrate -349 Liu et al. (2009)‡
Alpaca RFS Alfalfa hay/Concentrate -314 Liu et al. (2009)‡
Alpaca RFS Fresh alfalfa/Concentrate -303 Liu et al. (2009)‡
Dairy cow
Dairy cow Ex vivo Ex vivo
Corn silage/Concentrate
Corn silage/Hay/Concentrate -134 -177 Marden and Bayourthe (2005) Marden and Bayourthe (2005) Dairy cow Ex vivo Corn silage/Orchard grass - fescue hay/Concentrate -195 Marden et al. (2005)
Dairy cow Ex vivo Corn silage/Dehydrated alfalfa/Ground corn/Concentrate -115 Marden et al. (2008)
Dairy cow Ex vivo Grass hay/Ground barley/Ground wheat/Soybean meal -206 to -213 Julien et al. (2010a)§
Dairy cow Ex vivo Alfalfa hay/Ground corn/Wheat straw -222 Michelland et al. (2011)
Dairy cow Ex vivo Corn silage/Ground corn/Soybean meal -168 Michelland et al. (2011)
Dairy cow Ex vivo Corn silage/Ground corn/Ground wheat/Soybean meal -177 Marden et al. (2013)
Dairy cow Ex vivo Grass hay/Soybean meal -173 Julien et al. (2014)
Dairy cow Ex vivo Corn silage/Ground corn/Soybean meal -168 Julien et al. (2014)
Dairy cow Ex vivo Corn silage/Ground wheat/Soybean meal -179 Julien et al. (2014)
Dairy cow Ex vivo Corn silage/Wheat/Tanned soybean meal -166 Julien et al. (2015)
Dairy cow Ex vivo Corn silage/Wheat/Soybean meal -147 Julien et al. (2015)
Dairy cow In vivo Freshly cut alfalfa -226 Waghorn (1991)
Dairy cow In vivo Corn silage/Alfalfa hay/Concentrate -273 Richter et al. (2010)
Dairy cow In vivo Corn silage/Alfalfa hay/Concentrate -272 Krizova et al. (2010)
Dairy cow In vivo Corn straw/Concentrate -384 Qin et al. (2017)†
Dairy cow In vivo Corn silage/Alfalfa hay/Concentrate -362 Qin et al. (2017)†
Goat In vivo Grass hay/Sugar beet silage/Concentrate -142 to -154 Giger-Reverdin et al. (2014)¶
RFS, rumen fluid samples: measurements performed by potentiometry on collected hand rumen fluid samples; ex vivo: measurements performed with probes on continuously pumped rumen fluid (Marden et al., 2005); in vivo: measurements performed continuously with probes inside the rumen and wireless device; Eh, redox potential.
†Eh expressed as a potential difference (E0) between a platinum electrode and a reference electrode, i.e., calomel or silver : silver chloride.
‡No precision about the reference electrode used.
§Four experimental hay-based diets consisting of 0, 25, 42 and 56% of ground wheat and barley concentrate mixture were tested in this trial. ¶Two experimental diets consisting of 30 and 60% of concentrate were tested in this trial.
29
Compared to pH, ruminal Eh has rarely been measured. It is mainly due to difficulties of
measurement since the Eh is sensible to air contamination. Table 1 shows Eh values obtained in
the rumen of various ruminants according to the method of measurement. Three techniques of Eh potentiometric measurements were reported in the literature. The first one (rumen fluid
samples) consists of a manual suction-strainer device that pumps out ruminal fluid from a cannulated animal to measure Eh on collected hand-samples in contact with atmospheric air,
after a 25-min stabilization period as recommended by Andrade et al. (2002). The second method (ex vivo) was developed by Marden et al. (2005) and allows continuous measurements of Ehon ruminal fluid pumped out of the rumen by a peristaltic pump into a thermostatic vessel
maintained at 39°C. The third method allows in vivo measurements performed continuously with probes inside the rumen and wireless device (Richter et al., 2010; Qin et al., 2017). This latter technique allows simultaneous measurement of Eh, pH and temperature in the rumen, also
allowing the monitoring of daily variations under strictly anaerobic conditions.
As shown in Table 1, whatever the method used, all recorded values are markedly negative reflecting the absence of oxygen and a strong reducing power of the rumen environment: the average Eh value is -238.3 mV ( 85.5; CV = 35.9%; n = 39). Particular attention should be
paid to the high variability in Eh values. The main factor explaining this variability is mainly
the mode of expression of Eh. By definition, the Eh is the potential difference measured between
a platinum electrode and a standard hydrogen electrode. In practice, this standard electrode is never used and all recorded values must be corrected according to the equation: Eh= E0 + C,
where E0 is the potential difference measured between a platinum electrode and a reference
electrode (calomel or silver-silver chloride) and C is the potential of the reference electrode used relative to the standard hydrogen electrode i.e. +199 mV at 39°C (Nordstrom, 1977). Values reported in the studies of (1957a,b), Mathieu et al. (1996), Andrade et al. (2002), Sar et al. (2005), and Qin et al. (2017) are relative to a potential difference (E0) (measured between a
platinum electrode and a reference electrode, i.e., calomel or silver-silver chloride). After correcting values (E0 + 199 mV) recorded by these authors, the new average Eh value is -178.1
mV ( 42.1; CV = 23.6%; n = 35). However, the correction of values did not reduce the variability that remains relatively high (CV = 23.6%). This variability could be partly explained by the difference in measurement techniques used which are not made under the same anaerobic conditions.
30
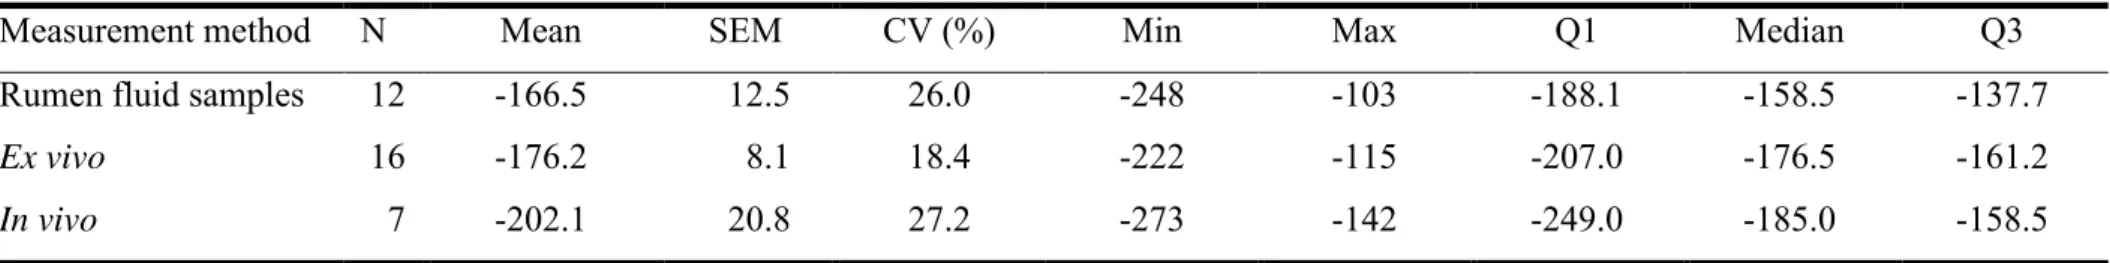
Table 2. Description of ruminal redox potential (mV) data (n = 35) depending on the measurement method used
Measurement method N Mean SEM CV (%) Min Max Q1 Median Q3
Rumen fluid samples 12 -166.5 12.5 26.0 -248 -103 -188.1 -158.5 -137.7
Ex vivo 16 -176.2 8.1 18.4 -222 -115 -207.0 -176.5 -161.2
In vivo 7 -202.1 20.8 27.2 -273 -142 -249.0 -185.0 -158.5
Rumen fluid samples, measurements performed by potentiometry on collected hand rumen fluid samples; Ex vivo, measurements performed with probes on continuously pumped rumen fluid (Marden et al., 2005); In vivo, measurements performed continuously with probes inside the rumen and wireless device; N, number of Eh values per measurement method; SEM, standard error of the mean; CV, coefficient of variation.
31
Table 2 shows the description of Eh data (n = 35) for each of the three different techniques
of measurement reported in the literature. A one-way ANOVA (with Eh value and measurement
method as dependent and independent variable respectively), performed to compare the mean Eh values, showed no significant difference (P = 0.207) between all the techniques. However,
mean Eh value measured in vivo (-202.1 mV) was numerically lower than that obtained by ex
vivo method (-176.2 mV) or by collected hand rumen fluid samples (-166.5 mV), probably because measurements are made under more strict anaerobic conditions. Compared to the ex vivo method, the average Eh value measured on collected hand rumen fluid samples was slightly
higher by about 9.7 mV. A trial (Marden et al., 2005) carried out simultaneously on the same animal to compare these two methods showed a difference seven times greater (about 70 mV) than that recorded (9.7 mV) in this review. Moreover, in addition to influence of measurement technique, other factors such as dietary characteristics (Julien 2010) might also affect ruminal Eh values.
Analyses of relationships between E
h, dietary factors and fermentation
parameters
There were only 24 potential references (Table 1) available for studying the relationships between the Eh, the nature of the diet and the activity of the rumen microbiota. Studies included
in the data file were selected based on the criteria of: (i) the nature of the reference electrode was specified, (ii) the ruminal Ehwas recorded simultaneously to pH, (iii) animal body weight
(BW) and dry matter intake (DMI) were reported and (iv) the composition of the diet was precisely described. Thus, 7 studies were excluded, such as those of Broberg (1957a,b), Mathieu et al. (1996), Andrade et al. (2002), Sar et al. (2005), and Qin et al. (2017), because it was not specified if Eh values were corrected in relation to the standard hydrogen electrode or not. The
study of Liu et al. (2009) was excluded because no precision was given about the reference electrode used. The study of Mwenya et al. (2004) and that of Michelland et al. (2011) were also excluded because animal BW and/or DMI were not specified. When several diets were tested within a study, they were considered as separate treatments in the statistical analysis. This left a database of 15 studies and 24 different diets.
Of the 15 studies, 8 did not specify the chemical composition of the diet (Marounek et al., 1982; Marounek et al., 1987; Waghorn, 1991; Marden et Bayourthe, 2005; Marden et al., 2005; Krizova et al., 2010; Marden et al 2013; Julien et al., 2014) and the others specified only OM,
32
CP, NDF and starch contents. In addition, data relative to the quantification of VFAs were not available in 7 trials (Barry et al., 1977; Marounek et al., 1982; Marounek et al., 1987; Waghorn, 1991; Marden et al., 2005; Krizova et al., 2010; Richter et al., 2010). Because of incomplete data, the Systool program and tables from Institut National de la Recherche Agronomique (2010) were used to estimate the chemical composition of the 24 diets, the daily ruminal production of tVFA and the proportion of each VFA. The Clark’s exponent (rH) which is a true index of the reducing status of a given milieu was also calculated by integrating both pH and Eh values in
the Nernst’s equation: rH = Eh/30 + 2 pH (Marounek et al., 1987). Descriptive statistics for data
set used in the analysis are presented in tables 3 and 4.
Table 3. Descriptive statistics for data set (n = 24) used to analyze relation between ruminal Eh and
diet composition
Item Mean SD Minimum Maximum
DMI (% BW) 2.31 1.17 1.14 4.44
Concentrate (% DM) 29,7 20.4 0 73.0
Digestible organic matter (g/kg DM) 641.4 50.7 531.5 735.9 Fermentable organic matter (g/kg DM) 496.0 59.7 376.2 605.4
Soluble carbohydrates (g/kg DM) 35.8 31.4 0 111.6
Starch (g/kg DM) 211.7 146.6 0 473.3
Rapidly fermentable carbohydrates (g/kg DM) 247.5 170.5 0 528.6
Rumen degradable starch (g/kg DM) 158.7 106.7 0 361.9
Neutral detergent fibre (g/kg DM)3 379.8 134.4 167.9 619.5
Digestible neutral detergent fibre (g/kg DM) 258.9 85.4 151.9 414.3
Crude protein (g/kg DM) 138.7 28.7 106.0 206.0
DCAD (mEq/kg DM)4 40.1 14.7 26.1 74.1
DMI, dry matter intake; BW, body weight; NDF, neutral-detergent fibre from forages; DACD, dietary anion cation difference: DACD (mEq / Kg DM) = (Na+ + K+) - (Cl- - S-); SD, standard
33
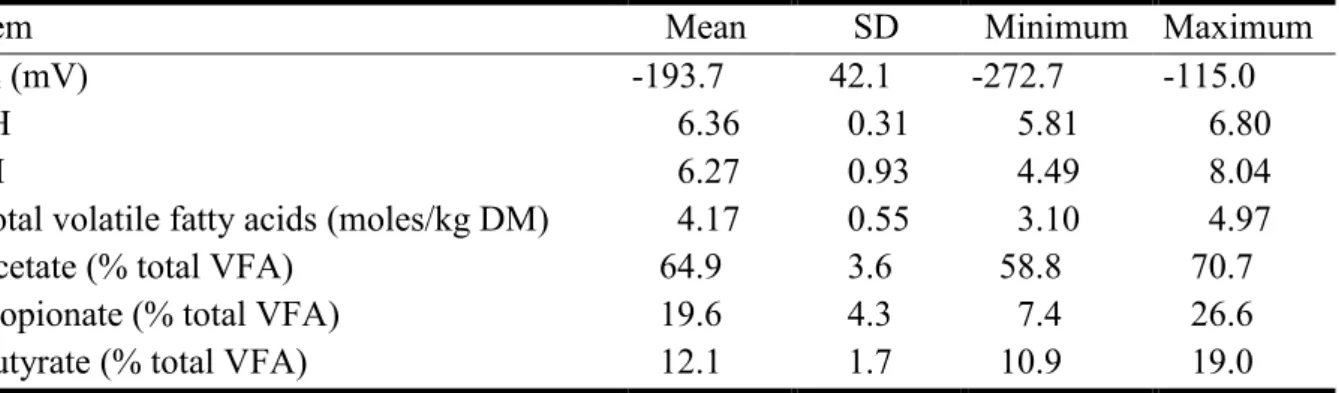
Table 4. Descriptive statistics for data set (n = 24) to analyze relation between ruminal Eh and
pH, rH, and VFA
Item Mean SD Minimum Maximum
Eh (mV) -193.7 42.1 -272.7 -115.0
pH 6.36 0.31 5.81 6.80
rH 6.27 0.93 4.49 8.04
Total volatile fatty acids (moles/kg DM) 4.17 0.55 3.10 4.97
Acetate (% total VFA) 64.9 3.6 58.8 70.7
Propionate (% total VFA) 19.6 4.3 7.4 26.6
Butyrate (% total VFA) 12.1 1.7 10.9 19.0
Eh, redox potential; rH, Clark's exponent = (Eh / 30) + (2 × pH); DM, dry matter; VFA, volatile fatty acids; SD, standard deviation.
Relationships between the Eh and, dietary factors and some ruminal fermentation parameters
were evaluated from principal component analysis (PCA) loading plots, based on the correlation matrix, consisting respectively of 12 variables (DMI, percentage of concentrate, digestible OM, fermentable OM, soluble carbohydrates, starch, rapidly fermentable carbohydrates, rumen degradable starch, NDF, digestible NDF, CP and dietary anion cation difference content) and 6 variables (pH, Clark's exponent, total volatile fatty acids produced, individual proportion of acetate, propionate and butyrate), using XLSTAT software (XLSTAT 2014.4.10 for Windows, Addinsoft, New York, NY). Dietary factors that presented significant correlation with Eh were used to identify groups of diets by using Hierarchical Ascendant
Classification (HAC).Due to the limited number of available data, the HAC was partitioned in two main groups which mainly differed by their Eh value. To determine how the dietary factors
discriminated the groups of diets in the HAC, a one-way ANOVA including group effect was performed for each factor. Tukey’s test was then applied to separate least square means that differed significantly. Statistical significance was established for p < 0.05 and tendencies discussed for 0.05 < p ≤ 0.10.
Results and Discussion
Impact of the diet on ruminal redox status
The first objective of this review was to assess the relationships between the Eh and some dietary
34
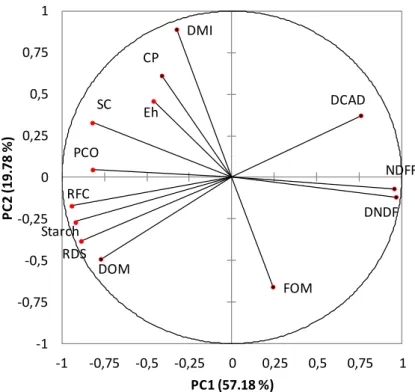
Figure 3. Loading plot describing the relationships between Eh and diets composition derived
from a principal component analysis.
CP, crude protein; DCAD, dietary cation anion difference; DMI, dry matter intake; DNDF, digestible neutral detergent fibre; DOM, digestible organic matter; Eh, redox potential; FOM, fermentable organic
matter; NDFF, neutral detergent fibre from forages; PCO, percentage of concentrate; RDS, rumen degradable starch; RFC, rapidly fermentable carbohydrates; SC, soluble carbohydrates
The cross-validation technique showed that two first components were responsible for 77% of the total variance in the pooled data. There were three positive correlations between Eh and
some dietary factors. The highest r value was observed between Eh and DMI (r = 0.651; p =
0.001) followed by the proportion of concentrate in the diet (PCO; r = 0.497; p = 0.015) and soluble carbohydrates content (SC; r = 0.391; p = 0.059). On the contrary, Eh was negatively
correlated with neutral detergent fibre from forages (NDFF; r = -0.441; p = 0.031) and tended to be negatively correlated with digestible neutral detergent fibre (DNDF; r = -0.368; p = 0.077). The HAC classified the diets in two groups (Table 5) depending on the Eh level. Diets in group
1 led to stronger reducing conditions than diets in group 2 (p = 0.013): -203 (sd = 42.5) vs -163 mV (sd = 29.1). Compared to diets in group 2, diets in group 1 were characterized by a NDFF content 1.9 times higher (p < 0.0001) and three times lower proportion of concentrate (p < 0.0001). This group consists mainly of hay-based diets composed (DM basis) of 100% hay
Eh DMI PCO FOM DOM SC Starch RFC RDS NDFF DNDF CP DCAD -1 -0,75 -0,5 -0,25 0 0,25 0,5 0,75 1 -1 -0,75 -0,5 -0,25 0 0,25 0,5 0,75 1 P C 2 (1 9 .7 8 % ) PC1 (57.18 %)
35
(meadow or alfalfa) or hay associated with barley, wheat or corn-silage. However, in these diets, the proportion of cereals or corn-silage did not exceed 20%. The stronger reducing conditions induced by these diets could be related to their high NDFF content. This is in accordance with the results of Giger-Reverdin et al. (2006) who recorded a decrease in ruminal Eh when chewing
activity of goats increased due to a greater amount of forage in the diet i.e. a greater amount of NDFF . On the contrary, increasing the proportion of concentrates or adding starch and soluble carbohydrates to diets led to less reducing conditions. This was the case for diets in group 2 which had a higher (p < 0.0001) soluble carbohydrates content compared to diets in group 1. All these diets were corn silage-based diets associated with crushed or ground corn. In group 2, we also found a diet consisting of a mixture of chopped grass hay (27%), ensiled sugar beet pulp (13%) and concentrate (60%). These preliminary results showed that the level of Eh in the
rumen seemed to be directly related to the dietary characteristics (starch vs. cellulose).
Table 5. Hierarchical ascendant classification in two groups according Eh value (n = 24).
Group 1
n = 11 Group 2 n = 13 Pooled SD p-value
Eh (mV) -203.0 -162.9 35.8 0.013 DMI (% BW) 1.8 3.0 1.0 0.01 PCO (% DM) 0.16 0.47 0.13 <0.0001 SC (g/kg DM) 17.8 61.0 23.2 <0.0001 NDFF (g/kg DM) 471.8 251.0 77.2 <0.0001 DNDF (g/kg DM) 314.4 181.4 54.2 <0.0001
Eh, redox potential; DMI, dry matter intake; PCO, percentage of concentrate;
SC, soluble carbohydrates; NDFF, neutral detergent fibre from forages; DNDF, digestible neutral detergent fibre; SD, standard deviation; n, number of diets.
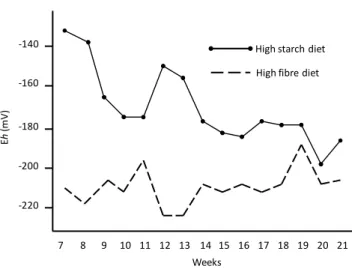
These trends are in agreement with the results of other studies. Monteils et al. (2009) showed that ruminal Eh in dairy heifers fed a fibre diet (70% of NDF on a DM basis) was lower than
that recorded in animals fed a diet containing a high proportion of starch (46% on a DM basis): -210 vs. -171 mV, even though the difference disappears with time and with adaptation of animals to their diet (Figure 4). Similarly, a sudden increase of readily fermentable carbohydrates (RFC) content in the diet fed to dry dairy cows led to an abrupt change of the ruminal redox status (Michelland et al., 2011): from -222 mV for a high fibre diet to -168 mV for a high RFC diet. This change was accompanied by a concomitant decrease in the diversity of rumen bacterial communities at the time of disruption. Friedman et al. (2017) also observed a significantly higher Eh in the rumen fluid originating from cows fed a high-grain (65%) diet
36
than in the rumen fluid originating from cows fed a non-grain diet. This change could be induced by the diet and/or metabolic activities of microbiota members, which in turn modify the community.
Figure 4. Changes in ruminal redox potential (Eh) in heifers fed high starch-diet or fed high
fibre diet (from Monteils et al., 2009).
Ruminal redox conditions and bacterial activity
Another output of this study was to identify the relationships between the Eh and bacteria
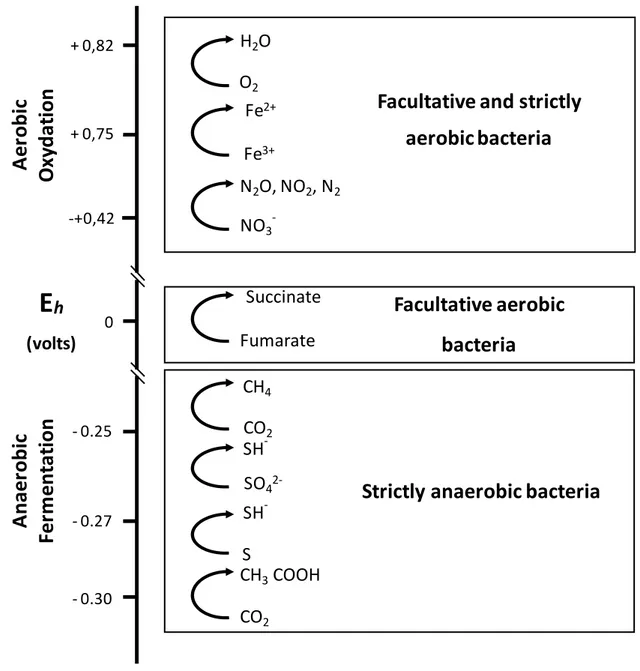
activity, evaluated by the measurement of the pH and VFA produced in the rumen content. This question is relevant because, in the rumen, numerous chemical reactions are involved in metabolic pathways which ensure both a transfer and utilization of energy. Microbial cell metabolism is thermodynamically driven by different mixed oxidation-reduction systems
(Figure 5) (Ungerfeld and Kohn, 2006). Therefore, a relationship was expected between
ruminal Eh and metabolic activity of the microorganisms during fermentation, as already
observed by Baldwin and Emery (1960) and Kalachniuk et al. (1994). The loading scores for the variables from the PCA are presented in Figure 6. The cross-validation technique established that two first components are responsible for about 81% of the total variance in the pooled data. Redox potential was negatively correlated with pH (r2 = 0.747; p = 0.03; Figure
7). Some studies demonstrated a linear relationship between these two parameters in the
digestive compartments where fermentation processes occur: the caecum of rabbit (Kimsé et al., 2009), the caecum of pig (Lizardo et al., 2012) and the rumen of small ruminants (Baldwin and Emery, 1960; Marounek et al., 1987; Giger-Reverdin et al., 2006). In the present study, we obtained a non-linear correlationand it appears that below a pH of 6, the Eh value no longer
-140 -160 -180 -200 -220 7 8 9 10 11 12 13 14 15 16 17 18 19 20 21 Weeks Eh (m V )
High starch diet High fibre diet
37
varies (Figure 7).This concerns only diets with a NDFF content less than 30% containing corn silage as sole forage and for a DMI between 3 and 4.5% BW. In any case, relationship between Eh and pH reflects that many biochemical reactions in digestive ecosystems depend on redox
couples with exchanges of protons.
Figure 5. Redox potential and energetic pathways: tower showing electron cascade (from
Ungerfeld and Kohn, 2006).
A
n
a
er
o
b
ic
Fer
m
ent
a
ti
o
n
A
er
ob
ic
O
xy
d
at
ion
+ 0,82 + 0,75 0 -+0,42 - 0.25 - 0.27 - 0.30Facultative and strictly
aerobic bacteria
Facultative aerobic
bacteria
Strictly anaerobic bacteria
E
h (volts) CO2 CH4 CO2 CH3COOH S SH -SO4 2-SH -Fumarate Succinate NO3 -N2O, NO2, N2 Fe3+ Fe2+ O2 H2O38
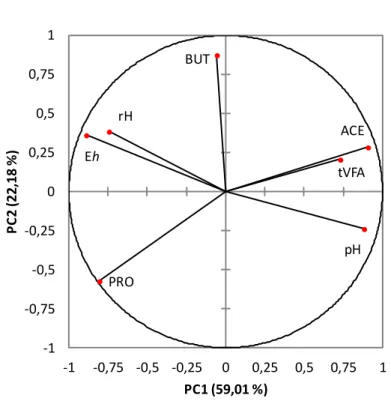
Figure 6. Loading plot describing the relationships between redox potential (Eh) and
fermentative parameters derived from a principal component analysis.
ACE, acetate; BUT, butyrate; Eh, redox potential; PRO, propionate; rH, Clark's exponent; tVFA, total volatile fatty acids.
Figure 7. Relationship between ruminal redox potential (Eh) and pH.
Redox potential was negatively correlated with tVFA produced (r2 = 0.21; p = 0.048; Figure
8a) and proportion of acetate (r2 = 0.42; p = 0.003; Figure 8b), and positively correlated with
Eh pH rH tVFA ACE BUT PRO -1 -0,75 -0,5 -0,25 0 0,25 0,5 0,75 1 -1 -0,75 -0,5 -0,25 0 0,25 0,5 0,75 1 P C 2 (2 2 ,1 8 % ) PC1 (59,01 %)
39
proportion of propionate (r2 = 0.26; p = 0.027; Figure 8c) as previously observed by Lizardo et
al. (2012) in the caecum of pig. Barry et al. (1977a) hypothesized that hydrogen produced by the metabolism of the microorganisms could be responsible for the preservation of the reducing conditions of the ruminal milieu. Indeed, the production of acetate drives the production of H2
while that of propionate is consumer of H2. The orientation of ruminal fermentations induced
by the nature of the diet, producing more or less H2, could be an explanation in the correlation
established between Eh and tVFA but also between Eh and, acetate or propionate.
Some experiments have illustrated the fact that Eh is an indicator of bacterial activity. Studies
conducted in calves from birth to weaning by Rey et al. (2012) and Julien et al. (2015) have shown that the Eh in the rumen takes positive values in the first day of life then declines over
few days to reach highly negative values, characteristic of a strong reducing environment. The values range from +224 mV at birth to -141 mV at weaning for Rey et al. (2012) and from +253 mV to -159 mV for Julien et al. (2015). The positive values at birth are consistent with the Eh
value (+270 mV) reported by Julien et al. (2010b) in sterilized rumen fluid devoided of living organisms. Observed variations of Eh in calves reflect disruption in the milieu and successive
implantation of different microorganisms. If Eh appeared to be as influential as pH on bacterial
activities, it was identified as a mechanism by which diet could impact ruminal microbiome composition (Ungerfeld and Kohn, 2006). Correlations between the Eh and the richness of
bacterial community have been demonstrated by Julien et al. (2010c), indicating a close relationship between the metabolic activity of the microorganisms and the Eh in the rumen. The
oxidation-reducing status of the rumen, which affects the digestive microbiota of herbivores and its activity, appeared to be a potential indicator of ruminal functioning.
40
Figure 8. Relationship between Eh and tVFA produced (moles/d) (a), proportions (% tVFA) of
41
Conclusions
The ruminal ecosystem is a complex environment which is interesting to discuss in terms of its redox status as a reflection of an intense bacterial activity. This review revealed Eh to be
dependent on the diet composition and DMI, at least within the range of diets studied here. Only the measurements carried out under strict anaerobic conditions, such as those with in vivo method, make it possible to have an objective and accurate value of Eh. Published data
concerning the in vivo measurement of ruminal Eh are scarce and much more in vivo trials
involving such physico-chemical measurement with various types of diets would validate this preliminary analysis.
References
Andrade, P. V. D.; Giger-Reverdin, S.; Sauvant, D., 2002: Relationship between two parameters (pH and redox potential) characterising rumen status. Influence of diets. Rencontres Recherches Ruminants, 9, 332.
Baldwin, R. L.; Emery, R. S., 1960: The oxidation-reduction potential of rumen contents. Journal of Dairy Science 43, 506-511.
Barry, T. N.; Thompson, A.; Armstrong, D. G., 1977a: Rumen fermentation studies on two constrasting diets. 1. Some characteristics of the in vivo fermentation, with special reference to the composition of the gas phase, oxidation/reduction state and volatile fatty acid proportions. Journal of Agricultural Science 89, 183-195.
Broberg, G., 1957a: Measurement of the redox potential in rumen contents; I. In vitro measurements on healthy animals. Nordisk Verinaermedicin 9, 918-928.
Broberg, G., 1957b: Measurements of the redox potential in rumen contents; II. In vitro measurements on sick animals. Nordisk Verinaermedicin 9, 931-940.
Brune, A., 1998: Termite guts: the world's smallest bioreactors. Trends in Biotechnology 16(1), 16-21.
Da Veiga, L.; Chaucheyras-Durand, F.; Julliand, V., 2005: Comparative study of colon and faeces microbial communities and activities in horses fed a high starch diet. In: 3rd European Conference Horse Nutrition, Pferdeheilkunde, Hannover, Germany; p. 45-46. Escalante-Minakata, P.; Ibarra-Junquera, V.; Rosu, H.; C; De León-Rodríguez, A.; González-García, R., 2009: Online monitoring of Mezcal fermentation based on redox potential measurements. Bioprocess and Biosystems Engineering 32(1), 47–52.