HAL Id: hal-02454210
https://hal.archives-ouvertes.fr/hal-02454210
Submitted on 24 Jan 2020
HAL is a multi-disciplinary open access
archive for the deposit and dissemination of
sci-entific research documents, whether they are
pub-lished or not. The documents may come from
teaching and research institutions in France or
abroad, or from public or private research centers.
L’archive ouverte pluridisciplinaire HAL, est
destinée au dépôt et à la diffusion de documents
scientifiques de niveau recherche, publiés ou non,
émanant des établissements d’enseignement et de
recherche français ou étrangers, des laboratoires
publics ou privés.
Distributed under a Creative Commons Attribution| 4.0 International License
lymph nodes drives metastases in breast cancer through
complementary mechanisms
Floriane Pelon, Brigitte Bourachot, Yann Kieffer, Ilaria Magagna, Fanny
Mermet-Meillon, Isabelle Bonnet, Ana Costa, Anne-Marie Givel, Youmna
Attieh, Jorge Barbazan, et al.
To cite this version:
Floriane Pelon, Brigitte Bourachot, Yann Kieffer, Ilaria Magagna, Fanny Mermet-Meillon, et al..
Cancer-associated fibroblast heterogeneity in axillary lymph nodes drives metastases in breast
can-cer through complementary mechanisms. Nature Communications, Nature Publishing Group, 2020,
�10.1038/s41467-019-14134-w�. �hal-02454210�
Cancer-associated
fibroblast heterogeneity in
axillary lymph nodes drives metastases in breast
cancer through complementary mechanisms
Floriane Pelon
1,2
, Brigitte Bourachot
1,2
, Yann Kieffer
1,2
, Ilaria Magagna
1,2
, Fanny Mermet-Meillon
3
,
Isabelle Bonnet
4
, Ana Costa
1,2
, Anne-Marie Givel
1,2
, Youmna Attieh
5
, Jorge Barbazan
5
,
Claire Bonneau
1,2
, Laetitia Fuhrmann
6
, Stéphanie Descroix
7
, Danijela Vignjevic
5
, Pascal Silberzan
4
,
Maria Carla Parrini
3
, Anne Vincent-Salomon
6
& Fatima Mechta-Grigoriou
1,2
*
Although
fibroblast heterogeneity is recognized in primary tumors, both its characterization
in and its impact on metastases remain unknown. Here, combining
flow cytometry,
immu-nohistochemistry and RNA-sequencing on breast cancer samples, we identify four
Cancer-Associated Fibroblast (CAF) subpopulations in metastatic lymph nodes (LN). Two myo
fi-broblastic subsets, CAF-S1 and CAF-S4, accumulate in LN and correlate with cancer cell
invasion. By developing functional assays on primary cultures, we demonstrate that these
subsets promote metastasis through distinct functions. While CAF-S1 stimulate cancer cell
migration and initiate an epithelial-to-mesenchymal transition through CXCL12 and TGF
β
pathways, highly contractile CAF-S4 induce cancer cell invasion in 3-dimensions via NOTCH
signaling. Patients with high levels of CAFs, particularly CAF-S4, in LN at diagnosis are prone
to develop late distant metastases. Our
findings suggest that CAF subset accumulation in LN
is a prognostic marker, suggesting that CAF subsets could be examined in axillary LN at
diagnosis.
https://doi.org/10.1038/s41467-019-14134-w
OPEN
1Institut Curie, Stress and Cancer Laboratory, Equipe labélisée par la Ligue Nationale contre le Cancer, PSL Research University, 26, rue d’Ulm, F-75005
Paris, France.2Inserm, U830, 26, rue d’Ulm, F-75005 Paris, France.3Analysis of Transduction Pathway, Institut Curie, Inserm, U830, PSL Research University, 26 rue d’Ulm, F-75005 Paris, France.4Institut Curie, Biology-inspired Physics at MesoScales Laboratory, Equipe labélisée par la Ligue Nationale contre le Cancer, CNRS UMR168, PSL Research University, Sorbonne Université, 26, rue d’Ulm, F-75005 Paris, France.5Institut Curie, Cell Migration and
Invasion, UMR144, PSL Research University, 26, rue d’Ulm, F-75005 Paris, France.6Department of Pathology, Institut Curie Hospital, 26, rue d’Ulm, F-75248
Paris, France.7Institut Curie, Laboratoire Physico Chimie Curie, Institut Pierre-Gilles de Gennes, CNRS UMR168, 75005 Paris, France. *email: fatima.mechta-grigoriou@curie.fr
123456789
B
reast cancers (BCs) are the most frequent cancers in
women worldwide. Diagnosis is mainly based on molecular
subtype (Luminal A/B, HER2 and triple-negative (TN)
defined according to cancer cell expression of progesterone,
estrogen and HER2 receptors), tumor size and grade, as well as
axillary lymph node (LN) metastasis. Most BC deaths arise
from distant metastases in bone, liver and lung
1,2. LNs are
first
reached by tumor cells evading from primary tumors (PTs) and
number of invaded LNs is a strong prognostic factor
3. Tumor
metastasis is a multi-step process, including local invasion,
intravasation, migration in blood or lymph stream, extravasation
and distant organ colonization. Among others, one mechanism
involves cancer cell epithelial-to-mesenchymal transition (EMT),
which involves TGFβ but also NOTCH and WNT signaling
pathways
4–7.
Tumors are complex ecologies composed of numerous cell
types, which participate in tumorigenesis and modulate cancer
cell invasiveness
8–11. Cancer-associated
fibroblasts (CAFs) are
abundant and involved in many tumor hallmarks such as
angiogenesis, tumor cell proliferation, treatment resistance,
immunomodulation and metastases
9,12–15. In particular, CAFs
are well-described to enhance tumor invasion and metastases,
especially in BC. Indeed, CAFs are able to secrete factors, such as
TGFβ and CXCL12, that directly stimulate cancer cell
prolifera-tion, EMT and migration
16–19. Moreover, CAFs indirectly
pro-mote tumor spread via angiogenesis induction through VEGF
and IL6
9,20. Besides, CAFs can directly interact with cancer cells
via heterotypic E-cadherin–N-cadherin (CDH1–CDH2) adhesion
and drive their invasion
21. They remodel the extracellular matrix
(ECM)
22,23and produce spaces or even tracks followed by cancer
cells
24–26. Recently, lung epithelial cells were shown to acquire
cancer-associated parenchymal-like feature in metastatic niche
7.
CAFs are poorly described in metastases, including axillary LN
metastases, with only few studies assessing some markers, such as
podoplanin (PDPN) or
α-smooth muscle actin (αSMA)
27–30.
CAFs are known to be heterogeneous in PTs
31–34, but
char-acterization of this heterogeneity and its link with CAF functions
is still far from being understood. If the role of CAFs in tumor
invasion is well established, here we investigated if and how CAF
subsets act on metastatic spread. As we recently identified four
CAF subsets (named CAF-S1 to -S4) in BC
32, we investigated
CAF heterogeneity in metastatic LN and tested if one or several of
these CAF subsets could be involved in BC cell spread. We show
here that two particular subsets, CAF-S1 and CAF-S4, strikingly
accumulate in metastatic LN and positively modulate BC cell
invasion by complementary mechanisms. On the one hand,
CAF-S1 induce cancer cell migration and EMT initiation in a CXCL12/
TGFβ-dependent manner. On the other hand, CAF-S4 contractile
properties promote cancer cell motility and invasiveness in
3-dimensions (3D) through NOTCH-mediated pathways.
Impor-tantly, CAF-S1 and CAF-S4 content in LN is an independent
prognostic factor at diagnosis, underlining the clinical relevance
of our
findings.
Results
Metastatic breast cancer axillary LNs exhibit four CAF subsets.
To investigate CAF heterogeneity in BC metastatic axillary LNs,
we
first performed multicolor flow cytometry
(fluorescence-acti-vated cell sorting (FACS)) on freshly resected invaded LN, with
their matched PTs as controls (Supplementary Table 1). We
applied the same gating strategy on both tissues by
first excluding
debris, dead cells, doublets, hematopoietic (CD45+), epithelial
(EPCAM+), endothelial (CD31+) and red blood cells (CD235a+)
(Supplementary Fig. 1a). We then characterized the CD45−
EPCAM− CD31− CD235a− fraction enriched in fibroblasts by
studying
five CAF markers: FAP (fibroblast activation protein α1),
CD29 (Integrin
β1), αSMA, PDGFRβ (platelet-derived growth
factor receptor-β) and PDPN (Fig.
1
a). On FACS data, we applied
FlowSom
35, an unsupervised automated algorithm which orders
cells according to their phenotypic similarities (Fig.
1
b, c).
Flow-Som clustered CAFs into four main branches and thus
dis-tinguished four CAF subsets (CAF-S1 to -S4) in invaded LNs
(Fig.
1
b and Supplementary Fig. 1b). Four branches were also
detected in corresponding PT (Fig.
1
c and Supplementary Fig. 1c),
confirming data in breast and ovarian PT
32,33. Although
expression of CD29 in CAF-S3 was slightly lower and PDGFRβ in
CAF-S4 slightly higher in LNs than in PTs, systematic pairwise
comparison of each CAF marker protein level between LNs and
PTs showed the identification of CAF-S1, -S2, -S3 and -S4 in
metastatic LNs (Fig.
1
d, e). Hence, these data reveal that four CAF
subsets are detected in metastatic BC LNs.
As normal LN structure relies on a
fibroblastic network
constituted by
fibroblast reticular cells (FRCs) described as
PDPN+ cells
36, we investigated the analogy between normal
stromal cells and CAF subsets in LNs. Even though non-invaded
LNs were hardly accessible because almost fully used for diagnosis,
we had access to two non-invaded specimens (Supplementary
Fig. 1d), along with their matched invaded LNs. Non-invaded
axillary LNs were clearly enriched in CAF-S2- and CAF-S3-like
cells, while the matched invaded LNs showed a much higher
proportion of CAF-S1 and CAF-S4 (Fig.
1
f and Supplementary
Fig. 1e). CAF-S2 and CAF-S3 subpopulations are thus detected in
metastatic LNs, but also in non-invaded LNs. These results
corroborated our previous data showing that S2- and
CAF-S3-like cells are detected in healthy breast tissue
32, suggesting that
these CAFs might derive from normal resident
fibroblasts. In that
sense, the pattern of CAF-S3 in LNs was slightly different than the
one detected in PTs, as observed with CD29 staining (Fig.
1
b–d),
suggesting that normal-like CAF-S2/S3 could be more affected by
their tissue of origin than CAF-S1 and CAF-S4. In contrast to
CAF-S2 and CAF-S3, CAF-S1 and CAF-S4 were strictly observed
in invaded LNs and positively correlated with tumor cell invasion
(Fig.
1
g). Thus, these data highlight a potential link between
both CAF-S1 and CAF-S4 and tumor cell invasion in LNs. In
conclusion, we identified four CAF subsets in metastatic LNs
defined as: CAF-S1: FAP
HighCD29
Med-HighαSMA
HighPDPN
HighPDGFRβ
High; CAF-S2: FAP
NegCD29
LowαSMA
Neg-LowPDPN
LowPDGFRβ
Low; CAF-S3: FAP
Neg-LowCD29
MedαSMA
Neg-LowPDPN
LowPDGFRβ
Low-Med; CAF-S4: FAP
Low-MedCD29
HighαSMA
HighPDPN
LowPDGFRβ
Med. Besides, the amounts of both
CAF-S1 and CAF-S4 subsets in LNs are linked to BC cell
metastatic spread.
CAF-S1 and CAF-S4 are the most abundant subsets in
static LN. To decipher the link between CAF subsets and
meta-static spread, we studied metameta-static LN sections from a
retrospective cohort of 124 BC patients (Supplementary Table 2).
We analyzed invaded zones of metastatic LN, identified using
EPCAM marker (Supplementary Fig. 2a). We
first observed that
LN stroma represented around 25–30% of invaded areas,
inde-pendently of BC subtypes (Fig.
2
a). We performed
immunohis-tochemistry (IHC) of
five CAF markers (FAP, CD29, FSP1,
PDGFRβ, αSMA) on serial LN sections (Fig.
2
b, c). Here, we
replaced PDPN by FSP1 because we could not
find a
PDPN-specific antibody for IHC, but we verified that PDPN and FSP1
markers recognized the same cells by FACS (Supplementary
Fig. 2b). Histological scoring of each CAF marker demonstrated
that invaded LNs from Luminal (Lum A and B) cases exhibited
the lowest histological scores (H-scores) except for PDGFRβ,
whereas both HER2 and TN LNs showed the highest H-scores
(Fig.
2
b, c and Supplementary Fig. 2c). When applying a decision
tree algorithm to determine CAF subset enrichment
32(Fig.
2
d),
we found that 96% of metastatic LNs showed accumulation of
CAF-S1 and CAF-S4 (Fig.
2
e). Luminal LNs were mainly
enri-ched in S4, while HER2 and TN cases displayed both
CAF-S1 and CAF-S4 predominance. We observed that the median
percentage of
fibroblasts positive for FAP, SMA and CD29
(reflecting S1 identity) reached 75% of total CAFs in
CAF-S1-enriched LNs, and that
fibroblasts negative for FAP but
positive for SMA and CD29 (reflecting CAF-S4 identity) reached
60% of total
fibroblasts in CAF-S4-enriched LNs. We also
developed an image analysis tool that combined spatial
LN CD29 αSMA PDGFRβ CD29 αSMA PDGFRβ FA P 104 104 105 104 105 104 105 –103 –103 –103 –103 0 103 104 105 0 103 104 105 –103 0 103 104 105 –103 0 103 104 105 0 103 103 104 105 –103 0 103 104 105 –103 0 103 104 105 103 104 105 0 103 104 0 103 104 105 0 103 104 105 –103 0 103 104 105 0 103 103 103 0 104 103 0 104 103 0 0 104 105 103 0 0 103 104 105 0 –103 0 103 104 105 0 103 104 105 –103 0 103 104 105 –103 0 103 104 105 PDPN CD29 FA P PDPN CD29 CAF-S1 CAF-S2 CAF-S3 CAF-S4a
PTb
c
High Low Marker intensity PDGFRβ (PT) PDPN (PT) FAP (PT) CD29 (PT) CAF-S1 CAF-S2 CAF-S3 CAF-S4 PDGFRβ (LN) PDPN (LN) αSMA (LN) FAP (LN) CD29 (LN) CAF-S1 CAF-S2 CAF-S3 CAF-S4d
e
CD29 αSMA PDGFRβ CD29 αSMA PDGFRβ FA P PDPN CD29 FA P PDPN CD29f
% CAF-S1 in CAF % CAF-S2 in CAF % CAF-S3 in CAF % CAF-S4 in CAFg
1 10 50 %EPCAM+ in cells 25 50 75 p = 0.04 ρ = 0.48 1 10 50 1 10 50 %EPCAM+ in cells p = 0.003 ρ = 0.66 1 10 50 1 10 50 %EPCAM+ in cells p = 0.02 ρ = –0.54 10 50 1 10 50 %EPCAM+ in cells p = 0.02 ρ = -0.53 Non-metastatic LN Metastatic LN CAF-S1 CAF-S2 CAF-S3 CAF-S4 9 10 11 12 13 speMFI in PT 9 10 11 12 13 7 8 9 10 11 12 7 8 9 10 11 12 speMFI in PT 10 11 12 13 10 11 12 13 speMFI in PT 5 7.5 10 12.5 15 5 7.5 10 12.5 15 speMFI in PT speMFI in LN 4 6 8 10 12 4 6 8 10 12 speMFI in PT 9 10 11 12 13CAF−S1CAF−S2CAF−S3CAF−S4 7 8 9 10 11 12
CAF−S1CAF−S2CAF−S3CAF−S4 10
11 12 13
CAF−S1CAF−S2CAF−S3CAF−S4 5
7.5 10 12.5 15
CAF−S1CAF−S2CAF−S3CAF−S4 4
6 8 10 12
CAF−S1CAF−S2CAF−S3CAF−S4
SpeMFI PDGFRβ PDPN αSMA FAP CD29 PT LN p = 0.45 p = 0.89 p = 0.11 p = 0.08 p = 0.14 p = 0.36 p = 0.008 p = 0.68 p = 0.89 p = 0.85 p = 0.52 p = 0.01 p = 0.89 p = 0.80 p = 0.33 p = 0.52 p = 0.68 p = 0.42 p = 0.33 p = 0.60 PDGFRβ PDPN αSMA FAP CD29 p < 2 × 10–16 p < 2 × 10–16 p < 2 × 10–16 p = 5.5 × 10⁻¹¹ p = 2.9 × 10⁻¹⁵ ρ = 0.87 ρ = 0.94 ρ = 0.73 ρ = 0.73 ρ = 0.81 CAF-S1 CAF-S2 CAF-S3 CAF-S4 αSMA (PT)
registration and computational analysis to generate maps of CAF
subsets at cellular level in invaded LNs (Fig.
2
f and
Supplemen-tary Fig. 2d). Representative pictures of CAF subset maps
con-firmed the enrichment in CAF-S1 or CAF-S4 in invaded LNs.
Interestingly, among the 124 LNs analyzed, we had access to 41
corresponding PTs (Lum A, HER2, TN) for matched analyses
(Fig.
2
g and Supplementary Fig. 2e). We found that FAP and
αSMA H-scores were similar between PTs and LNs, whereas
CD29 and PDGFRβ were higher and FSP1 lower in LNs
(Sup-plementary Fig. 2e). When we combined H-scores using the
decision tree algorithm, we found that CAF enrichments in
metastatic LNs were significantly different from those in matched
PTs, with a strong increase in CAF-S4 in LNs (Fig.
2
g). Similarly,
when comparing invaded LNs to PTs (unmatched samples) from
a larger BC cohort with at least one invaded LN at diagnosis (N+)
(Supplementary Table 2), we confirmed the accumulation of
CAF-S4, the increase in CAF-S1 and the decrease in CAF-S2 and
CAF-S3 in invaded LNs compared to PTs (Fig.
2
h). Metastatic
LNs were particularly enriched in CAF-S4 compared to PTs in
Luminal A and TN subtypes (Fig.
2
i), possibly because HER2 PTs
exhibited already high CAF-S4 content. As CAF marker H-scores
were significantly correlated between PTs and LNs (FAP: r =
0.54, p
= 3.10–4; CD29: r = 0.45, p = 3.10–3; FSP1: r = 0.52, p =
6.10–4; SMA: r = 0.44, p = 4.10–3 by Pearson’s correlation test),
we hypothesized that CAF-S1-enriched tumors could give rise to
CAF-S1-enriched LNs, with similar consideration for CAF-S4.
Indeed, 79% of enriched PTs matched with
CAF-S1-enriched LNs and 71% of CAF-S4-CAF-S1-enriched PTs matched with
CAF-S4-enriched LNs (Fig.
2
j) (p
= 0.007 by Fisher's exact test).
Reciprocally, enriched LNs mostly matched to
CAF-S1-enriched PTs (69%). In contrast, CAF-S4-CAF-S1-enriched LNs
corre-sponded to PTs enriched in different CAF subsets (p
= 0.005 by
Fisher's exact test), suggesting that CAF-S4 in LNs could derive
from distinct CAF subsets. In conclusion, our data show that
metastatic LN stroma is enriched in myofibroblastic CAF-S1 and
CAF-S4 subsets. Interestingly, CAF enrichments are different in
LNs compared to PTs since LN accumulating CAF-S4 can
cor-respond to different types of PTs that are enriched either in
CAF-S4 or in inactivated CAFs (CAF-S2 or CAF-S3).
CAF subsets show similar signatures between PTs and
meta-static LNs. As CAF-S1 and CAF-S4 subsets were largely
pre-dominant in LNs, we next aimed at characterizing these LN CAF
subsets on a molecular basis and compared them to PT CAF
subsets. CAF-S1 and CAF-S4 from both PTs and LNs (n
= 5
pairs) were FACS-sorted by excluding dead, hematopoietic,
epi-thelial, endothelial cells and erythrocytes and analyzing CAF
markers (using the same gating strategy as in Supplementary
Fig. 1). We performed RNA sequencing (RNAseq) on CAF-S1
and CAF-S4
fibroblasts, and EPCAM+ cancer cells sorted from
PTs and matched invaded LNs (Supplementary Table 1).
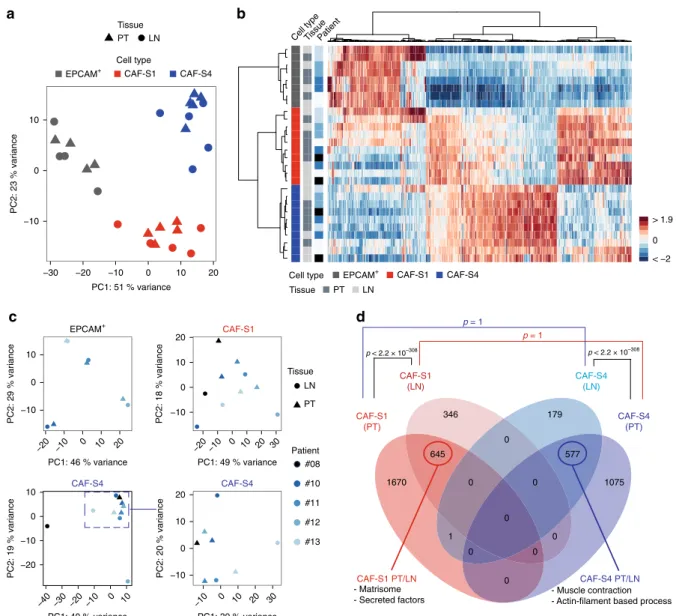
Unsu-pervised principal component analysis (PCA) and hierarchical
clustering (HC) built on the 500 most variant genes distinguished
tumor cells, CAF-S1 and CAF-S4
fibroblasts (Fig.
3
a, b). The
first
PCA component (51% variance) differentiated EPCAM+ cells
from CAF, and the second (23% variance) CAF-S1 from CAF-S4
(Fig.
3
a). HC enabled us to visualize specific transcriptomic
profiles (Fig.
3
b). PCA and HC showed that samples from PTs
and LNs were mixed within each cellular population, highlighting
that differences between CAF subsets (CAF-S1/CAF-S4) were
higher than between tissue of origin (PT/LN). We performed
PCA on each population on their respective 500 most variant
genes and still noted that PT and LN samples did not segregate
(Fig.
3
c). In line with published data
4,37, tumor cells clustered
with their matched EPCAM
+ LN cells, suggesting that tumor cell
transcriptomes vary more between patients than between PTs and
LNs. In contrast, patient effect was less detectable in CAF-S1 or
CAF-S4 (Fig.
3
c). We next performed paired differential analyses
of CAF-S1 and CAF-S4 considering either PT or LN samples.
CAF-S1 upregulated genes were mainly involved in ECM
organization and CAF-S4-specific genes in muscle contraction
(Supplementary Table 3 and Fig.
3
d). As CAF-S4 exhibited
pericyte-like signature, we confirmed that we could detect
MCAM-positive
fibroblasts in invaded LNs (Supplementary
Fig. 2f), thereby confirming the existence of pericyte-like CAF
and their potential pericyte origin
32,38–41. Moreover, there was a
strong overlap between PT and LN signatures for each CAF
subset (Fig.
3
d), suggesting that CAF-S1 and CAF-S4 from
metastatic LN are molecularly close to CAF-S1 and CAF-S4 from
PTs (Supplementary Tables 4 and 5).
CAF-S1 and CAF-S4 exhibit distinct migration and invasion
properties. As invaded LNs show predominantly CAF-S1 and
CAF-S4
fibroblasts, we hypothesized they could be involved in
metastatic spread and we analyzed their properties by functional
assays. We established CAF-S1 and CAF-S4 primary cell cultures
from BC patients. We
first confirmed by RNAseq on four CAF-S1
and CAF-S4 pairs (three couples from PTs and one from LN)
that, after several passages in culture, these cells kept similar
molecular identities as those detected without culture
(Supple-mentary Fig. 3a–c). Moreover, we confirmed by FACS that CAF
markers at protein levels corroborated data from fresh samples
(Supplementary Fig. 3d). We next deciphered S1 and
CAF-S4 intrinsic characteristics. We
first observed that CAF-S1
pro-liferated slightly faster than CAF-S4 (median doubling time
=
2.1 days for CAF-S1 and 3.0 days for CAF-S4) (Fig.
4
a).
More-over, CAF-S1 displayed higher migration skills compared to
CAF-S4, as assessed by Transwell assays (Fig.
4
b). We validated
this result using cell exclusion zone assays by manually tracking
cells and calculated their velocity, persistence and directionality.
CAF-S1 were faster and more persistent than CAF-S4, CAF-S1
trajectories being more perpendicular to the edges than CAF-S4
(Fig.
4
c and Supplementary Fig. 3e). We also analyzed CAF
subset invasion properties in 3D. Both CAF-S1 and CAF-S4
subsets were able to form spheroids in hanging drops and to
invade the surrounding matrix but CAF-S1 were more efficient in
invading than CAF-S4 (Fig.
4
d). Interestingly, on time-lapse
video microscopy (Supplementary Movies), we observed that
Fig. 1 Metastatic BC LNs exhibit four CAF subsets. a Representative FACS plots showing FAP, CD29, PDPN,αSMA and PDGFRβ protein levels in DAPI− EPCAM−CD45−CD31−CD235a−cells from a primary breast tumor (PT, left) and its corresponding metastatic axillary lymph node (LN, right). b, c FlowSom trees built on CAF from LNs (b, n = 20) and PTs (c, n = 16) and annotated for each CAF marker expression. Colors show CAF marker intensities. Node size depends on the number of phenotypically close cells.d Specific mean fluorescence intensity (speMFI) for each marker per CAF subset in PT and LN. Values are in log2 adjusted with offsets per marker. Each dot represents one sample (n ≥ 13 PT/LN pairs). Boxplots are median ± 25%–75% quantiles, whisker values range 1.5 × IQR above 75th or below 25th percentiles. p Values from Wilcoxon signed rank test. e Correlation plots between each marker speMFI in PT and LN, matched by patient and CAF subset (n ≥ 13 PT/LN pairs). p Values from Spearman’s test. f Same as in a for an invaded axillary LN (left) and its corresponding non-invaded LN (right).g Correlation plots between the percentage (%) of each CAF subset among total CAF and EPCAM+ cells among live cells, in invaded axillary LN (n = 19). p Values from Spearman’s test. Source data provided in Source Data file, with R scripts used.spheroids made by CAF-S4 pulled more efficiently on collagen
fibers than CAF-S1 (Fig.
4
e). To further quantify the traction
forces exerted by CAF on matrix, we performed traction force
microscopy (TFM). We observed that CAF-S1 were more
elon-gated compared to CAF-S4 that were larger (Fig.
4
f and
Supplementary Fig. 3f, h). Moreover, the strain energy (that
measures the energy spent to deform the substrate) developed by
CAF-S4 was more than twofold higher than that of CAF-S1
(Supplementary Fig. 3g). To take into account differences in
surface area between CAF-S1 and CAF-S4 (Supplementary
0 100 200 300 400 LumALumBHER2TNa
FAP CD29 PDGFRβ FSP1 Paired p = 0.005 N+ p = 1.5 × 10⁻⁴ p = 6.4 × 10N+ (LumA)–3 N+ (HER2)p = 0.75 p = 0.059N+ (TN)b
d
f
g
i
j
H−Score 100 200 300 400 LumALumBHER2 TN 100 200 300 400 LumALumBHER2 TN 0 100 200 300 LumALumBHER2 TN 100 200 300 400 LumALumBHER2 TN 2 × 10⁻³ 2 × 10⁻³ 5 × 10⁻⁵ 10–3 10–4 0.056 × 10⁻⁶ 3 × 10⁻⁷ 3 × 1 0–3 3 × 1 0–4 9 × 1 0–3 2 × 1 0–6 5 × 10⁻⁵ 0.02 0.03 CAF-S4 CAF-S3 CAF-S2 CAF-S1 PT LN % of patients 0 25 50 75 100 PT LN % of patients 0 25 50 75 100 PT LN % of patients 0 25 50 75 100 PT LN % of patients 0 25 50 75 100 PT LN % of patients 0 25 50 75 100 0 25 50 75LumA LumB HER2 TN
% stroma (LN)
1- If FAP H-Score ≥ Q3 then CAF-S1 enriched 2- Else
If (CD29 H-Score ≥ Q1 and FSP1 H-Score ≤ Mdn) then CAF-S4 enriched
3- Else
If (CD29 H-Score ≥ Q1 and CD29 H-Score ≤ Mdn) then CAF-S3 enriched
4- Else
If (CD29 H-Score ≥ Mdn) then CAF-S4 enriched 5- Else
If (CD29 H-Score ≤ Q1 and αSMA H-Score ≤ Q1) then CAF-S2 enriched
e
c
FAP CD29 PDGFRβ FSP1 αSMA αSMA 100 CAF-S4 CAF-S3 CAF-S2 CAF-S1 0 25 50 75 % of patients p = 0.001LumA LumB HER2 TN
1 1 3 16 1 0 1 2 0 0 0 0 4 6 10 23 6 7 14 41 11 0 0 3 14 p = 0.005 CD29 FAP FSP1 αSMA CAF-S4 Epithelial cells CAF-S1 CAF-S1-enriched LN CAF-S4-enriched LN
Map at cellular scale
LumA LumB HER2 TN LumB/HER2
h
200 µm 200 µm 200 µm 200 µm 200 µm 200 µm 200 µm 200 µm LN#1 LN#2PT-CAF-S2 PT-CAF-S3 PT-CAF-S4 LN-CAF-S1 LN-CAF-S2 LN-CAF-S3 LN-CAF-S4 PT-CAF-S1 TOTAL TOTAL
Fig. 2 Metastatic LNs are enriched in CAF-S1 and CAF-S4. a Percentage (%) of stroma in invaded LN according to BC subtypes (n = 124), LumA (violet), LumB (blue), HER2 (light gray), Lum B/HER2 (dark gray), TN (black).b Histological scores (H-Scores) for each CAF marker in invaded LN according to BC subtypes (n = 124). c Representative images of CAF marker staining on serial LN sections (LN#1 HER2; LN#2 TN). Scale bar, 50 μm. d Decision tree defining CAF subset identity based on quartile (Q) and median (Mdn) distribution of CAF markers. Thresholds and decision rules were first established on FACS data and next applied to IHC data.e Repartition of CAF subset enrichments (CAF-S1 (red), CAF-S2 (orange), CAF-S3 (green) and CAF-S4 (blue)) in LN according to BC subtypes (n = 124). f Representative views of CAF marker immunostaining on serial LN sections used for building maps of CAF subsets at cellular scale using the decision tree algorithm, shown ind. CAF-S1 are in red, CAF-S4 in blue and epithelial cells in black. CAF-S1- and CAF-S4-enriched LNs are shown. Scale bar, 200μm. g Repartition of CAF subset enrichments in PTs and matched LNs (n = 41 pairs). h Same as in g with unmatched samples (N+ cases, n = 75 PT and 84 LN). i Same as in h according to BC subtypes (Lum A: n = 38 PTs, 30 LNs; HER2: n = 16 PTs, 26 LNs; TN: n = 21 PTs, 28 LNs).j Contingency table showing repartition of CAF subset enrichments in PTs and corresponding invaded LNs (n = 41 pairs). In all panels, boxplots are median ± 25%–75% quantiles, whisker values range 1.5 × IQR above 75th or below 25th percentiles. b p Values from Mann–Whitney test. e, g, h p Values from Fisher’s exact test. Non-significant p values are not mentioned. Source data provided in Source Data file, with R scripts used.
−10 0 10 −30 −20 −10 0 10 20 PC1: 51 % variance PC2: 23 % variance Patient < −2 0 > 1.9
EPCAM+ CAF-S1 CAF-S4
PT LN Tissue Cell type Cell type Tissue
a
b
EPCAM+ EPCAM+ CAF-S1 CAF-S4 Cell type PT LN Tissue −10 0 10 −20 −10 0 10 20 PC1: 46 % variance PC2: 29 % variance −10 0 10 20 −20 −10 0 10 20 30 PC1: 49 % variance PC2: 18 % variance CAF-S1 −20 −10 0 10 −40 −30 −20 −10 0 10 PC1: 40 % variance PC2: 19 % variance CAF-S4 CAF-S4 LN PT Patient #08 #10 #11 #12 #13 −10 0 10 20 −10 0 10 20 30 PC2: 20 % variance PC1: 39 % variance Tissuec
CAF-S4 (PT) CAF-S1 (PT) CAF-S4 (LN) CAF-S1 (LN)d
p = 1 p = 1 p < 2.2 × 10–308 p < 2.2 × 10–308 CAF-S1 PT/LN CAF-S4 PT/LN 346 645 1670 179 577 1075 0 0 0 0 0 0 0 0 1 - Matrisome - Secreted factors - Muscle contraction - Actin-filament based processFig. 3 CAF subsets show same identity in PTs and metastatic LNs. a PCA based on the 500 most variant genes from RNAseq data of CAF-S1, CAF-S4 and EPCAM+cells sorted from paired PT and LN (n = 5 pairs for CAF-S1 and CAF-S4; n = 4 pairs for EPCAM+cells).b Hierarchical clustering on the same samples and same genes as ina using Ward’s method with Pearson distances. Rows represent samples and columns genes. Color saturation shows gene expression deviation from the mean (above in red, below in blue).c PCA based on the 500 most variant genes from RNAseq data of EPCAM+cells (n = 4 PT/LN pairs, top left), CAF-S1 (n = 5 PT/LN pairs, top right) and CAF-S4 (bottom left: n = 5 PT/LN pairs; bottom right: PCA restricted to n = 8 samples, as indicated).d Venn diagram showing overlaps between the transcriptomic signatures of CAF-S1 from PT, CAF-S1 from LN, CAF-S4 from PT and CAF-S4 from LN. Circled numbers show common genes between tissue localization for each cell type. p Values from hypergeometric test indicate significance of overlaps between subgroups. Source data provided in Source Datafile, with R scripts used.
Fig. 3h), we compared the strain energy densities (strain energy
normalized to the cell surface) and confirmed that CAF-S4
deployed more contractile energy per surface unit than CAF-S1
(Fig.
4
g). Similar results were obtained using mean traction stress
amplitude (mechanical forces cell develop per unit area to deform
the substrate; arrows Fig.
4
f, h). Collagen
fiber density was also
increased around CAF-S4 compared to CAF-S1 cells (Fig.
4
i),
which is consistent with CAF-S4 capacity to exert higher traction
forces on their environment, to pull and contract collagen
fibers.
Overall, these data demonstrate that CAF-S1 are motile, while
CAF-S4 are contractile with strong capacity to pull on collagen
fibers.
CAF-S1 and CAF-S4 promote tumor cell spread by distinct
mechanisms. While CAF function in metastases was investigated
in the past, the specific role of CAF subsets on metastatic spread
a
b
CAF-S1 CAF-S4c
CAF-S1 CAF-S4d
e
g
h
0.1 0.2 0.3 0.4 0.5 CAF–S1CAF–S4 Velocity (um/min) 0.0 0.2 0.4 0.6 0.8 CAF–S1CAF–S4 Directionaltiy (|sin(alpha)|) 0.25 0.50 CAF–S1CAF–S4 Persistence p = 0.04 p = 5 × 10⁻⁴ p = 4 × 10⁻⁴ p = 3 × 10⁻⁹p = 5 × 10⁻⁸ p = 2 × 10⁻⁸ p = 3 × 10⁻⁸ p = 8 × 10⁻⁵ p = 10–5 p = 4 × 10⁻⁷ p = 8 × 10⁻⁸ p = 4 × 10⁻⁶f
p = 0.01 p = 0.04 p = 0.04 p = 0.009 CAF-S1 CAF-S4 SHG F-actin 2.0 2.5 3.0 3.5 CAF–S1 CAF–S4Doubling time (days)
p = 0.03 25 50 75 100 CAF–S1 CAF–S4 Cells/mm 2 0 10 20 30 40 50 CAF−S1 CAF−S4 % contraction p = 0.02 10 20 30 40 50
CAF–S1CAF–S4 CAF–S1CAF–S4 CAF–S1CAF–S4
Invasion index 0 10 20 30 CAF–S1 CAF–S4 Invasion index
Strain energy density
(10
–4
J/m
2)
CAF–S1CAF–S4 CAF–S1CAF–S4 CAF–S1CAF–S4 0 1 2 CAF−S1 CAF−S4 2.5 5.0 7.5 10 0
CAF–S1CAF–S4 CAF–S1CAF–S4 CAF– S1 CAF–S4 100 200 300 400 500
Stress (Pa) Stress (Pa)
CAF–S1 CAF–S4 150 200 250 300 100
i
CAF-S1 CAF-S4 CAF-S1 CAF-S4 1000 Pa 1500 Pa 0.75 1.00 0 0.3 0.5 0.7 Collagen densityCAF–S1 CAF–S4 CAF–S1CAF–S4
p = 0.014 p = 0.0045
Strain energy density
(10
–5
J/m
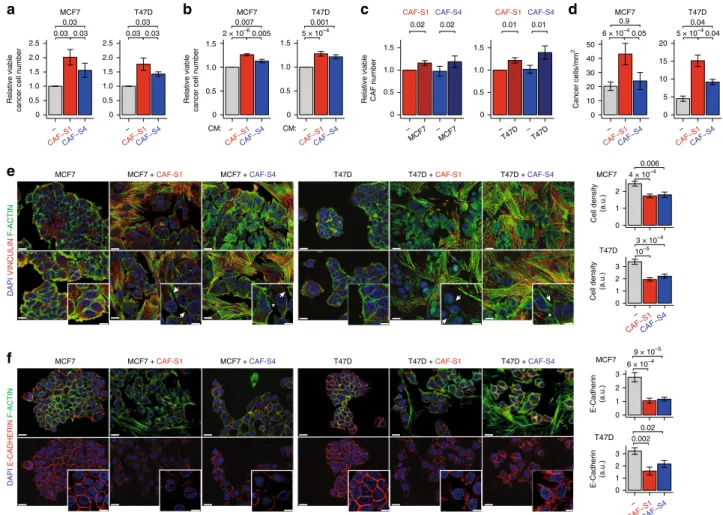
remains unknown. We assessed CAF-S1 and CAF-S4 effects on
BC cell properties by using MCF7 and T47D luminal cell lines, as
CAF switch between PTs and LNs was prominent in luminal
cases. Co-culture of BC cells with CAF-S1 or CAF-S4 increased
the number of tumor cells, with a stronger impact of CAF-S1
compared to CAF-S4 (Fig.
5
a). This effect was also detected with
CAF-S1- or CAF-S4-conditioned medium (CM), although at a
lower extent (Fig.
5
b). CAF subset proliferation increased at long
time points of co-culture with cancer cells (Fig.
5
c), but not at
short term (Supplementary Fig. 4a). Transwell assays showed that
BC cell migration was strongly increased toward CAF-S1, but at a
much lower extent toward CAF-S4 (Fig.
5
d). The
CAF-S1-pro-migratory effect was independent of its pro-proliferative effect,
while the slight impact of CAF-S4 was proliferation-driven
(Supplementary Fig. 4b). In agreement with their intrinsic
fea-tures (Fig.
4
), CAF-S4
fibroblasts (easily distinguished from
cancer cells by F-actin staining) exhibited more F-actin stress
fibers and Vinculin-stained focal adhesions than CAF-S1 (Fig.
5
e
and Supplementary Fig. 4c for quantification). Interestingly, in
presence of CAF-S1 or CAF-S4, cancer cells were more scattered
(Fig.
5
e and Supplementary Fig. 4c). Indeed, in presence of
CAF-S1, BC cells were less cohesive and more dispersed. With CAF-S4,
cancer cells were also less packed but with numerous remaining
F-actin interconnections. In agreement with these observations,
E-cadherin/CDH1 protein levels decreased at cancer cell
mem-brane in presence of CAF-S1, effect which was also visible but less
pronounced with CAF-S4 (Fig.
5
f and Supplementary Fig. 4d).
Thus, these results suggest that CAF-S1–and to a lower extent
CAF-S4—promote cancer cell spreading by initiating first steps of
EMT.
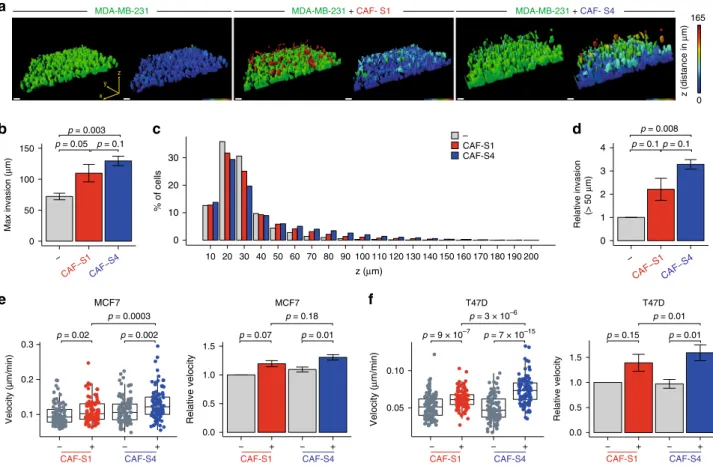
As CAF-S4 properties were linked to 3D environments, we
moved to such systems to analyze their impact on BC cell
invasiveness in surrounding matrix. We
first used an inverted
Transwell assay to test CAF subset-mediated matrix remodeling
on BC cell invasion (Fig.
6
a–f). In this assay, cancer cells need to
cross the membrane to invade the matrix. MCF7 and T47D cells
are not invasive enough to obtain quantifiable results, we thus
chose to work with MDA-MB-231, a TN invasive cell line. The
highest z-distance covered by cancer cells in the matrix was
significantly increased in CAF-S1- and even more in
CAF-S4-embedded collagen (Fig.
6
a, b). If cancer cells browsed in average
72
μm above the membrane in a CAF-free matrix, they reached
109
μm in presence of CAF-S1 and 129 μm with CAF-S4 (Fig.
6
b).
We next looked at the average distribution of cancer cell
frequency along z-axis, every 10
μm from the membrane up to
200
μm. Major part of cancer cells was below 30 μm, distance
from which a major drop was observed (Fig.
6
c). Interestingly,
beyond 30
μm, CAF-S4 significantly increased the proportion of
cancer cells compared to control (Supplementary Fig. 4e, left).
Similar results were obtained when increasing the invasion
threshold, with an even greater impact of CAF-S4 on tumor cell
invasion (Fig.
6
d and Supplementary Fig. 4e, right). To go deeper
in the characterization of BC cell motility in 3D, we took
advantage of the tumor-on-chip system
42, a microfluidic device
where cancer cells and CAF subsets were co-cultured in 3D and
followed by time-lapse video microscopy. In this system, we
reproduced the intrinsic CAF subset motility, CAF-S1 being more
motile than CAF-S4 (Supplementary Fig. 4f). In addition, velocity
of GFP-labeled BC cells increased in presence of CAF-S4, and at a
lower extent CAF-S1 (Fig.
6
e, f). In tumor-on-chip, CAF
subset-mediated effect was more important on T47D (Fig.
6
f) than
MCF7 (Fig.
6
e), probably because T47D cells are less motile at
basal levels than MCF7 (around 0.1
μm/min for MCF7 and 0.05
μm/min for T47D). Taken together, these results show that both
CAF-S1 and CAF-S4 stimulate BC cell motility, via different
effects: CAF-S1 initiate
first steps of EMT and secrete factors that
attract cancer cells, while CAF-S4 remodel the matrix and
promote cancer cell invasion in 3D.
CAF-S1 and CAF-S4 induce cancer cell invasion by TGFβ/
CXCL12 and NOTCH. We next sought to define the molecular
actors involved in CAF-S1 and CAF-S4 pro-invasive effects. As
CAF-S1 attract cancer cell at distance and secrete high levels of
CXCL12 (Supplementary Fig. 5a), we
first analyzed the impact of
CXCL12 silencing in CAF-S1 and CAF-S4 (Supplementary
Fig. 5b) on BC cell proliferation and migration. Interestingly,
CAF-S1 silenced for CXCL12 partly lost their ability to initiate
EMT in cancer cells, while CXCL12-silencing had no impact in
CAF-S4 (Fig.
7
a). Indeed, BC cells were more clustered and
E-cadherin
protein
levels
in
tumor
cells
increased
after
CXCL12 silencing in CAF-S1 but not in CAF-S4 (Fig.
7
a and
Supplementary Fig. 5c). We also observed that CXCL12-silencing
in CAF-S1 decreased BC cell chemo-attraction without affecting
their proliferation rate (Supplementary Fig. 5d, e). In agreement
with these observations, even partial inhibition of CXCR4 in
cancer cells (Supplementary Fig. 5f) affected their scattering and
EMT initiation by CAF-S1 (Fig.
7
b). This suggests that both
CXCL12 secretion by CAF-S1 and CXCR4 expression in cancer
cells are involved in CAF-S1-mediated EMT initiation in BC cells.
As we observed an upregulation of the TGFβ-signaling pathway
in CAF-S1 (Supplementary Fig. 5g), we wondered whether this
pathway, strong EMT inducer, could also be involved in
CAF-S1-mediated EMT initiation. As the expression of TGFβ receptors
(TGFBR1, 2 and 3) was upregulated in CAF-S1 cells compared to
CAF-S4 (Supplementary Fig. 5h), we compared the impact of
TGFBR inhibitor on CAF-S1- and CAF-S4-induced EMT
initia-tion on cancer cells (Fig.
7
c and Supplementary Fig. 5i). TGFBR
inhibition affected initiation of EMT in cancer cells in presence of
Fig. 4 CAF-S1 and CAF-S4 exhibit distinct functional features. a CAF-S1 (red) and CAF-S4 (blue) doubling time (n = 6). b Left, Transwell membrane underside images. Scale bar, 200μm. Right, CAF-S1/-S4 migration capacity (cells/mm2) (n = 6). c CAF-S1/-S4 velocity, persistence and direction (|sin(α)|, assessed by cell exclusion assay. d Left, Images of CAF-S1/-S4 spheroids embedded into collagen. Scale bar, 200 μm. Middle, CAF-S1/-S4 invaded areas/core spheroid areas. Each dot is one spheroid (n ≥ 6 per CAF subset). Right, Same as Middle for median values per CAF subset. e Left, Images of collagen-gel contraction by CAF-S1/-S4. Scale bar, 2 mm. Right, Percentage of collagen contraction by CAF-S1/-S4 (n = 6). f–h Contractility of CAF-S1/-S4 by traction force microscopy.f Images of traction stress applied by CAF-S1/-S4 on substrate. Traction forces (arrows) and cellular outlines (dashed lines) shown. Scale bar, 20μm. Traction stress magnitudes in Pascal (Pa). g Left, CAF-S1/-S4 strain energy density (Joules (J)/m2). Each dot is one cell (n ≥
21 cells/CAF subset). Right, Same as left for median strain energy densities per CAF subset (n = 3). h Left, CAF-S1/-S4 traction stress. Right, Same as left for median traction stress per CAF subset (n = 3). i Left, Images of collagen (blue) by CAF-S1/-S4 (red) assessed by second harmonic generation. Scale bar, 20μm. Right, Collagen density in each cell stack. Each dot is the average value of collagen density around one cell (n ≥ 10 cells per CAF subset) (n = 2). In all panels, boxplots are median ± 25%–75% quantiles, whisker values range 1.5 × IQR above 75th or below 25th percentiles. a, b, e right, g right, h right: p Value from paired t-test. c, g left: p Values from Mann–Whitney test. d middle, h left, i right for two first CAF pairs: p Values from Mann–Whitney test (1st pair) and Student’s t-test (2nd pair). d right: p Value from Student’s t-test. At least three CAF-S1/-S4 pairs tested, except in c/i, two pairs. Source data provided in Source Datafile, with R scripts used.
CAF-S1 cells, while it had no impact on cancer cells alone and a
weak effect with CAF-S4 (Fig.
7
c). Taken together, these results
show the role of TGFβ and CXCL12 signaling pathways in
CAF-S1-dependent pro-tumorigenic phenotype.
Concerning CAF-S4, NOTCH pathway and three out of the
four NOTCH receptors (NOTCH 1–3) were significantly
upregulated in CAF-S4 (Supplementary Fig. 6a, b). We observed
that DAPT, a
γ-secretase inhibitor and pan-NOTCH inhibitor,
severely reduced CAF-S4 contractile capacity assessed in collagen
gel assays, while DAPT had no impact on CAF-S1
fibroblasts
(Fig.
7
d). Due to this strong effect of NOTCH inhibition on
CAF-S4 contractility, we next analyzed in-depth the effect of NOTCH
on CAF-S4. We verified that DAPT had no effect on CAF-S4
viability (Supplementary Fig. 6c). As expected, Blebbistatin and
Y27632, potent myosin and ROCK inhibitors used as positive
controls, also abolished CAF-S4 contraction (Supplementary
Fig. 6d). Using TFM, we confirmed that DAPT treatment also
diminished the Strain Energy Density globally exerted by CAF-S4
cells (Fig.
7
e), although it did not significantly affect the
magnitude of the stress which averages the local traction forces
(Fig. S6e). Moreover, the inverted Transwell invasion assay
confirmed the role of NOTCH in CAF-S4-mediated BC cell
invasion. Indeed, both the maximal distance reached and the
percentage of invading tumor cells were reduced by NOTCH
inhibition in CAF-S4-embedded matrix (Fig.
7
f, h), while it had
no or much lower impact without CAF-S4 (Supplementary
Fig. 6f, g). Finally, using tumor-on-chip devices, we further
showed that, although cancer cell motility was not affected by
DAPT treatment in absence of CAF-S4, CAF-S4 were completely
unable to induce BC cell invasion in presence of DAPT (Fig.
7
i, j).
Altogether, these data demonstrate that NOTCH signaling in
CAF-S4 is essential to remodel the matrix and promote BC cell
invasion in 3D. Finally, by using a cytokine array, we verified that
the release of other chemokines and interleukins, such as IL6, IL8,
CCL2, CCL5, known to be involved in crosstalk between CAF and
cancer cells, was not statistically different between CAF-S1 and
e
f
MCF7 MCF7 +CAF-S1 MCF7 +CAF-S4 DAPI VINCULIN F-ACTIN DAPI E-CADHERIN F-ACTIN T47D T47D +CAF-S1 T47D +CAF-S4 − CAF−S1CAF−S4 0 0.5 1.0 1.5 2.0 2.5 − CAF−S1CAF−S4 0 0.5 1.0 1.5 2.0 2.5 – MCF7 – MCF7 0 0.5 1.0 1.5 0 0.5 1.0 1.5 – – T47D T47D – CAF−S1CAF−S4 20 15 10 5 0 – CAF−S1CAF−S4 50 40 30 20 10 0a
MCF7 0.03 0.03 0.03 MCF7 0.007c
0.001 T47D 0.03 0.03 0.03 T47D CAF-S1 0.02 CAF-S4 0.02 CAF-S1 0.01 CAF-S4 0.01 MCF7 T47D 5 × 10⁻⁴ 0.04 6 × 10⁻⁴ 0.05 2 × 10⁻⁶ 0.005 5 × 10⁻⁴ 4 × 10⁻⁴ 3 × 10⁻⁴ 9 × 10⁻⁵ 6 × 10⁻⁴ 10–5 0.04b
d
0 0.5 1.0 1.5 − CAF−S1CAF−S4 0 0.5 1.0 1.5 − CAF−S1CAF−S4MCF7 MCF7 +CAF-S1 MCF7 +CAF-S4 T47D T47D +CAF-S1 T47D +CAF-S4
E-Cadherin (a.u.) 0.002 0.02 MCF7 T47D E-Cadherin (a.u.) 0 1 2 3 0 1 2 − CAF−S1CAF−S4 − CAF−S1CAF−S4 0 1 2 3 Cell density (a.u.) Cell density (a.u.) 0.006 MCF7 T47D Relative viable
cancer cell number
Relative viable
cancer cell number
Relative viable CAF number
Cancer cells/mm 2 CM: CM: 0 1 2 3 0.9 * *
Fig. 5 CAF-S1 promote proliferation and initiate cancer cell epithelial-to-mesenchymal transition. a Total number of viable BC cells (Dapi−cells by FACS) in co-culture with CAF-S1 (red) or CAF-S4 (blue) relative to control (− gray, without CAF) (n = 6 per BC cell type). b Total number of viable BC cells (Resazurin staining) with CAF-S1- or CAF-S4-conditioned medium (CM) relative to control (−, without CM) (n = 9 per BC cell type). c Total number of viable CAF-S1 (red) and CAF-S4 (blue) (Dapi−cells by FACS) in co-culture with BC cells relative to control (−, without BC cells) (n ≥ 6 per BC cell type).d CAF-S1 and CAF-S4 capacities to attract BC cells (n ≥ 8 per BC cells). e Left, Images of co-staining of Vinculin (red), F-actin (green) and DAPI (blue) in MCF7 (left) or T47D (right) cultured alone, or in presence of CAF-S1 or CAF-S4. Scale bars, 20μm; inset, 10 μm. Arrows show reduced BC cell cohesion in presence of CAF-S1/-S4; asterisks show F-actin interconnections between BC cells in presence of CAF-S4. Vinculin and F-actin individual staining in Supplementary Fig. 4c. Right, Number of BC cells per tumor area (at least 13 images per condition, n = 3 per BC cell type). f Left, Images of E-cadherin (red), F-actin (green) and DAPI (blue) co-staining (top) or of E-E-cadherin (red) and DAPI (blue) staining (bottom) in BC cells alone or in presence of CAF-S1/-S4. Scale bars, 20μm; inset, 10 μm. Right, Quantification of E-cadherin staining per BC cell area (at least eight images per condition) (n = 2 per BC cell type). In all panels, barplots are mean ± SEM and n number of independent experiments; a. u., arbitrary units. a, d: p Values from Wilcoxon signed rank test.b, c: p Values from paired t-test. e right, f right: p Values from Student’s t-test (MCF7) and Mann–Whitney test (T47D). At least two CAF-S1 and CAF-S4 pairs tested, except ine, f for T47D, where one CAF-S1/-S4 pair is used. Source data provided in Source Datafile, with R scripts used.
CAF-S4 (Supplementary Fig. 6i, j). In conclusion, CAF-S1
fibroblasts promote BC cell migration and EMT initiation in
cancer cells in a CXCL12- and TGFβ-dependent manner. In
addition, CAF-S4
fibroblasts stimulate cancer cell invasion and
motility in 3D by increasing contractility through the NOTCH
signaling pathway.
CAF-S4-enriched LNs are associated with poor patient survival.
We
finally investigate the clinical relevance of our findings. We
analyzed the impact of global stroma content and CAF subset
enrichment in LN on disease-free survival, i.e. survival without
local, regional or distant relapse (Fig.
8
a and Table
1
). As CAF-S1
are able to initiate EMT, we quantified the percentage of stromal
and epithelial compartments in LNs. High content in stroma in
LNs was associated with a shorter disease-free survival, with a
similar tendency for overall survival (p
= 0.06 by Log Rank test
and p
= 0.07 by Cox regression model) (Fig.
8
a, b and Table
1
).
Using multivariate Cox regression analysis with additive model,
we observed that the stromal content was independent of BC
subtypes and LN status at diagnosis, two well-established
inde-pendent prognostic parameters (Table
1
). As invaded LNs are
mainly composed of CAF-S1 or CAF-S4 (Fig.
2
), these results
suggested that both CAF subsets, when present in high quantity
in invaded LNs at diagnosis, might be deleterious for patient
survival. We found that CAF subsets on their own exhibited a
faint but significant prognostic value, in particular when patients
were stratified according to their stromal content in LNs (Fig.
8
c
and Supplementary Table 6). Indeed, among patients who
dis-played high stromal content in LNs at diagnosis, those enriched
in CAF-S4 showed the poorest overall survival, while no
differ-ence according to CAF subset was observed in the context of low
stromal content (Fig.
8
c). Of note, the prognostic value of CAF
subset content in LNs is interesting–although faint—as it is not
observed in PT
32,33. Considering that CAF-S1 and CAF-S4
enhance BC cell invasive capacities and that most BC patients
decease from metastases, we next looked at distant metastases
developed after diagnosis. In line with our results, patients who
developed such metastases were mainly patients with
CAF-abundant LNs at diagnosis, with a similar repartition in BC
subtype (Fig.
8
d). The impact on distant metastatic spread was
even stronger in CAF-S4- than in CAF-S1-enriched LN patients,
effect detected in all BC subtypes (Fig.
8
e). Overall, patients who
showed LNs with high stromal content and specific enrichment in
CAF-S4 were more prone to develop late distant metastases than
any other patients, in particular in liver (Fig.
8
f, g). Although
metastatic sites vary according to BC subtypes with bone as the
0 1 2 3 4 − CAF−S1CAF−S4 0 50 100 150 − CAF−S1CAF−S4 Max invasion ( μ m) 0 10 20 30 % of cells CAF-S1 CAF-S4 – z (μm) Relative invasion (> 50 μ m)
b
c
d
p = 0.05 p = 0.003 p = 0.1 p = 0.1 p = 0.008 p = 0.1 10 20 30 40 50 60 70 80 90 100 110 120 130 140 150 160 170 180 190 200 z x ya
165 0 z (distance in μ m)e
f
p = 0.15 p = 0.01 p = 0.01 p = 9 × 10⁻⁷ p = 7 × 10–15 p = 3 × 10⁻⁶ − − CAF-S1 + CAF-S4 + Relative velocity 0.0 0.5 1.0 1.5 0.05 0.10 Velocity ( μ m/min) − − CAF-S1 + CAF-S4 + 0.1 0.2 0.3 Velocity (µm/min) − − CAF-S1 + CAF-S4 + p = 0.02 p = 0.002 p = 0.0003 0.0 0.5 1.0 1.5 Relative velocity − − CAF-S1 + CAF-S4 + p = 0.07 p = 0.18 p = 0.01 T47D T47D MCF7 MCF7MDA-MB-231 MDA-MB-231 + CAF- S1 MDA-MB-231 + CAF- S4
Fig. 6 S4 promote tumor cell invasion in 3D. a Representative 3D views of MDA-MB-231 invasion assessed by inverted Transwell assays, in CAF-free (left), CAF-S1- (middle) or CAF-S4- (right) embedded collagen matrix. In left images in each condition, colors show the different cell types: BC cells in green; CAF-S1 in red; CAF-S4 in blue. In right images in each condition, colors indicate the distance browsed by BC cells on the vertical (z) axis in 3D (maximal distance 165μm in red). Scale bar, 50 μm. b Maximal vertical distance browsed by BC cells in CAF-free, CAF-S1- or CAF-S4-embedded collagen (n = 3, ~500 BC cells per analyzed z-stack). c Mean frequency (%) of BC cells along vertical axis (z, μm) in CAF-free, CAF-S1- or CAF-S4-embedded collagen.d Proportion of BC cells that invaded above 50μm in CAF-S1- or CAF-S4-embedded collagen, relative to CAF-free condition (n = 3, ~500 BC cells per analyzed z-stack). e Left, Representative tumor-on-chip experiment showing velocity of MCF7 in CAF-free, CAF-S1- or CAF-S4-embedded collagen. Each dot represents one cell (n ≥ 90 cells per condition). Right, Median velocity of MCF7 in S1- or S4-embedded collagen matrix relative to CAF-free condition (n = 3). f Same as in e for T47D. In all panels, barplots are mean ± SEM. Boxplots are median ± 25%–75% quantiles, whisker values range 1.5 × IQR above 75th or below 25th percentiles; n indicates number of independent experiments. b, d, e right: p Values from paired t-test. e left: p Values from Mann–Whitney test. At least two CAF-S1 and CAF-S4 pairs have been tested. Source data provided in Source Data file, with R scripts used.
most common site except in TN BC associated with other niches,
such as liver
1,2, CAF-S4 impact was not associated to a specific
BC subtype. Indeed, among all patients displaying late liver
metastasis, only one patient (6%) presented HER2 overexpression
at diagnosis. Moreover, CAF-S4-enriched metastatic patients
were numerous both within Lum and TN BC subtypes (Fig.
8
g).
We even detected a higher proportion of patients categorized as
CAF-S4-enriched with high stromal content in LNs in the Lum
BC subtype compared to TN BC patients (60% Lum versus 33%
TN). Thus, patients with high-CAF-S4 content in LNs, who
a
b
c
LY2109761 – LY2109761 DAPI E-CADHERIN F-ACTIN DAPI E-CADHERIN F-ACTIN+ CAF-S1 siCTL + CAF-S1 siCXCL12
DAPI E-CADHERIN F-ACTIN MCF7 – T47D MCF7 T47D
+ CAF-S1 siCTL + CAF-S1 siCXCL12 – MCF7 T47D – + CAF-S1 LY2109761 – LY2109761 – + CAF-S1 Velocity ( μ m/min) 0.00 0.05 0.10 0.15 0.20 – CAF-S4 – CAF-S4 – DAPT p = 7 × 10–13 p = 0.5 1.5 0.0 0.5 1.0 Relative velocity – CAF-S4 – CAF-S4 – DAPT p =0.04 p = 0.01 T47D T47D 0.0 0.1 0.2 – CAF-S4 – CAF-S4 – DAPT Velocity ( μ m/min) 0.0 0.5 1.0 – CAF-S4 – CAF-S4 – DAPT Relative velocity p = 0.001 p = 0.4 p = 0.003 p = 0.04 MCF7 MCF7
j
0 1 2 3 p = 0.01 A B C D 0 1 2 p = 0.05 A B C D A: siCTL B: siCXCR4 C: siCTL + CAF-S1 D: siCXCR4 + CAF-S1 A: – B: LY C: – + CAF-S1 D: LY + CAF-S1 E: – + CAF-S4 F: LY + CAF-S4 0 1 2 3 A B C D 0 1 2 3 4 A B C De
p = 0.03d
Strain energy density
(10 –5 J/m 2) 0 5 10 15 20 DMSO DAPT
f
i
siCTL siCXCR4 siCTL+ CAF-S1 siCXCR4+ CAF-S1
A: – B: + CAF-S1 siCTL C: + CAF-S1 siCXCL12 MCF7 cell density (a.u.) T47D Cell density (a.u.) 180 0 z (distance in μ m) MDA-MB-231 + CAF- S4 DMSO DAPT –30 –20 –10 0 10 0.00 0.25 0.50 0.75 1.00 DMSO DAPT + CAF-S4 DMSO DAPT Relative invasion (>50 μ m) Δ z max invasion ( μ m) p = 0.01 p = 0.003 MCF7 E-Cadherin (a.u.) T47D E-Cadherin (a.u.) + CAF-S4
g
h
siCTL siCXCR4 siCTL+ CAF-S1 siCXCR4+ CAF-S1
DMSO DAPT DMSO DAPT + CAF-S1 + CAF-S4
Contraction (%) p = 0.8 p = 0.0021
MCF7
Cell density (a.u.)
A B C D E p = 0.7 0 1 2 3 4 MCF7 E-Cadherin (a.u.) p = 0.0008 p = 0.7 A B C D E 0 1 2 3 4 p = 0.8 A B C D E T47D
cell density (a.u.) 0
1 2 3 4 p = 0.0013 p = 0.8 A B C D E T47D E-cadherin (a.u.) 0 1 2 3 4 D: + CAF-S4 siCTL E: + CAF-S4 siCXCL12 A B C D E F 4 3 2 1 0 0.006 MCF7
cell density (a.u.)
A B C D E F 4 3 2 1 0 0.001 MCF7 E-Cadherin (a.u.) A B C D E F 4 3 2 1 0 0.06 T47D
cell density (a.u.)
A B C D E F 3 2 1 0 0.0029 0.42 T47D E-cadherin (a.u.) p = 0.0012 0 10 20 30 40 50 p = 3 × 10⁻⁹ p = 8.5 × 10⁻⁹ p = 10–7 p = 6 × 10⁻⁵ p = 2.6 × 10⁻⁹ p = 10–7 p = 2.2 × 10⁻¹⁶
tended to metastasize into liver, were not enriched in TN BC
subtype in the cohort analyzed. The impact of CAF subset on
metastatic spread was thus not related to a bias linked to BC
subtype. On the whole, these data highlight the role of CAF-S1
and particularly CAF-S4 subsets in human BC relapse and
metastases (see Model Fig.
8
h).
Discussion
Although the role of CAF in metastatic spread is well established,
when analyzed as a global population
9,12,14,18,20,43, we address
here the link between CAF subsets and BC cell spread. Axillary
metastatic LN exhibit four CAF subsets (CAF-S1 to S4) but are
highly enriched in
αSMA+ CAF-S1 and CAF-S4 subsets. The
abundance of
αSMA+ CAF at PT has been associated with poor
prognosis in BC
17,44–48. In agreement with our
findings, a recent
study reported that the global stromal content in metastatic LN
provides a prognostic stratification of BC patients
49. We go a step
further by differentiating CAF-S1 and CAF-S4 and by showing
that the CAF-S1/CAF-S4 status in LNs exhibits a prognostic
value, while this is not the case when considering CAF subset
enrichment in PT
9,12,14,18,20,43. This underlines the relevance of
our study in BC pathology and indicates that assessing the
con-tent in CAF-S1 and CAF-S4 subsets in LNs might be helpful for
clinical diagnosis.
Both CAF-S1 and CAF-S4 subsets exhibit pro-invasive
prop-erties yet with distinct modes of action. CAF-S1 enhance tumor
cell migration and EMT initiation, while CAF-S4 favor cancer cell
invasion and motility in 3D. Although the impact of CAF in
metastatic spread has been previously demonstrated
50–53, we
show here the complementary role of two distinct CAF
sub-populations in metastases. We identify a crosstalk between
CAF-S1 and cancer cells involving both CXCL12 and TGFβ, consistent
with data showing that CAFs secrete CXCL12 and promote
cancer cell migration
16,17,54–58. In addition, we highlight the role
of TGFβ, a well-known EMT inducer
4,59,60and an important
player in
fibroblast activation
50,61–63. Both CXCL12 and TGFβ
expression are found in BC metastatic sites, in particular lung and
bones, supporting they are particularly relevant in BC. In contrast
to CAF-S1, CAF-S4 are highly contractile and exert a pro-invasive
effect on cancer cells. Although mechanisms linking CAF
con-tractility to cancer cell invasion have been described
22,25,64,65, we
unveil here the NOTCH pathway as a key player. NOTCH
pathway has been studied in cancer with a strong focus on cancer
cells
66–68. Our data show that NOTCH exerts a key role in
CAF-S4 contractility and its pro-invasive action in BC. Thus, we report
specific CAF-S1 and CAF-S4-mediated processes and
mechan-isms that promote metastatic spread in BC.
The four CAF subsets we identified in LN mirror CAF
sub-populations in PTs
32,33. This is consistent with studies showing
that LN stroma mimics PT microenvironment
28,30. But, our
results provide new insights. Indeed, if the four CAF subsets are
detected in both PT and LN, their abundance strikingly differs.
Compared to PT, LNs are almost exclusively enriched in activated
CAF-S1 and CAF-S4. The transcriptomic signatures of CAF
subsets from LN validated molecular similarities between CAF-S1
(or CAF-S4) from PT and LN. If few studies addressed CAF
transcriptomic profiles in both PTs and LNs from BC
patients
37,69, a short gene list identified in ref.
37allows to
dis-criminate LN from PT bulk samples. Interestingly, most of these
genes are highly detected in CAF-S4, consistent with their
abundance in metastatic LNs. Although CAF origin remains an
open question, CAF-S1 and CAF-S4 transcriptomic profiles
generated from PT and LN indicate that subset identity is similar
between the two tissues. A recent study identified nine stromal
populations by single-cell RNAseq in mouse LN, including the
established FRCs, FDC and perivascular cells
70. Although these
cells were identified in non-cancerous mouse lymphoid tissues,
CAF-S1 are close to CD34+ stromal cells and CAF-S4 to
peri-vascular cells. Our data on CAF-S4 are consistent with previous
studies showing the existence of pericyte-like CAF and their
potential pericytes-derived origin
32,38–41. Thus, CAF subsets in
invaded LNs could derive from different resident mesenchymal
cells. In conclusion, by combining the study of BC patient
sam-ples and performing functional assays on human CAF subset
cultures, we demonstrate that CAF subsets exhibit distinct
func-tions in metastatic spread. Considering the deleterious effect of
metastases on BC patients’ survival, our data might strengthen
the interest in assessing CAF subsets content in LN for clinical
diagnosis and in using anti-TGFβ and/or anti-NOTCH
therapies in BC.
Methods
Cohorts of BC patients. The projects developed here are based on surgical resi-dues, available after histopathological analyses, and not required for diagnosis. There is no interference with clinical practice. Analysis of PT and metastatic LN samples was performed according to the relevant national law on the protection of people taking part in biomedical research. All patients included in our study were informed by their referring oncologist that their biological samples could be used for research purposes and they gave their verbal informed consent. In case of patient refusal, that could be either orally expressed or written, residual tumor samples were not included in our study. Human experimental procedures were approved by the Institutional Review Board and Ethics committee (CRI) of the Institut Curie Hospital group (approval 12 February 2014) and CNIL (Commission Nationale de l’informatique et des Libertés) (No. approval: 1674356 delivered 30 March 2013). HER2-amplified carcinomas have been defined according to ERBB2 immunostaining using ASCO’s guideline. Luminal (Lum) tumors were defined by positive immunostaining for ER (estrogen receptor) and/or PR (progesterone receptor). The cut-off used to define hormone receptor positivity was 10% of stained cells. Ki67 (proliferation) score further distinguishes Lum A from Lum B tumors (below 15%: Lum A, above: Lum B). TN immunophenotype was defined as Fig. 7 CAF-S1 and CAF-S4 promote cancer cell invasion by TGFβ, CXCL12 and NOTCH. a Up, Representative images of E-cadherin (red), F-actin (green) and DAPI (blue) in BC cells alone (−) or with CAF-S1 transfected with non-targeting (siCTL) or CXCL12-targeting (siCXCL12) siRNA. CAF-S4 images in Supplementary Fig. 5c. Scale bars, 20μm; inset 10 μm. Down, BC cell density and E-cadherin staining alone (gray) or with CAF (CAF-S1 red; CAF-S4 blue) (≥12 images/condition; n = 8). b Same as a with siCTL- or siCXCR4-transfected BC cells, with/without CAF-S1 (red/gray) (≥8 images/condition; n = 4). c Same as a with/without CAF-S1 with/without TGFβ-R inhibitor (LY2109761). CAF-S4 images in Supplementary Fig. 5e. Quantifications without (gray) or with CAF (CAF-S1 red; CAF-S4 blue) (≥7 images/condition; MCF7: n = 7; T47D: n = 3). d Percentage (%) of collagen contraction by CAF-S4 (blue) or CAF-S1 (red) without (DMSO) or with DAPT (n ≥ 3). e Strain energy density of CAF-S4 without (DMSO, blue) or with DAPT (gray). Each dot is one cell, n ≥ 46 cells/condition. f Representative 3D views of MDA-MB-231 (green) invasion by inverted Transwell assays in CAF-S4 (blue)-embedded collagen matrix without (DMSO) or with DAPT. Colors indicate distance browsed by BC cells on z axis (dmax180μm, red). Scale bar, 50 μm. g Maximal distance of
BC cells in CAF-S4-embedded collagen with DAPT relative to control (DMSO) (n = 6, ~700 BC cells/z-stack). h Same as in g for proportion of BC cells that invaded above 50μm. i Left, Velocity of MCF7 in tumor-on-chip in CAF-free (−, gray) or CAF-S4 (blue)-embedded collagen treated or not with DAPT. Each dot is one cell, n ≥ 95/condition. Right, Same as left for median velocity of MCF7 (n = 3). j Same as i for T47D. In all panels, boxplots are median ± 25%–75% quantiles, whisker values range 1.5 × IQR above 75th or below 25th percentiles. Barplots mean ± SEM. a–e p Values from Mann–Whitney test. g–i p Values from paired t-test. At least four CAF-S1 and CAF-S4 tested. Source data provided in Source Data file, with R scripts used.
follows: ER−PR−ERBB2−with the expression of at least one of the following markers: KRT5/6+or EGF-R+.
BC PTs and metastatic LNs from prospective cohorts were collected as part of routine standard of care and included in this study after evaluation by a pathologist. CAF subsets were analyzed from fresh PT and LN samples by FACS (16 PTs and 20 LN), RNA sequencing (5 PTs and their corresponding LN), and cultured in vitro (14 PT and 8 LN). Prospective cohorts mainly include Lum subtypes.
PT (up to 75) and LN samples (up to 124) from retrospective cohorts of BC patients suffering from invasive BC cancers with at least one metastatic LN at diagnosis, have been collected as part of routine standard of care and analyzed by IHC. Retrospective cohorts include Lum, HER2 and TN subtypes. IHC were performed on residual surgery samples prior to any treatment (i.e. prior to radiation, hormonal or chemo-therapy). Overall survival and disease-free survival have been defined as followed: overall survival is defined as the period of time going
h
PT LN CAF in PT CAF in LN CAF-S1 CAF-S2 CAF-S3 CAF-S4 LN at diagnosis: Low CAF quantityLate distant metastases
LN at diagnosis: High CAF quantity CAF-S1 or CAF-S4 Bone Lung Liver Brain LN at diagnosis: High CAF quantity
CAF-S4 enriched
Bone Lung
Liver Brain
Late distant metastases Late distant metastases
a
b
c
Years Disease-free survival 0 20 40 60 80 100 Years 0 20 40 60 80 100 % survival Overall survivalCAF-S1 enriched, low % stroma CAF-S4 enriched, low % stroma CAF-S1 enriched, high % stroma CAF-S4 enriched, high % stroma
0 2 4 6 8 10 12 p = 0.04 0 2 4 6 8 10 12 p = 0.05 Low % stroma High % stroma % survival Overall survival Years 0 2 4 6 8 10 12 0 20 40 60 80 100 % survival p = 0.06 Low % stroma High % stroma
With distant metastases other than liver With liver metastases Low % stroma High % stroma
CAF-S1 enriched, low % stroma CAF-S4 enriched, low % stroma CAF-S1 enriched, high % stroma CAF-S4 enriched, high % stroma All BC Lum HER2 TN All BC Lum HER2 TN % patients
d
e
f
All BC p = 0.08 0.0 5.0 10.0 Lum Count (patients) 0.0 5.0 10.0 HER2 0.0 5.0 10.0 TNg
All BC p = 0.04 Lum HER2 TN 0 5 10 15 0 5 10 15 0 5 10 15With distant metastases other than liver With liver metastases
M0 M1 M0 M1
M0 M1 M0 M1 M0 M1
CAF-S1CAF-S4CAF-S1CAF-S4
CAF-S1 CAF-S1CAF-S4 CAF-S4 CAF-S1 CAF-S1CAF-S4 CAF-S4 CAF-S1 CAF-S1CAF-S4 CAF-S4
Low % stroma
High % stroma
CAF-S1CAF-S4
CAF-S1CAF-S4 CAF-S1CAF-S4 CAF-S1CAF-S4
Low % stroma
Count (patients) Count (patients)
0 25 50 75 100 0 25 50 75 100 0 25 50 75 100 0 25 50 75 100 M0 M1 M0 M1 M0 M1 0 25 50 75 100 0 25 50 75 100 0 25 50 75 100 p = 0.01 p = 0.05 % patients % patients Count (patients) Low % stroma Low % stroma High %
stroma High %stroma High %stroma
% patients 0 25 50 75 100 0 5 10 15 20 0 5 10 15 Pro-invasive CAF-S1 TGFβ CXCL12 Proliferation Migration EMT Invasion Pro-metastatic CAF-S4 NOTCH pathway activation
Breast cancer cells
TGFβ TGFβ-R CXCL12 CXCR4 FAP PDPN Collagen fibers FSP1 NOTCH receptors CD29 αSMA PDGFRβ NOTCH ligands