HAL Id: hal-00297785
https://hal.archives-ouvertes.fr/hal-00297785
Submitted on 10 Aug 2005HAL is a multi-disciplinary open access
archive for the deposit and dissemination of sci-entific research documents, whether they are pub-lished or not. The documents may come from teaching and research institutions in France or abroad, or from public or private research centers.
L’archive ouverte pluridisciplinaire HAL, est destinée au dépôt et à la diffusion de documents scientifiques de niveau recherche, publiés ou non, émanant des établissements d’enseignement et de recherche français ou étrangers, des laboratoires publics ou privés.
The effects of biomanipulation on the biogeochemistry,
carbon isotopic composition and pelagic food web
relations of a shallow turf lake
B. M. Bontes, R. Pel, B. W. Ibelings, H. T. S. Boschker, J. J. Middelburg, E.
van Donk
To cite this version:
B. M. Bontes, R. Pel, B. W. Ibelings, H. T. S. Boschker, J. J. Middelburg, et al.. The effects of biomanipulation on the biogeochemistry, carbon isotopic composition and pelagic food web relations of a shallow turf lake. Biogeosciences Discussions, European Geosciences Union, 2005, 2 (4), pp.997-1031. �hal-00297785�
BGD
2, 997–1031, 2005
Isotope analysis of a biomanipulated shallow turf lak B. M. Bontes et al. Title Page Abstract Introduction Conclusions References Tables Figures J I J I Back Close
Full Screen / Esc
Print Version Interactive Discussion EGU Biogeosciences Discussions, 2, 997–1031, 2005 www.biogeosciences.net/bgd/2/997/ SRef-ID: 1810-6285/bgd/2005-2-997 European Geosciences Union
Biogeosciences Discussions
Biogeosciences Discussions is the access reviewed discussion forum of Biogeosciences
The e
ffects of biomanipulation on the
biogeochemistry, carbon isotopic
composition and pelagic food web
relations of a shallow turf lake
B. M. Bontes1, R. Pel1, B. W. Ibelings1, H. T. S. Boschker2, J. J. Middelburg2, and Ellen van Donk1
1
Centre for Limnology, Netherlands Institute of Ecology, KNAW, P.O. Box 1299, 3600 BG Maarssen, The Netherlands
2
Centre for Estuarine and Marine Ecology, Netherlands Institute of Ecology, KNAW, P.O. Box 140, 4400 AC Yerseke, The Netherlands
Received: 21 June 2005 – Accepted: 11 July 2005 – Published: 10 August 2005 Correspondence to: B. M. Bontes ([email protected])
BGD
2, 997–1031, 2005
Isotope analysis of a biomanipulated shallow turf lak B. M. Bontes et al. Title Page Abstract Introduction Conclusions References Tables Figures J I J I Back Close
Full Screen / Esc
Print Version Interactive Discussion
EGU
Abstract
The effects of fish removal on the biogeochemistry and lower-trophic level food web relations were studied in a shallow eutrophied turf lake. Biomanipulation led to an in-crease in transparency and macrophyte biomass and dein-crease in phytoplankton abun-dance, but zooplankton numbers did not increase. Moreover, fish removal resulted in
5
high pH, high O2, low CO2 and more negative δ13CDIC values than expected, which is proposed to be the likely result of chemical enhanced diffusion with large negative fractionation (−13‰). By combining fluorescence activated cell sorting and isotope ra-tio mass spectrometry (IRMS) of fatty acids we were able to obtain group specific δ13C signatures and to trace possible shifts in δ13C resulting from fish removal.
Fractiona-10
tion values of green algae (20‰) and diatoms (22‰) were uniform and independent of treatment, while fractionation factors of filamentous cyanobacteria were variable be-tween the treatments that differed in CO2availability.13C-labeling of the phytoplankton groups showed that biomanipulation led to increased growth rates of green algae and diatoms at the expense of cyanobacteria. Finally, the primary consumer Chydorus
15
appeared to prefer cyanobacteria, whilst Asplanchna grazed predominantly upon eu-karyotes.
1. Introduction
Most (turf) lakes in the Netherlands are highly eutrophic and the resulting algal blooms are an important reason for concern for lake management authorities. In general,
phy-20
toplankton biomass in these lakes is dominated by cyanobacteria. More or less per-manent blooms of filamentous (Planktothrix or Limnothrix ) cyanobacteria may be the result of their capacity to establish and maintain conditions that promote their own ex-istence (Scheffer, 1998). Moreover, many cyanobacteria are fairly resistant to grazing by zooplankton, either through their relatively large (filamentous) size or through the
25
BGD
2, 997–1031, 2005
Isotope analysis of a biomanipulated shallow turf lak B. M. Bontes et al. Title Page Abstract Introduction Conclusions References Tables Figures J I J I Back Close
Full Screen / Esc
Print Version Interactive Discussion
EGU
of cyanobacterial blooms seriously interferes with lake use (e.g. for recreational pur-poses, drinking water supply), degrades ecosystem quality (Scheffer, 1998; Jeppesen et al., 1997; Moss et al., 1996) and is one of the main obstacles in lake restoration.
Initial efforts to restore eutrophied lakes focused on the reduction of nutrient loading, especially phosphorus. It was soon realized however that this by itself was insufficient
5
to restore the lakes. Shallow lake ecosystems may exist in (at least) two alternative stable states: a clear state, dominated by submerged macrophytes and a turbid state, characterized by algal blooms. Both states resist change through feedback mech-anisms between the turbid or clear state and biota in the lake, and these feedback mechanisms result in hysteresis in the recovery of lakes from eutrophication (Scheffer,
10
1998). Biomanipulation of lakes is a popular tool to assist lake restoration. It works by altering the food web structure of a lake and as such may remove obstacles for the re-covery of lakes. In biomanipulation benthivorous and/or planktivorous fish (like bream) are removed from the lake, resulting in lower algal biomass by stimulation of zooplank-ton grazing pressure and reduced sediment resuspension. The expected result is an
15
improved light climate and increased macrophyte settlement (Shapiro, 1972; Meijer and Hosper, 1997). However, former field experiments showed that, even when bioma-nipulation was combined with reduction of the external nutrient loading, the results of biomanipulation were variable and did not always lead to the desired improvement of water quality (Jeppesen et al., 1997). The reasons for failure of biomanipulation are not
20
always understood, but may be explained by unstable relations in the food web as well as by the complexity of food webs in macrophyte-dominated lakes (Jeppesen, 1998). The perspective behind this study is that biomanipulation changes the lower food chain relationships, leading to changes in the carbon cycle, which are subsequently reflected in the C-isotopic values of dissolved inorganic and primary producers. Ultimately, the
25
information on carbon isotope ratios (δ13C) of the smaller size classes of the pelagic biota (phytoplankton and zooplankton), before and after fish removal may increase our understanding of ecosystem functioning and improve the predictability of the response of lakes to biomanipulation.
BGD
2, 997–1031, 2005
Isotope analysis of a biomanipulated shallow turf lak B. M. Bontes et al. Title Page Abstract Introduction Conclusions References Tables Figures J I J I Back Close
Full Screen / Esc
Print Version Interactive Discussion
EGU
In earlier studies, quantitative effects of biomanipulation on higher trophic levels have been described in detail (Meijer et al., 1999; Carpenter et al., 2001), but effects of fish reduction on CO2, O2, pH dynamics and carbon fluxes in the seston of especially shallow lakes are less well understood. Therefore in this study we investigated the effects of fish removal on the biogeochemistry of a Dutch turf pond and the interactions
5
in the lower part of a food web, using state-of-the-art carbon isotope analysis combined with flowcytometry.
The rationale of using δ13C in the analysis of lake biogeochemistry is that 12C is preferentially taken up by phytoplankton, leaving a dissolved inorganic carbon (DIC) pool enriched in 13C (more positive δ13C). Conversely, respiration of organic matter
10
results in more negative δ13C values. Consequently changes in the balance between production and respiration of organic matter are expected to be reflected in δ13CDIC. Additionally, phytoplankton species may differ in isotopic composition, through varia-tions in δ13CDIC, growth rate (Laws et al., 1995), cell geometry (Popp et al., 1998), fixation pathways, nutrient availability (Bidigare et al., 1999) or other environmental
15
parameters such as day length and CO2availability (Burkhardt et al., 1999). The iso-topic signature of the zooplankton reflects that of their food source, with only a slight enrichment in the heavier isotope (13C) at each trophic transfer (Rounick and Winter-bourn, 1986; Goericke et al., 1994; Leggett et al., 1999). Therefore changes in the activity and composition of the phytoplankton, due to fish removal, are expected to be
20
reflected in the isotopic signatures of zooplankton, the main consumers of green algae and cyanobacteria.
During the last decades stable isotopes have been used extensively to trace trophic interactions at higher levels of the food-webs (Peterson and Fry 1987; Kling et al., 1992; Keough et al., 1996), but methodological limitations have restricted species specific
iso-25
tope analysis in the plankton community. New approaches based on the combination of biomarkers and stable isotope ratio mass spectrometry (Boschker and Middelburg, 2002) or the combination of flowcytometric cell-sorting and pyrolysis IRMS (Pel et al., 2003, 2004a) have recently been used to trace carbon flow through the microbial
do-BGD
2, 997–1031, 2005
Isotope analysis of a biomanipulated shallow turf lak B. M. Bontes et al. Title Page Abstract Introduction Conclusions References Tables Figures J I J I Back Close
Full Screen / Esc
Print Version Interactive Discussion
EGU
main (Van den Meersche et al., 2004). Pel et al. (2003) demonstrated for the shallow Lake Loosdrecht that natural differences in isotopic signatures of ‘algal’ groups (green algae and cyanobacteria) can be used directly to study C transfer from primary to sec-ondary consumers, and to assess preferential grazing by zooplankton. Schindler et al. (1997) observed that manipulation of predators and the consequent shift in grazers
5
had a dramatic impact on lake CO2concentrations and the exchange of CO2across the air to water interface. They also observed that shifts in isotopic composition of algae (seston), zooplankton and fish were linked. Subsequently Carpenter et al. (2001) and Cole et al. (2000) confirmed the observations regarding the dynamic response of O2 and CO2concentrations to biomanipulation. The aim of our study is to reveal potential
10
shifts, caused by biomanipulation of a eutrophic, shallow (turf) lake, in (a) biogeochem-ical variables e.g. O2and CO2(b) δ13C values of DIC, algae and zooplankton, and (c) trophic interactions between seston species. In contrast to other studies, which gen-erally lump all seston for bulk analysis, we were able to identify the specific δ13C per algal group by combining fluorescence-activated cell sorting (FACS) and Py-GC-IRMS
15
(Pel et al., 2003, 2004a).
2. Material and methods
2.1. Study site
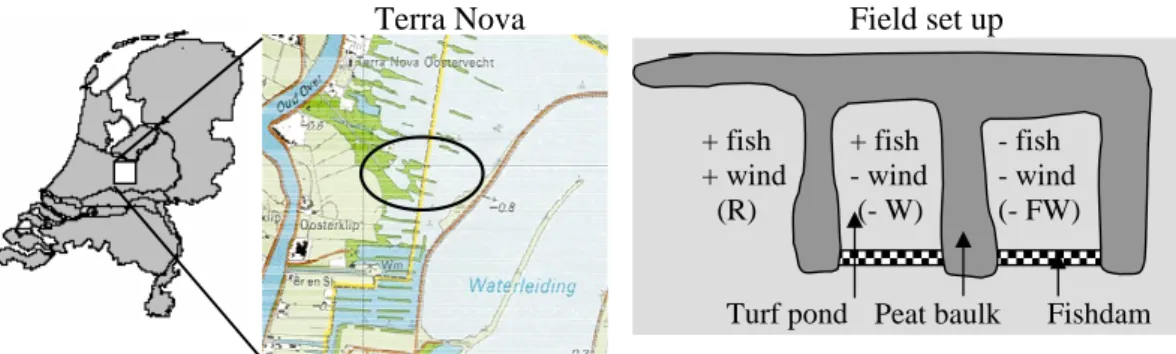
In October 2002 a biomanipulation experiment was started in the shallow lake Terra Nova (max. depth 1.5 m), which originates from turf digging in the 19th century (for
20
characteristics see Table 1). The sediment is organic (detritus); the water column completely mixed and highly turbid for a large part of the year. In addition to nutri-ents already present, Terra Nova receives water by connection (at high water levels) to the nearby hypertrophic lakes Loenderveen and Loosdrecht (Gons et al., 1992). Wa-ter quality and biodiversity of Terra Nova have greatly deWa-teriorated during the last 40
25
BGD
2, 997–1031, 2005
Isotope analysis of a biomanipulated shallow turf lak B. M. Bontes et al. Title Page Abstract Introduction Conclusions References Tables Figures J I J I Back Close
Full Screen / Esc
Print Version Interactive Discussion
EGU
green algae to green algae and filamentous cyanobacteria. Nowadays, the cyanobac-teria (Limnothrix ; Planktothrix ) make up more than 60% of the total phytoplankton community by number and the zooplankton is characterized by high population den-sities of detritivorous- and herbivorous species such as bosminids and small rotifers whilst large cladocerans like Daphnia are absent (G.ter Heerdt personal
communica-5
tion). Submerged macrophytes like Nitella, Chara and Potamogeton are missing, and floating macrophytes (Nuphar and Nymphea spp.) dominate the surface of the lake, in the open water as well as the littoral zone. Bream and roach are present in high den-sities (bream 89 and roach 9.7 kg ha−1). In September 2002, two shallow turf ponds (average area=0.005 km2; average depth=0.9 m) in Terra Nova were closed off from
10
the rest of the lake by wooden dams, in order to prevent fish migration (Fig. 1). In January 2003, fish was removed from both ponds using nets and electrical fishing. Ef-fectiveness of fish removal was determined by the mark-recapture method of Petersen (1896). Results were satisfactory with a total reduction of the planktivorous and ben-thivorous fish stock by almost 75% (source Witteveen and Bos). The southern turf
15
pond was restocked with a known amount and composition of fish, reflecting the av-erage Terra Nova densities (see earlier), whilst the northern turf pond was left without fish. For correct interpretation it is essential to realize that, besides reduction of the fish, also wind was reduced significantly in both enclosures. Reduction of the fetch may have reduced sediment resuspension and gas exchange across the air-water
in-20
terface. Furthermore a reference location adjacent to the two closed turf ponds and in open contact with the main lake was monitored; this site was more wind exposed than the biomanipulated enclosures (but less wind exposed than the open water of Terra Nova), and fish conditions were left unchanged. From hereon we will refer to the different sample locations as − FW (− fish and − wind), − W (+ fish − wind) and
25
R (reference; i.e. + fish + wind). Unfortunately a location without fish, but with wind conditions unchanged (− fish+ wind) was not at hand.
BGD
2, 997–1031, 2005
Isotope analysis of a biomanipulated shallow turf lak B. M. Bontes et al. Title Page Abstract Introduction Conclusions References Tables Figures J I J I Back Close
Full Screen / Esc
Print Version Interactive Discussion
EGU
2.2. Monitoring plankton and abiotic variables
Water samples were collected (bi) weekly, from February–December 2003 from the 3 locations, using a 1.5 m long tube sampler, which enabled us to sample the entire water column. From a mixed 30 L sample, a sub sample of 10 L was brought to the laboratory for analysis. Secchi depth, temperature, pH and oxygen concentrations were
mea-5
sured in situ (Multiline-P4 meter, WTW, Germany). In the laboratory, optical density (750 nm) was measured on a spectrophotometer (Halios-δ, Unicam, UK). To monitor phytoplankton abundance, Chla fluorescence of green algae, diatoms and cyanobac-teria was measured on a Phyto-PAM (Walz, Germany) and number of cells per algal group was determined on a Coulter Elite flowcytometer. For quantifying pelagic
zoo-10
plankton, 4 L of field sample was filtered (33 µm; micro- and meso zooplankton), the residue was dissolved in 50 mL tap water, fixed with glutaraldehyde-formaldehyde (1% solution) and stored cold and dark. Later, zooplankton was counted microscopically (250×) using the sub sampling method of Kott (1953).
2.3. Stable isotope analysis
15
First, during 2003, concentrations and δ13C values (13C:12C ratio) of DIC (C-source used by algae for primary production) were established every other week. Therefore 1.5 mL of raw field sample was transferred to 8 mL airtight bottles that had been flushed before with helium. To convert all HCO−3 and CO2−3 to CO2and to equilibrate CO2 be-tween the gas and water phase, the samples were acidified with 0.2 mL H3PO4(2M).
20
After 24 h, 0.4 mL of the gaseous phase was manually injected into a Euro Elemental Analyzer (Eurovector, Italy) coupled to a Finnigan Delta-S IRMS. A carbonate calibra-tion series was run together with the samples (10, 20 and 40 ppm Na2CO3 in milli-Q, acidified and equilibrated similarly as the lake samples). Next, CO2(aq) and pCO2 (ppmv) were derived from DIC and the in situ lake pH using pK values calculated
ac-25
cording to Prieto and Millero (2002). Corrections for the discrimination of the heavy 13
BGD
2, 997–1031, 2005
Isotope analysis of a biomanipulated shallow turf lak B. M. Bontes et al. Title Page Abstract Introduction Conclusions References Tables Figures J I J I Back Close
Full Screen / Esc
Print Version Interactive Discussion
EGU
volumes were made according to Baird et al. (2001), Miyajima et al. (1995) and Mook et al. (1974).
In addition δ13C values of cellular fatty acids of the main phytoplankton (cyanobac-teria, eukaryotes (green algae+ diatoms)) and of zooplankton representatives were monitored at regular intervals, at the locations – FW, – W and R. Sample preparation
5
by cell sorting, and isotope measurements of group-specific fatty acids was essen-tially conducted as described in Pel et al. (2004a). In these analyses we focused for diatoms on the group-specific C20:5 fatty acid (Middelburg et al., 2000), whilst for green algae, cyanobacteria, Microcystis and flab (floating algal beds) the C18:n fatty acids were taken. At low algal densities, lake samples were concentrated by
centrifu-10
gation (Jouan instruments, France) prior to flowcytometrical cell sorting (FACS). Pilot tests showed that cells remained intact and fluorescence was not significantly affected when centrifuged for 2×10 min, at 196 G. Microcystis and filamentous macro algae (flab) were not sorted on the flowcytometer, but colonies and filaments were hand-picked under a microscope. Zooplankton used for isotope analysis were concentrated
15
on a 33 µm filter and selected per species under a stereomicroscope (10× magnifica-tion). Depending on size and fatty acid richness, 1 to 20 individuals were used per sample. Isotope analysis of fatty acids was performed by in-situ pyrolytic methylation and IRMS linked gas chromatography. Instead of TMPAH (trimethyl phenyl ammonium hydroxide), used in previous studies as derivatisation reagent (Pel et al., 2003, 2004a),
20
we used 0.5–0.7 µl TMSH (trimethyl sulfonium hydroxide; 0.25 M solution in methanol) in the present study, because of the much reduced isomerization side-effects of this reagent in the transesterification of poly-unsaturated fatty acids (Blokker et al., 2002). Carbon isotopic composition of the fatty acids is reported in δ-notation: δ13C in parts per thousand (‰)=[(13C/12Csampl e−13C/12Cref erence)-1] ×103expressed relative to
Vi-25
enna Pee Dee Belemnite. Reproducibility was <0.4‰ for FCM-sorted phytoplankton and ≤0.3‰ for handpicked zooplankton (Pel et al., 2003). Fatty acids were identified by their retention times using a known sample of Limnothrix sp. strain MR1 (Pel et al., 2004a). For an isotopic baseline of the pelagic food web in Terra Nova, we used the
BGD
2, 997–1031, 2005
Isotope analysis of a biomanipulated shallow turf lak B. M. Bontes et al. Title Page Abstract Introduction Conclusions References Tables Figures J I J I Back Close
Full Screen / Esc
Print Version Interactive Discussion
EGU
main primary producers. To calculate the discrimination (factor ε) of the primary pro-ducers with respect to the in situ C-source, the average fatty acid-based δ13C values of the algal groups were corrected for an offset of +9‰ observed between cellular fatty acids and total cell carbon biomass (see Pel et al., 2004a).
2.4. Growth rate measurements
5
In order to relate phytoplankton population dynamics to group-specific isotopic signa-tures, in-situ specific growth rates (µc(d−1), where c is carbon) of cyanobacteria, green algae and diatoms for the 3 sites of Terra Nova were obtained monthly from 31 March till 25 November 2003. These growth rates were estimated from the rate of13C–CO2 in-corporation into the fatty acids over a 24h-period using the method of Pel et al. (2004b).
10
To approach the in situ light conditions, the cells received the average light dose they received in the field (PAR), calculated according to Scheffer (1998), using Secchi depth, mixing depth and average light intensity of the previous 10 days. Light was provided by 4 to 8 Philips fluorescent light tubes (24 W/840). Samples for obtaining growth rate were taken at t0h and t24h after enrichment and isotope analysis of the DIC and
phy-15
toplankton was performed as described above (algae were sorted by FACS and their isotopic composition subsequently measured by Py-GC-IRMS). Growth rates were cal-culated according to Welschmeyer and Lorenzen (1984). Since sample preparation for isotope analysis is labor intensive and GC analysis time relatively long, samples were not analyzed in replicate.
20
2.5. Statistical analysis
Differences in the isotopic signatures of the main primary producer/plankton groups, within and between treatments, were analyzed for significance using a repeated mea-surement Anova (p<0.05) using Statistica (StatSoft, Inc., US, 2003). Prior to analysis, data were checked for normality and homogeneity of variance. Because isotope data
25
mea-BGD
2, 997–1031, 2005
Isotope analysis of a biomanipulated shallow turf lak B. M. Bontes et al. Title Page Abstract Introduction Conclusions References Tables Figures J I J I Back Close
Full Screen / Esc
Print Version Interactive Discussion
EGU
sured only once, we primarily describe the observed trends between the treatments, qualitatively.
3. Results
3.1. General observations on the effects of biomanipulation
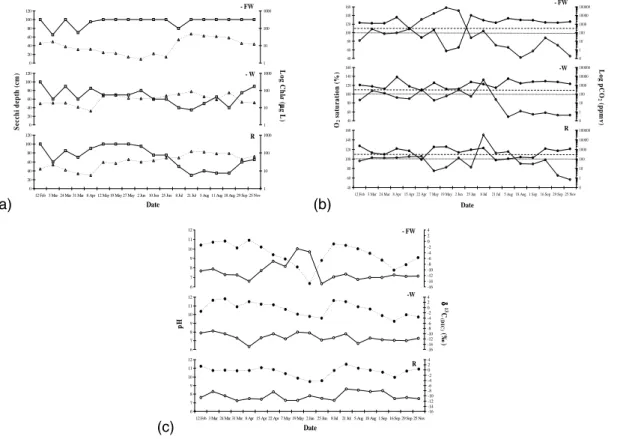
Biomanipulation and wind reduction had large effects on several biotic and abiotic
pa-5
rameters (Table 1). During the algal growing season, turbidities and phytoplankton densities (Chla levels) were lowest in − FW, intermediate in − W and highest in R (Fig. 2a). In − FW, light penetrated to the sediment for most of the year, whilst in − W bottom visibility was never attained. In − W and R, the phytoplankton was represented by green algae (e.g. Chlorococcales, Scenedesmus) and diatoms (Fragilara), but was
10
mainly dominated by high densities of filamentous or coccoid cyanobacteria
(Plank-tothrix, Aphanizomenon, Microcystis). In − FW, low algal biomass was equally divided
over cryptophytes, flagellates, larger diatoms (Asterionella) and green algal species (Tetrastrum, Pediastrum), whilst cyanobacteria played only a minor role. Finally, in all locations extremely high numbers of small unicellular green algae were present.
Nu-15
trient levels and temperature, did vary in time, but did not vary significantly between the treatments. Considering macrophyte presence; submerged macrophytes (Elodea and Ceratophyllum) reached highest coverage in − FW (∼95% of the sediment surface area was covered by the end of August), and regularly seedlings of several nationally rare species (Potamogeton obtusifolius, Chara globularis, Nitella flexilis, Najas marina,
20
Stratiotes aloides) were encountered. In − W, submerged Elodea and Ceratophyllum
covered only one quarter of the turf pond in June, at which time floating macrophytes (Nymphae and Nuphar ) took over for the rest of the season. In R, submerged plants were almost absent and the site was dominated by Nymphae and Nuphar. In all 3 loca-tions, significant increases of flab, with species like Melosira, Spyrogyra and Ulothrix,
25
den-BGD
2, 997–1031, 2005
Isotope analysis of a biomanipulated shallow turf lak B. M. Bontes et al. Title Page Abstract Introduction Conclusions References Tables Figures J I J I Back Close
Full Screen / Esc
Print Version Interactive Discussion
EGU
sities in - FW from 7 May till 16 June with 40% coverage. Accumulative numbers of zooplankton observed during 2003 were about twice as high in the presence of fish, i.e. higher in − W and R than in − FW (Table 2a). Also from monthly averages (Table 2b) it appears that, except in July 2003, zooplankton numbers were always lower in − FW. However, in − FW, large crustaceans (Polyphemus, Semocephalus, and Pleuroxus)
5
were occasionally observed, but numbers remained low. In − W and R, reasonably high abundances of crustacean species (e.g. Ceriodaphnia, D. cuculata, Chydorus,
Bosmina) were observed at regular intervals. Most striking, however, was the
obser-vation that small (herbivorous/detritivorous) rotifers such as Keratella, Polyarthra,
Anu-raeopsis and Trichocerca outnumbered all other species in all treatments. Cyclopoids 10
copepods (adults/larvae) as well as Asplanchna and Ceriodaphnia occurred in compa-rable densities in the three treatments.
3.2. pH, O2and CO2dynamics
The effects of fish removal and the resulting extensive growth of macrophytes on CO2(aq) availability, O2 saturation and pH in the water column were far-reaching
15
(Figs. 2b and 2c). In − FW, pH increased from pH 7 to 8.5 between 15 April and 7 May. This increase was followed by a second, equally large increase from pH 8.5 to 10 within a two week period later in May. The alkaline state of the water lasted until 2 June, after which pH went down again to pH ≈7. In the same period substantial increases in O2 saturation and decreases in pCO2occurred (Fig. 2b), which corresponded to observed
20
increases in macrophyte biomass. It appears that in − FW, between 15 April and 2 June, production outbalanced respiration and the system was autotrophic (Fig. 2b). This is indicated by [O2(aq)] surpassing the 100% saturation level and [CO2(aq)] remain-ing below atmospheric levels (<370 ppmv). Decreased O2 levels around the end of August may indicate increased mineralization of the flab and macrophyte biomass by
25
bacteria and heterotrophic biota. In the treatments − W and R, pH never exceeded 8.6, and values averaged around ≈pH 7, throughout the year. For the largest part of the growing season, CO2production and O2consumption, appeared to be the general
BGD
2, 997–1031, 2005
Isotope analysis of a biomanipulated shallow turf lak B. M. Bontes et al. Title Page Abstract Introduction Conclusions References Tables Figures J I J I Back Close
Full Screen / Esc
Print Version Interactive Discussion
EGU
dominant mechanisms in these treatments, so net heterotrophy characterized these two systems. Nonetheless, O2 and CO2 levels did cross respectively the saturation and depletion levels for a short period between 25 June and 8 August 2003.
3.3. Stable isotope analysis of DIC, phytoplankton and zooplankton
In − FW we observed two exceptional large decreases in δ13C(DIC) (Fig. 2c); from
5
≈0‰ to −15‰ between 8 April–2 June and from −1‰ to −10‰ between 8 July– 16 September. These excessive low δ13C values occurred only in the absence of fish, while in the treatments − W and R, δ13C(DIC) values remained in the range from ≈2‰ to −4‰. Furthermore, average seasonal δ13C values of DIC and CO2 (mean −5.1‰) were more depleted in − FW than − W and R (mean −1‰). The decrease in
10
δ13C(DIC) observed in − FW, was contrary to what we expected, namely enrichment in of the13CDIC instead of depletion during autotrophic periods. The common reasoning for this is that under non-limiting CO2 concentrations, the 12C isotopes are always preferentially incorporated over the13C isotope during assimilation, thereby leaving a substrate (DIC) enriched in13C (Goericke et al., 1994).
15
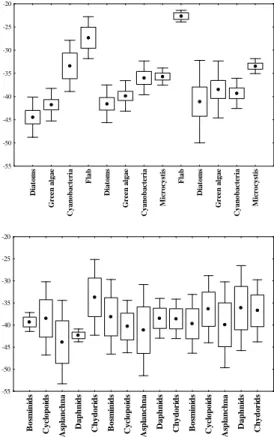
Statistical analyses between the plankton groups, within one treatment, showed that in − FW, − W and R, diatoms, green algae and cyanobacteria did not significantly differ from each-other in isotopic signature (Anova, p>0.05). The δ13C value of flab, however, significantly differed from that of the diatoms and green algae in − FW and of all other groups (incl. cyanobacteria and Microcystis) in − W. Also Microcystis δ13C
20
values deviated significantly from diatoms in − FW and other cyanobacteria in R. Even though not all significant, the following trends in δ13C values of green algae, di-atoms and cyanobacteria were observed; in − FW and − W, δ13C values of eukaryotic algae (−39‰ to −44‰) were more depleted than those of cyanobacteria (−33‰ to −36‰; including Microcystis −35‰), whilst flab was most enriched (−23‰ to −26‰).
25
At the reference site, δ13C values of eukaryotic algae and cyanobacteria fell in the same range (−38‰ to −41‰), whilst Microcystis was clearly more enriched (−33‰).
BGD
2, 997–1031, 2005
Isotope analysis of a biomanipulated shallow turf lak B. M. Bontes et al. Title Page Abstract Introduction Conclusions References Tables Figures J I J I Back Close
Full Screen / Esc
Print Version Interactive Discussion
EGU
At all sites, diatoms were more depleted (−41‰ to −44‰) than green algae (−39‰ to −41‰). Cyanobacteria on the other hand were similarly depleted as eukaryotes in R but became more enriched in − W and − FW (see Appendix A). Table 3 shows that, after correction for the+9‰ offset between fatty acids and total cell carbon biomass, discrimination against the heavy13C isotope (fractionation; ε) became less in the
se-5
quence: diatoms >green algae> (filamentous) cyanobacteria >Microcystis> flab. Figure 3b shows that in − FW and − W, with exclusion of the chydorids (−33.7‰),
δ13C values of zooplankton resembled the isotopic signature of green algae or diatoms rather than those of cyanobacteria, Microcystis or flab. At the reference site (R), the
δ13C of some zooplankton species either matched the isotopic composition of
eukary-10
otes or the cyanobacteria, while in other species the diet appeared to be composed of several different but on average more enriched food sources (−36‰). Zooplankton iso-tope signature, however, did not differ significantly (ANOVA, p>0.05) within or between treatments.
3.4. Phytoplankton growth rates
15
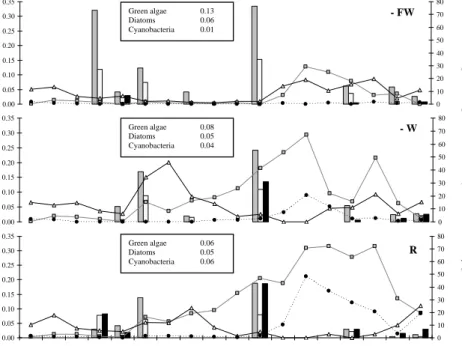
Figure 4 shows that, irrespective of the treatment and time of year, specific growth rates of diatoms, green algae or cyanobacteria never exceeded 0.4 d−1. Highest growth rates of green algae (0.33 d−1) and diatoms (0.15 d−1) in − FW and of cyanobacteria (0.19 d−1) in the reference were achieved on 25 June 2003. Mean µc values for the algal groups and treatments (see boxes in Fig. 4) indicate that green algae and diatoms
20
were the dominant primary producers in the absence of fish whilst cyanobacteria be-came more important as wind and especially the impact of fish increased. In particular as turbidity increased in R, cyanobacteria appeared to grow faster (31 March). Seem-ingly, two growth peaks occurred in all treatments; − FW on 31 March and 25 June, and on 7 May and 25 June in − W and R. Unfortunately, datasets of Chla and growth
25
rate were not completely overlapping, since occasionally algal densities were too low to sort the clusters by FACS and growth rates were obtained on a monthly basis only. In general, with exception of the high growth rate of green algae on 31 March in −
BGD
2, 997–1031, 2005
Isotope analysis of a biomanipulated shallow turf lak B. M. Bontes et al. Title Page Abstract Introduction Conclusions References Tables Figures J I J I Back Close
Full Screen / Esc
Print Version Interactive Discussion
EGU
FW, where subsequently phytoplankton biomass remained low, the majority of growth rate data seemed to coincide, with a – somewhat delayed – increase in phytoplankton biomass (Chla).
4. Discussion
Before discussing in detail the isotope results, it is instructive to evaluate the monitoring
5
results. In agreement with the majority of studies on biomanipulation in shallow, turbid lakes (Gulati and Van Donk, 2002; Van Donk et al., 1994; Moss et al., 1996), the re-moval of planktivorous/benthivorous fish in − FW led to increases in transparency, low Chla concentrations and the return of submerged plants. Moreover, otherwise domi-nant filamentous cyanobacteria Planktothrix as well as Limnothrix (presumably strain
10
L. limnetica MR 1 described by Rijkeboer et al., 1992) almost entirely disappeared,
but cyanobacterial biomass was never fully replaced by other algae (green algae or diatoms). Large differences in cyanobacterial biomass between − W and R, may be the result of a larger wind fetch in R (Van Donk et al., 1994), leading to sediment re-suspension and high turbidities, thereby promoting low light adapted cyanobacterial
15
growth (Chorus and Bartram, 1999). We expected large-sized grazers to increase in − FW, in response to reduced predation pressure in the absence of fish (Hosper, 1993), which did not happen, however. We can only speculate on the causes, as for instance the sensitivity of Daphnia to elevated pH levels (Steiner, 2004). Absence of food (al-gae) is not likely to explain the conspicuous absence of larger grazers, given the fact
20
that production rates in − FW were similar to the other sites (Fig. 4). Alternatively, the zooplankton population may never have recovered from the low abundances in spring or zooplankton feeding fish, still present after fish removal, may have consumed the plankton, as the summer proceeded. Instead of large cladocerans (Gulati and Van Donk 2002), we observed large numbers of small rotifers (e.g. Keratella, Polyarthra) in
25
− FW, though still not as much as in the presence of fish. We can again only speculate about the possible reasons, such as the ability of these micro-heterotrophic organisms
BGD
2, 997–1031, 2005
Isotope analysis of a biomanipulated shallow turf lak B. M. Bontes et al. Title Page Abstract Introduction Conclusions References Tables Figures J I J I Back Close
Full Screen / Esc
Print Version Interactive Discussion
EGU
to utilize alternative food sources, not/less accessible to the cladoceran population, e.g. detritus (Kling et al., 1992), but also the abundant small unicellular green algae, which possibly were effectively grazed upon by the high numbers of rotifers. In contradiction to the general opinion we cannot confirm that the predation of fish on invertebrates is a prime determinant of whether a lake will be clear and dominated by plants or turbid
5
and dominated by phytoplankton (Hosper, 1993; Van Donk et al., 1994). In − FW, pelagic total phosphorous (TP) concentrations remained similar to those at the other locations, ranging from 0.03–0.1 mg L−1 (eutrophic-hypertrophic), but clear water was achieved and macrophytes settled. Evidently, nutrient reduction is just one of the key factors for (the initial) restoration to fail or to succeed. Numerous other authors (e.g.
10
Scheffer, 1998; Jeppesen et al., 1997; Søndergaard et al., 2003) also state that at comparable nutrient levels, shallow lakes may be either clear or turbid depending on biological feedbacks in the system.
Shallow lakes have many pathways to channel C from primary producers through the food web and 13C-analysis of sources and sinks has proved useful to decipher
15
links between trophic levels within aquatic food webs (e.g. Kling et al., 1992).
What stood out in the isotope, analysis of the currently studied shallow lake, were the consequences of fish removal on the biogeochemistry of CO2, O2and δ13C(DIC). While − W and R showed similar trends in these parameters, in − FW periods with increased primary production were accompanied by more extreme upward – and downward
ex-20
cursions of O2and pCO2, respectively. Beside increased macrophyte and macro-algal growth, also low turnover rates of this biomass (low edibility compared to phytoplank-ton, however grazing by macrofauna like snails was not included in our study) may have caused pCO2levels to drop and O2and pH levels to rise in − FW. Although Terra Nova can be characterized as a net heterotrophic system during the largest part of the
25
year at all 3 locations, the period between 22 April–25 June 2003 was characterized by O2increase and CO2decrease in − FW, and is recognized as a definite episode of au-totrophic dominance. Hanson et al. (2004), Cole et al. (2000), Carpenter et al. (2001) and Schindler et al. (1997) reported a similar reduction in CO2 upon biomanipulation.
BGD
2, 997–1031, 2005
Isotope analysis of a biomanipulated shallow turf lak B. M. Bontes et al. Title Page Abstract Introduction Conclusions References Tables Figures J I J I Back Close
Full Screen / Esc
Print Version Interactive Discussion
EGU
Therefore, we may conclude that, also under the moderate to high TP conditions in Terra Nova, removal of fish temporarily changed the system in a net sink for atmo-spheric carbon, while under turbid, non-manipulated conditions the system was as a net source of carbon, consistent with observations by Cole et al. (2000).
Under high pCO2, heterotrophic conditions, δ13CDIC usually becomes lighter,
be-5
cause respiration adds δ13C depleted DIC (Goericke et al., 1994; Bade et al., 2004), while under low pCO2 conditions, as in − FW, significant increases in δ13CDIC are expected. However, two periods with decreases in δ13CDIC were observed. The first lowering of the δ13CDICvalue (April–June 2003) was most likely the result of chemically enhanced diffusion of CO2at the air-water phase, which has earlier been described by
10
Herczeg and Fairbanks (1987), and results in large fractionation. The high biomass of macroalgae − FW in this period, led to extreme low pCO2 and high pH levels, thereby forcing invasion of CO2 from the air into the water (see Ibelings and Maberly, 1998). Its subsequent binding with OH−(aq)to HCO3−(aq)probably led to a large negative
frac-tionation (approximately −13‰), opposite to the normal fracfrac-tionation of about 8‰ in
15
situations where CO2(aq) and CO2(g) are in equilibrium at atmospheric conditions. In Peter Lake, similar trends in δ13CDIC, were observed by Bade et al. (2004) after fish reduction. The second drop in the isotopic values of DIC (July–September 2003), may next to modest chemical enhancement also partly have been caused by respiration of the lake biota of organic detritus, rich in12C (Leggett et al., 1999; Rounick and
Win-20
terbourn, 1986; Rau, 1978), induced by increased temperatures. Or, alternatively, the oxidation of biogenic methane (range −40 to −60‰; Sierszen et al., 2004) from the sediment may have played a role in the depletion of the DIC. Because the13C deple-tion of the DIC is a seasonally dependent process, it complicates the use of δ13C to identify carbon sources in these systems (Bade et al., 2004; Herczeg and Fairbanks,
25
1987).
We were able to detect differences as well between the isotopic signatures of the pri-mary producers and the different treatments (Fig. 4), which underlines the usefulness of this type of data to trace potential food preferences in the consumers. The variation
BGD
2, 997–1031, 2005
Isotope analysis of a biomanipulated shallow turf lak B. M. Bontes et al. Title Page Abstract Introduction Conclusions References Tables Figures J I J I Back Close
Full Screen / Esc
Print Version Interactive Discussion
EGU
in δ13C signature of the algae, may be a consequence of several factors including: the inorganic carbon species taken up (CO2, HCO−3), concentration and δ13C value of the C source, the specific growth rate (function of temperature, light, nutrients), cell geometry (cell permeability, cell size), C uptake kinetics (diffusion vs. active uptake) and the photosynthetic pathway (Laws et al., 1995; Peterson and Fry, 1987). In order
5
to disentangle the contribution of these separate factors to the difference in isotopic composition of the algal groups, the fractionation factor ε (overall discrimination in the assimilation of carbon isotopes) was derived from the group-specific fatty acid13C sig-nature (Table 3). Mean epsilons for diatoms (22‰) and green algae (20‰) were rather constant and independent of treatment and/or growth rate, suggesting that the algae
10
in these groups were fixing CO2, via the expected C3photosynthetic pathway and rep-resenting fractionation via Rubisco (ε≈25−29; Goericke et al., 1994). The epsilon for flab (macro algae), also based on the C18:n fatty acid, was ≈4‰. This observation of very low fractionation is consistent with studies describing “boundary-layer diffusion re-sistance” in sedentary or benthic organisms. Under low turbulent conditions unstirred
15
layers, depleted in12C, form around the surface cells of sedentary organisms, forcing these cells to take up proportionally more13C than12C (LaZerte and Szalados, 1982; Goericke et al., 1994; France and Catanneo, 1998). On the contrary, mean ε for
Mi-crocystis (15-18‰) and other cyanobacteria (Limnothrix and Planktothrix ; 11–20‰)
showed more variability between treatments. These differences in isotope
fractiona-20
tion can be related to a number of factors and we discuss a few: One, differences in growth rates of the cyanobacteria in the different locations might have caused differ-ences in ε. However, we would then expect fractionation to decrease as growth rate increased, while the results showed that growth rates (Fig. 4) and ε both increased from − FW to − W to R. Two, differences in CO2availability between − FW, − W and
25
R, may have played a significant part in the variance in ε between the algal groups. While the eukaryotic algae fixed CO2via the C3pathway (Rubisco), cyanobacteria
(Mi-crocystis) might have additionally have utilized bicarbonate via carboxylation with
BGD
2, 997–1031, 2005
Isotope analysis of a biomanipulated shallow turf lak B. M. Bontes et al. Title Page Abstract Introduction Conclusions References Tables Figures J I J I Back Close
Full Screen / Esc
Print Version Interactive Discussion
EGU
to CO2 limitations, such as cyanobacteria, under CO2 limiting conditions (Goericke et al., 1994). And three, the relative importance of CO2 uptake and active HCO−3 uptake by cyanobacteria, as a consequence of the differences in CO2 availability in the three different treatments (− FW, − W, R), may have determined the variance in ε of the cyanobacteria (see Table 3) (Cassar et al., 2004; Keller and Morel, 1999). If we would
5
assume, for instance, ε to follow the relation: ε=21−fa×20, where fa is the fraction of HCO−3 that is actively taken up and 21 relates to passive CO2 uptake using Rubisco (like for diatoms and green algae), then according to the ε values in Table 3, cyanobac-teria actively took up 50% in − FW, 25% in − W and nothing in R. Adopting another value for the CO2availability dependence (e.g. 10 rather 20) would change the actual
10
estimate of active uptake, but not our conclusion that active uptake of bicarbonate by cyanobacteria under low pCO2might explain our results.
The sequence of algal fractionation factors observed in this study: diatoms > green algae >cyanobacteria> Microcystis > flab (Table 3), is consistent with other studies regarding the small fractionation by sedentary macro algae, but inconsistent with some
15
recent reports, including our own, on micro algal isotope fractionation. Boschker et al. (2005) found that diatoms were more enriched than green algae in the upper part of the Scheldt estuary. Pel et al. (2003) found in Lake Loosdrecht, which is adjacent to Terra Nova, that cyanobacteria were more depleted than green algae and diatoms. Ultimately, there was enough resolution to distinguish the primary producers on
ba-20
sis of their fractionation value, but our limited understanding of factors governing iso-tope fractionation under natural conditions hampers the generalization of the effects of biomanipulation on isotopic signatures over multiple systems.
Biomanipulation had a clear effect on algal biomass, species composition and on the specific growth rates of the cyanobacteria, diatoms and green algae. In - FW, green
25
algae grew faster than diatoms, which grew faster than cyanobacteria. Since this is not reflected in the biomass of the algal groups (Fig. 4), we assume specific loss factors like preferential grazing on green algae and small diatoms. Similar results were found for Lake Loosdrecht by Pel et al. (2003; see their Figs. 2 and 3). Despite the overwhelming
BGD
2, 997–1031, 2005
Isotope analysis of a biomanipulated shallow turf lak B. M. Bontes et al. Title Page Abstract Introduction Conclusions References Tables Figures J I J I Back Close
Full Screen / Esc
Print Version Interactive Discussion
EGU
abundance of cyanobacteria, primary consumers depended heavily on the numerically rare eukaryotic algae that had higher growth rates than the cyanobacteria.
Considering the13C analysis of the zooplankton species, we briefly refer to some ob-servations that allow us to attribute some primary consumers to certain food sources. In − FW the relative heavy δ13C of Chydorus sp. implied that these species mainly
5
grazed upon cyanobacteria, as did Euchlanis in Lake Loosdrecht (Pel et al., 2003), while in − W and R they switched to a mixture of eukaryotes and cyanobacteria. Alter-natively, considering its semi-benthic habitat, Chydorus fed on an enriched food source near the bottom (benthic algae or epiphyton). The depleted δ13C value of the large ro-tifer Asplanchna, in − FW, indicated a preference for the depleted green algae and
10
diatoms, consistent with data on Asplanchna and Brachionus in Pel et al. (2003). In agreement with Pel et al. (2003), by looking at the stable isotopic values and the abun-dance of algae, rotifers and copepods, we hypothesize that the very abundant small unicellular green algae may have formed an important food source for the small ro-tifers, which were subsequently preyed upon by the cyclopoids. Although our study
15
provides an unprecedented level of detail in the isotopic signatures in the primary pro-ducers, it appears that we are not able to determine the main food source. This can be due to the wide range in δ13C of primary producers lowering the resolution or, as has been suggested before (Kerner et al., 2004), that multiple food substrates were con-sumed (omnivory) suggesting that the food web was not structured in a linear fashion
20
and that generalist consumers prevailed.
5. Summary and conclusions
Biomanipulation in the shallow turf lake Terra Nova did follow the expectations with respect to increases of transparency, macrophyte settlement and decreases in phyto-plankton abundance, but zoophyto-plankton numbers did not increase. Manipulation of fish
25
resulted, at least during late spring/ early summer, in low pCO2, high O2concentrations and anomalous negative δ13CDICvalues due to chemical enhancement of CO2diffusion
BGD
2, 997–1031, 2005
Isotope analysis of a biomanipulated shallow turf lak B. M. Bontes et al. Title Page Abstract Introduction Conclusions References Tables Figures J I J I Back Close
Full Screen / Esc
Print Version Interactive Discussion
EGU
at high pH levels. This might be a more general phenomenon as it has been observed in biomanipulated Peter Lake as well (Bade et al., 2004). Removal of fish resulted in enhanced growth of green algae and diatoms at the expense of cyanobacteria. Green algae and diatoms mainly use Rubisco to fix CO2as reflected by their ε value, whilst cyanobacteria are also able to actively take up HCO−3, consistent with recent literature
5
by Cassar et al. (2004) and Keller and Morel (1999). So, cyanobacterial fractionation depends on the treatment (-FW, -W or R), because CO2 availability varied between treatments. Chydorus seemed to prefer cyanobacteria, whilst Asplanchna grazed upon eukaryotes. Finally, although exceptionally detailed isotopic values were obtained from phytoplankton and zooplankton in the field (see Appendix 1), by a unique combination
10
of flowcytometrical cell sorting and isotope analysis, this was not sufficient to unravel the food web. Therefore we suggest the use of additional analytical tools, for instance additional isotopes (15N; Veuger et al., 2005), fatty acid patterns, or the combination of deliberate tracer experiments with numerical models (Pace et al., 2004; Van den Meersche et al., 2004) to further unravel relations in the lower part of food webs.
15
Appendix A
Temporal variation in δ13C values (‰) of the C18:n fatty acids value for green algae, cyanobacteria (Microcystis), flab and all assessed zooplankton species and the C20:5 fatty acid for diatoms in − FW (Table 4), − W (Table 5), and R (Table 6) .
Acknowledgements. We thank G. ter Heerdt of the Municipal Waterworks of Amsterdam for
20
providing additional data and inviting us to participate in the experimental setup. A. Bak, G. Bonhoff, V. Correa de la Torre are thanked for sampling and H. Hoogveld and K. Siew-ertsen for providing flowcytometer and zooplankton data. This publication is a contribution to OBN – Restoration and Management of Dutch Peat lakes, financed by the Ministry of Agri-culture, Nature and Fisheries in the Netherlands; a collaboration between the Universities of
25
Nijmegen and Utrecht and the Centre for Limnology of the Netherlands Institute of Ecology. This is publication ... of the Netherlands Institute of Ecology (NIOO-KNAW).
BGD
2, 997–1031, 2005
Isotope analysis of a biomanipulated shallow turf lak B. M. Bontes et al. Title Page Abstract Introduction Conclusions References Tables Figures J I J I Back Close
Full Screen / Esc
Print Version Interactive Discussion
EGU
References
Bade, D. L., Carpenter, S. R., Cole, J. J., Hanson, P. C., and Hesslein, R. H.:Controls of δ13 C-DIC in lakes: Geochemistry, Lake metabolism and Morphometry, Limnol. Oceanogr, 49, 1160–1172, 2004.
Baird, M. E., Emsley, S. M, and McGlade, J. M.: Using a phytoplankton growth model to predict
5
the fractionation of stable carbon isotopes, J. Plank. Res., 23, 841–848, 2001.
Bidigare, R. R., Hanson, K. L., Buesseler, K. O. et al.: Iron-stimulated changes in C-13 frac-tionation and export by equatorial Pacific phytoplankton: Toward a paleogrowth rate proxy, Paleoceanography, 14, 589–595, 1999.
Blokker, P., Pel, R., Akoto, L., Brinkman, U. A., and Vreuls, J. J.: At-line gas
chromatographic-10
mass spectrometric analysis of fatty acid profiles of green micro-algae using a direct thermal desorption interface, J. Chromatogr., 959, 191–201, 2002.
Boschker, H. T. S. and Middelburg, J. J.: Stable isotopes and biomarkers in microbial ecology, FEMS Microbiology Eology, 40, 85–95, 2002.
Boschker, H. T. S., Kromkamp J. C., and Middelburg, J. J.: Biomarker and carbon isotopic
con-15
straints on bacterial and algal community structure and functioning in a turbid, tidal estuary, Limnol. Oceanogr., 50, 70–80, 2005.
Burkhardt, S., Riebesell, U., and Zondervan, I.: Stable carbon isotope fractionation by marine phytoplankton in response to day length, growth rate and CO2availability, Mar. Ecol. Progr. Ser., 184, 31–41, 1999.
20
Carpenter, S. R., Cole, J. J., Hodgson, J. R., Kitchell, J. F., Pace, M. L., Bade, D., Cottingham, K. L., Houser, J. N., and Schindler, D. E.: Trophic cascades, nutrients, and lake productivity: whole-lake experiments, Ecological Monographs, 71, 163–186, 2001.
Cassar, N., Laws, E. A., Bidigare, R. R., and Popp, B. N.: Bicarbonate uptake by Southern Ocean phytoplankton, Global Biogeochemical Cycles, 18, 2, Art. No. GB2003, 2004.
25
Chorus, I. and Bartram, J.: Cyanobacteria in the environment; organization, function and be-havior In Toxic cyanobacteria in water, WHO, UK, 1999.
Cole, J. J., Pace, M. L., Carpenter, S. R., and Kitchell, J. F.: Persistence of net heterotrophy in lakes during nutrient addition and food web manipulations, Limnol. Oceanogr., 45, 1718– 1730, 2000.
30
France, R. and Cattaneo, A.: δ13C variability of benthic algae: effects of water color via modu-lation by stream current, Freshw. Biol., 39, 617–622, 1998.
BGD
2, 997–1031, 2005
Isotope analysis of a biomanipulated shallow turf lak B. M. Bontes et al. Title Page Abstract Introduction Conclusions References Tables Figures J I J I Back Close
Full Screen / Esc
Print Version Interactive Discussion
EGU
Goericke, R., Montoya, J. P., and Fry, B.: Physiology of isotopic fractionation in algae and cyanobacteria, in: Stable isotopes in ecology, edited by: Lajitha, K. and Michener, B., Black-well Sci. Publ. Inc., Cambridge, 187–221, 1994.
Gons, H. J., Burger-Wiersma, T., Otten, J. H., and Rijkeboer, M.: Coupling of phytoplankton and detritus in a shallow, eutrophic lake (Lake Loosdrecht, The Netherlands), Hydrobiol.,
5
233, 51–59, 1992.
Gulati, R. D. and DeMott, W. R.: The role of food quality for zooplankton: remarks on the state-of-the-art, perspectives and priorities, Freshw. Biol., 38, 753–768, 1997.
Gulati, R. D. and van Donk, E.: Lakes in the Netherlands, their origin, eutrophication and restoration: state-of-the-art review, Hydrobiol., 478, 73–106, 2002.
10
Hanson, P. C., Pollard, A. I., Bade, D. L., Predick, K., Carpenter, S. R., and Foley, J. A.: A model of carbon evasion and sedimentation in temperate lakes, Global Change Biology, 10, 1285–1298, 2004.
Herczeg, A. L. and Fairbanks, R. G.: Anomalous carbon isotope fractionation between atmo-spheric CO2and dissolved inorganic carbon induced by intense photosynthesis, Geochim.
15
et Cosmochim. Acta., 51, 895–899, 1987.
Hosper, H. and Meijer, M.: Biomanipulation, will it work for your lake? A simple test for the assessment of chances for clear water, following drastic fish-stock reduction in shallow, eu-trophic lakes, Ecological engineering, 2, 63–72, 1993.
Ibelings, B., Maberly, S. C.: Photo inhibition and the availability of inorganic carbon restrict
20
photosynthesis by surface blooms of cyanobacteria, Limnol. Oceanogr., 43, 408–419, 1998. Jeppesen, E., Jensen, J. P., Søndergaard, M., Lauridsen, T., Pedersen, L. J., and Jensen, L.: Top-down control in freshwater lakes, the role of nutrient state, submerged macrophytes and water depth, Hydrobiol., 342/343, 151–164, 1997.
Jeppesen, E., Sondergaard, Ma., Søndergaard, M., and Christoffersen, K.: The structuring
25
role of submerged macrophytes in lakes, Ecological studies, Springer Verlag, 131, 131–423, 1998.
Keller, K., and Morel, F. M. M.: A model of carbon isotopic fractionation and active carbon uptake in phytoplankton, Mar. Ecol. Progr. Series, 182, 295–298, 1999.
Keough, J. E., Sierzen, M., and Hagley, C.: Analysis of a Lake Superior coastal food web with
30
stable isotopes, Limnol. Oceanogr., 41, 136–146, 1996.
Kerner, M., Ertl, S., and Spitzy, A.: Trophic diversity within the planktonic food web of the Elbe Estuary determined on isolated individual species by13C analysis, J. Plankt. Res., 26,
BGD
2, 997–1031, 2005
Isotope analysis of a biomanipulated shallow turf lak B. M. Bontes et al. Title Page Abstract Introduction Conclusions References Tables Figures J I J I Back Close
Full Screen / Esc
Print Version Interactive Discussion
EGU
1039–1048, 2004.
Kling, G. W., Fry, B., and O’Brien, W. J.: Stable isotopes and planktonic trophic structure in arctic lakes, Ecology, 73, 561–566, 1992.
Kott, P.: Modified whirling apparatus for sub sampling of plankton, Austr. J. Mar. and Freshwat. Res., 4, 387–393, 1953.
5
Laws, E. A., Popp, B. N., Bidigare, R. R., Kennicutt, M. C., and Macko, S. A.: Dependence of phytoplankton carbon isotopic composition on growth rate and [CO2)aq]: Theoretical consid-erations and experimental results, Geochim. et Cosmochim. Acta, 59, 1131–1138, 1995. LaZerte, B. D. and Szalados, J. E.: Stable carbon isotope of submerged freshwater
macro-phytes, Limnol. Oceanogr., 27, 413–418, 1982.
10
Leggett, M. F., Servos, M. R., Hesslein, R., Johannsson, O., Miljard, E. S., and Dixon, D. G.: Biogeochemical influences on the carbon isotope signatures of Lake Ontario biota, Can. J. Fish. Aquat. Sci., 56, 2211–2218, 1999.
Meijer, M. and Hosper, H.: Effects of biomanipulation in the large and shallow Lake Wolderwijd, The Netherlands, Hydrobiol., 342/343, 335–349, 1997.
15
Meijer, M., de Boois, I., Scheffer, M., Portielje, R., and Hosper, H.: Biomanipulation in shallow lakes in the Netherlands: an evaluation of 18 case studies, Hydrobiol., 408/409, 13–30, 1999.
Middelburg, J. J., Barranguet, C., Boschker, H. T. S., Herman, P. M. J., Moers, T., and Heip, C. H. R.: The fate of intertidal microphytobenthos carbon: An in situ13C-labeling study, Limnol.
20
Oceanogr., 45, 1224–1234, 2000.
Miyajima, T., Yamada, Y., and Hanba, Y. T.: Determining the stable isotope ratio of total dis-solved inorganic carbon in lake water by GC/C/IRMS, Limnol. Oceanogr., 40, 994–1000, 1995.
Mook, W. G., Bommerson, J. C., and Staverman, W. H.: Carbon isotope fractionation between
25
dissolved bicarbonate and gaseous carbon dioxide, Earth Planet. Sci. Lett., 22, 169–176, 1974.
Moss, B., Stansfield, J., Irvine, K., Perrow, M., and Phillips, G.: Progressive restoration of a shallow lake: A 12-year experiment in isolation, sediment removal and biomanipulation, J. Appl. Ecol., 33, 71–86, 1996.
30
Pace, M. L., Cole, J. J., Carpenter, S. R., Kitchell, J. F., Hodgson, J. R., Van de Bogert, M. C., Bade, D. L., Kritzberg, E. S., and Bastviken, D.: Whole-lake carbon-13 additions reveal terrestrial support of aquatic food webs, Nature, 427, 240–243, 2004.
BGD
2, 997–1031, 2005
Isotope analysis of a biomanipulated shallow turf lak B. M. Bontes et al. Title Page Abstract Introduction Conclusions References Tables Figures J I J I Back Close
Full Screen / Esc
Print Version Interactive Discussion
EGU
Pel, R., Hoogveld, H., and Floris, V.: Using the hidden isotopic heterogeneity in phyto- and zooplankton to unmask disparity in trophic carbon transfer, Limnol. Oceanogr., 48, 2200– 2207, 2003.
Pel, R., Floris, V., and Hoogveld, H.: Analysis of planktonic community structure and trophic in-teractions using refined isotopic signatures determined by combining fluorescence-activated
5
cell sorting and isotope-ratio mass spectrometry, Freshw. Biol., 49, 546–562, 2004a. Pel, R., Floris, V., Gons, H. J., and Hoogveld, H. L.: Linking flow cytometric cell sorting and
compound-specific 13C-analysis to determine population-specific isotopic signatures and growth rates in cyanobacteria-dominated lake plankton, J. of Phycol., 40, 857–866, 2004b. Petersen, C. G. J.: The yearly immigration of young plaice into the Limfjord from the German
10
Sea, Rep. Dan. Biol. Stn., 6, 1–48, 1896.
Peterson, B. J. and Fry, B.: Stable isotopes in ecosystem studies, Ann. Rev. Ecol. Syst., 18, 293–320, 1987.
Popp, B. N., Laws, E. A., Bidigare, R. R., Dore, J. E., Hanson, K. L., and Wakeham, S. G.: Effects of phytoplankton cell geometry on carbon isotopic fractionation, Geochim. et
Cos-15
mochim. Acta., 62, 69–77, 1998.
Prieto, F. J. and Millero, F. J.: The values of pK1+ pK2for the dissociation of carbonic acid in seawater, Geochim. et Cosmochim. Acta., 66, 2529–2540, 2002.
Rau, G. H.: Carbon-13 depletion in a subalpine lake: carbon flow implications, Science, 201, 901–902, 1978.
20
Rijkeboer, M., De Kloet, W. A., and Gons, H. J.: Interspecific variation in pigmentation: impli-cations for production estimates for shallow eutrophic lakes using an incubator, Hydrobiol., 238, 197–202, 1992.
Rohrlack, T., Henning, M., and Kohl, J. G.: Does the toxic effect of Microcystis aeruginosa on Daphnia galeata depend on microcystin ingestion rate?, Archiv. f. Hydrobiologie, 146,
25
385–395, 1999.
Rounick, J. S. and Winterbourn, M. J.: Stable carbon isotopes and carbon flow in ecosystems, Bioscience, 36, 171–177, 1986.
Shapiro, J.: Blue-Green algae: why they become dominant, Science, 179, 382–384, 1972. Scheffer, M.: Ecology of Shallow Lakes, Chapman and Hall, London, 357 pp., 1998.
30
Schindler, D. E., Carpenter, S. R., Cole, J. J., Kitchell, F., and Pace, M. L.: Influence of food web structure on carbon exchange between lakes and the atmosphere, Science, 277, 248–251, 1997.
BGD
2, 997–1031, 2005
Isotope analysis of a biomanipulated shallow turf lak B. M. Bontes et al. Title Page Abstract Introduction Conclusions References Tables Figures J I J I Back Close
Full Screen / Esc
Print Version Interactive Discussion
EGU
Sierszen, M. E., Morrice, J. A., Moffett, M. F., and West, C. W.: Benthic versus planktonic foundations of three Lake Superior coastal wetland food webs, J. Great Lakes Res., 30, 31–43, 2004.
Søndergaard, M., Jensen, J. P., and Jeppesen, E.: Role of sediment and internal loading of phosphorus in shallow lakes, Hydrobiol., 506–509, 135–145, 2003.
5
Steiner, C. F.: Daphnia dominance and zooplankton community structure in fishless ponds, J. Plank. Res., 26, 799–810, 2004.
Van den Meersche, K., Middelburg, J. J., Soetaert, K., van Rijswijk, P., Boschker, H. T. S., and Heip, C. H. R.: Carbon-nitrogen coupling and algal-bacterial interactions during an experi-mental bloom: Modeling a13C-tracer experiment, Limnol. Oceanogr., 49, 862–878, 2004.
10
Van Donk, E., Grimm, M. P., Heuts, P. G. M., Blom, G., Everards, K., and Van Tongeren, O. F. R.: Use of mesocosms in a shallow eutrophic lake to study the effects of different restoration measures, Arch. Hydrobiol. Beh., 40, 283–294, 1994.
Veuger, B., Middelburg, J. J., Boschker, H. T. S., and Houtekamer, M.: Analysis of 15N in-corporation into D-alanine: A new method for tracing nitrogen uptake by bacteria, Limnol.
15
Oceanogr. Methods, 3, 240–250, 2005.
Welschmeyer, N. A. and Lorenzen, C. J.: Carbon-14 labeling of phytoplankton carbon and chlorophyll a carbon: Determination of specific growth rates, Limnol. Oceanogr., 29, 135– 145, 1984.
BGD
2, 997–1031, 2005
Isotope analysis of a biomanipulated shallow turf lak B. M. Bontes et al. Title Page Abstract Introduction Conclusions References Tables Figures J I J I Back Close
Full Screen / Esc
Print Version Interactive Discussion
EGU
Table 1. Several environmental variables for the three treatments; water chemistry variables
are annual means based on regular measurements from February–December 2003. Ranges are the minimal and maximal values observed during this period.
− FW − W R
Mean Range N Mean Range N Mean Range N
Secchi depth (cm−1) 85 65–100 19 65 35–90 19 65 30–90 19 CO2(ppmv) 2267 0.7–10152 19 1974 255–8379 19 951 72–2266 19 CO2(mM/L) 100.9 0.03–371 19 91.4 10.5–485 19 45.7 2.4–185.5 19 O2(% saturation) 89.0 40.8–158 17 83.8 48.5–133.8 17 95.4 58.5–146.1 17 P (mg P+ PO−4/L) 0.10 0.05–0.2 16 0.15 0.06–0.3 17 0.14 0.07–0.2 17 N (mg N/L) 1.70 0.8–2.5 15 1.69 0.3–2.7 15 2.03 1.1–3.8 15 Chla (mg/L) 26.0 1.7–48.2 18 40.0 6.5–87.4 18 57.8 5.5–119 18 pH 7.6 6.3–10.4 19 7.4 6.3–8.1 19 7.8 7.3–8.6 19 Temperature (◦C) 15.2 2.9–24.5 19 15.4 2.8–25.2 19 15.8 3.7–25.9 19 Eukaryotes (nr.cells/mL) 26402 2092–103850 17 54770 9033–144834 18 48569 9909–116213 18 Cyanobacteria (nr.cells/mL) 16298 1922–88653 17 52500 9813–174135 18 86070 12303–287593 18
BGD
2, 997–1031, 2005
Isotope analysis of a biomanipulated shallow turf lak B. M. Bontes et al. Title Page Abstract Introduction Conclusions References Tables Figures J I J I Back Close
Full Screen / Esc
Print Version Interactive Discussion
EGU
Table 2. Zooplankton densities at the 3 locations during 2003. (a) Sum of zooplankton
individu-als (n/L), per group and per key species. Cladocera include the species Bosmina and Daphnia and rotifers species from the genus Keratella, Filinia, Polyarthra and Trichocerca. Cyclopoid nauplli and adult cyclopoids are considered separately, because of their different diet; (b) total zooplankton numbers per month (n/L) (average of two counts per month).
− FW − W R (a) Total nr. yr−1 12904 29992 31276 Cladocera 1965 6411 2688 Cyclopoida 3111 3832 2666 Nauplii 7533 10655 9105 Rotifera 14168 42401 50576 Bosmina 869 5176 1589 Ceriodaphnia 899 703 600 Chydorus 77 301 285 D.cuculata 32 197 182 Asplanchna 933 2930 1001 Polyphemus 86 6 16 (b) February 391 624 273 March 1178 1667 1449 April 1767 3765 3392 May 1313 2980 1844 June 1927 4773 4554 July 3181 2676 6342 August 2162 7585 4038 September 739 5207 6335 November 248 715 3050
BGD
2, 997–1031, 2005
Isotope analysis of a biomanipulated shallow turf lak B. M. Bontes et al. Title Page Abstract Introduction Conclusions References Tables Figures J I J I Back Close
Full Screen / Esc
Print Version Interactive Discussion
EGU
Table 3. Mean fractionation (ε) for the specific fatty acids (FA) per algal group, per
treat-ment, using CO2(aq) as C-source. For the green algae, cyanobacteria, Microcystis and flab/macroalgae groups the C18:n FA was used, whilst for diatoms the species specific C20:5 FA was used.
Note: Epsilon values were corrected for the offset between fatty acids and total cell carbon content, by adding 9‰ to the δ13C values (according to Pel et al., 2004a).
Location Algal group mean e SE
− FW Diatoms 22.4 1.4 Green algae 19.7 1.1 Cyanobacteria 11.4 2.8 Flab 3.9 3.8 − W Diatoms 23.4 1.4 Green algae 21.7 1.0 Cyanobacteria 17.8 1.4 Microcystis 17.6 0.8 Flab 4.5 0.7 R Diatoms 22.6 3.1 Green algae 19.9 1.9 Cyanobacteria 20.8 1.1 Microcystis 14.9 0.7