Comparison between different 1RM prediction tests in
submaximal load for the usage of a future smartwatch app
Fulfillment of the requirements for the
«Master of Science in Sports with Specialization in Teaching»
submitted by: Raphael Erni (11-124-047)
at the
University of Freiburg, Switzerland Faculty of Mathematics and Natural Sciences
Department of Medicine
in cooperation with
Swiss Federal Institute of Sports Magglingen SFISM
supervisor:
PD Dr. Silvio Lorenzetti
advisor: Fabian Lüthy
Acknowledgement
This master thesis was conducted at the Institute of Sport and Human Movements Sciences at the University of Fribourg in cooperation with the Swiss Federal Institute of Sports Mag-glingen and supervised by PD Dr. Lorenzetti Silvio. Hereby, I would like to thank him for his exceptional help when it came to his great advice, his quick responses to my questions and for always showing me the right direction whenever I needed it.
I would also like to thank my advisor Fabian Lüthy for supporting me with good references and helping me when I needed some extra guidance.
Furthermore, I would like to thank Dominik Huber which took his precious time to explain the process of his master thesis to me in depth and showing me how the app and the smart-watch worked. He was always just a phone call away for some really good advice.
I would also like to word my appreciation to Ravi Sinnathamby, Niklaus Jud and Marielle Kunz for letting me use their gym facility and equipment and helping me find suitable test subjects.
Similarly important for the final touch of this thesis were Dr. Samuel Iff, Samuel Böringer, Pascal Stegmann and Cherelle Oestringer for proofreading my thesis, helping with statistical questions and giving me constructive feedback.
Finally, I must also express my very profound gratitude to my parents and siblings for always giving me the needed motivation, support and encouragement throughout this project. I would not have accomplished this thesis, without their help and support.
Table of content
Acknowledgement ... 2
Abstract ... 4
1 Introduction ... 5
1.1 1RM predictions ... 7
1.2 Velocity based training ... 11
1.3 Huber’s strength training app ... 13
1.4 The objective of the thesis ... 15
2 Methods ... 16
2.1 Experimental Approach to the Problem ... 16
2.2 Subjects ... 16
2.3 Equipment and Resources ... 16
2.4 Procedures ... 18 2.5 Data Analysis ... 19 2.6 Statistical Analyses ... 19 3 Results ... 21 3.1 Subjects ... 21 3.2 1RM predictions ... 21
3.3 Detection accuracy of the app ... 27
4 Discussion ... 30
4.1 1RM predictions ... 30
4.2 Detection accuracy of the app ... 31
4.3 Limitations ... 34
4.4 Implications ... 34
5 Conclusion ... 36
References ... 37
List of figures and tables ... 45
Appendix ... 48
List of abbreviations ... 48
Subject group ... 49
Abstract
OverviewResearch has shown that there is a fundamental importance of quantification of the maximum load that can be lifted through a full range of motion, when it comes to the design of re-sistance training programs. Furthermore, workout assistants that can track your rere-sistance training through wrist worn devices have shown to be quite accurate when it came to exercise recognition and repetition counting but needed improvement on the integration of a one repe-tition maximum (1RM) estimation.
Research Question
The primary aim for this master thesis was to find out which parameters of the load-velocity or reps-to-fatigue relationship formula showed the best accuracy for the 1RM estimation of the exercises barbell bench press, barbell back squat and barbell deadlift. The secondary aim focused on validating the accuracy of a previously developed strength training app and on its functions of exercise recognition, repetition counting and 1RM estimation.
Methods
A subject group consisting of recreationally trained athletes (N = 30) performed 4 sets of up to 10 repetitions with an increasing submaximal load (60 – 80 % of predicted 1RM) for each exercise, wearing an Apple watch with an integrated strength training app and having the GymAware Power Tool attached to the bar to collect data.
Results
The adapted formula of Jovanović and Flanagan (2014) and Epley (1985) showed the best correlations in all three exercises. Regarding the app’s functions, there was an 88.4 % overall correct exercise recognition and an insignificant correlation (p = 0.06) between the true and the recognized repetition counting.
Conclusion
The adapted velocity parameters VPeak and MVT used by Jovanović and Flanagan (2014)
showed the best relationship compared to Epley's (1985) formula and, therefore, propose to be integrated into the strength training app. Moreover, the application showed high accuracy with the exercise recognition and decently reliable results with the repetition counting. Future work has to be put into improving the detection of weight displacement of the Apple Watch
1 Introduction
In the 21st century chronic diseases, such as the four main non-communicable diseases
(NCDs), namely cardiovascular diseases, cancer, respiratory diseases and diabetes, are epi-demic worldwide (World Health Organization, 2018). Even children are now more than ever suffering from obesity, diabetes and metabolic syndromes (Federal Office of Public Health (FOPH), 2016; Robert Koch-institut, 2018; World Health Organization, 2017). Furthermore, the World Health Organization (WHO) even stated that «physical inactivity, now recognized as an increasingly important determinant of health, is the result of a progressive shift of life-style towards more sedentary patterns» (World Health Organization, 2003, p. 6). The WHO also noted that, even though, the global risk of «dying from any one of the four main NCDs between ages 30 and 70 decreases from 22 % in 2000 to 18 % in 2016» (World Health Organization, 2018, p. 7), an acceleration of progress towards reducing key risk factors is required, in order to meet the 2015 adopted Sustainable Development Goals (SDG) number 3:
Good Health and Well-being. Even in Switzerland the four main NCDs cancer (women 45.1
%, men 29.3 %), cardiovascular diseases (women 10.5 %, men 16.6 %), chronic respiratory diseases (women 3.2 %, men 2.8 %) and diabetes (women 0.9 %, men 1.2 %) accounted for two-thirds of all deaths (Federal Office of Public Health (FOPH), 2016) and for 80 % of healthcare costs (CHF 700 billion in 2013). It is also reported in the 2015 National Health Report (Schweizerisches Gesundheitsobservatorium, 2015), that some 2.2 million people suf-fer from a NCD, which include cancer, heart attacks and strokes (cardiovascular diseases), asthma and chronic obstructive lung disease (chronic respiratory diseases), diabetes and dis-orders of the musculoskeletal system (e.g., osteoarthritis, arthritis, osteoporosis, soft tissue rheumatism and back complaints). The later ones are mostly «influenced by lifestyle: over-weight, a lack of physical activity, as well as poor diet, excessive alcohol consumption, smok-ing and stress» (Federal Office of Public Health (FOPH), 2016, p. 6). A variety of sources have documented a mitigation of progression and even a reversion of existing chronic diseas-es through physical activity and diet interventions (Roberts & Barnard, 2005). Physical activi-ties can contribute to weight loss, through the creation of a negative energy balance (Alexander, 2002), which is the result when energy intake is lower than energy expenditure. Aerobic exercises that enhance respiratory and circulatory efficiency have a bigger impact on direct caloric expenditure compared to resistance training (Alexander, 2002). Nevertheless, the effects of resistance training towards increasing fat-free mass that results in the increase of the resting metabolic rate (RMR) is just as important, as RMR accounts of about 70 % of dai-ly energy expenditure (American College of Sports Medicine, 2017). This means that on the long run, increasing your muscle mass through resistance training shows to be highly
benefi-cial when it comes to boosting your energy output. Furthermore, it is also important to note that resistance training does not just promote muscular hypertrophy but shows great welfare for general health (Federal Office of Public Health (FOPH), 2016), if it is implemented and executed correctly.
Resistance training has to be properly introduced, individually adapted to the people’s need and, therefore, conducted by a fitness instructor, a personal trainer or a workout assistant de-vice. On the one hand, fitness instructors mostly do not have the time nor the knowledge to thoroughly track and individualize the intensity of every workout. On the other hand, personal trainers are very expensive and, hence, are not the best solution for the broader and general public. This brings us to the importance of workout assistant devices, that can track your physical activities through Human Activity Recognition (HAR).
HAR has been the ever-increasing focus of many research studies in the last 20 years (Bulling, Blanke, & Schiele, 2014), due to the raised interest in proactively assisting users in their activities. Their usage has gone from originally being developed for the entertainment sector (Nintendo Wii, Microsoft Kinect) (Crouter, Flynn, & Bassett, 2015; Velloso, Bulling, Gellersen, Ugulino, & Fuks, 2013) to having found further use in the industrial sector (SKODA production facilities) (Maurtua, Kirisci, Stiefmeier, Sbodio, & Witt, 2007), office scenarios and in the fields of fitness and rehabilitation (Kunze et al., 2006; Ladha, Hammerla, Olivier, & Plötz, 2013; Minnen, Westeyn, Starner, Ward, & Lukowicz, 2006). Wrist-worn systems have been developed and tested to automatically recognize physical activities. With the help of accelerometers, global positioning system (GPS) trackers and heart rate / pulse recognition many wrist-worn systems can be used for repetitive aerobic exercises such as walking and running (Trost, Zheng, & Wong, 2014) and have already been successfully intro-duced to the market (Pernek, Kurillo, Stiglic, & Bajcsy, 2015). But when it comes to tracking resistance training with ubiquitous wrist-worn devices further investigations are still needed (Bleser et al., 2015).
Recently a new strength training iOS app called Strength Control for the Apple Watch and iPhone has been developed (Huber, 2017). This project was conducted due to the need of a wrist-worn system that can monitor and recognize human activities in strength training and not having to buy an additional tool for that recognition. But also due to the increasing inter-est in smartphones (Kranz et al., 2013; Shoaib, Bosch, Incel, Scholten, & Havinga, 2014) and smartwatches (Shoaib, Bosch, Incel, Scholten, & Havinga, 2016) that now have integrated inertial sensor types (accelerometers and gyroscopes) and fast increasing computational pow-er (Incel, Kose, & Ersoy, 2013). With an implementation of motion recognition algorithms,
used on the Apple Watch, workout tracking can be made available to a broader spectrum of athletes and fitness professionals. This show the overall importance of further researching the topic of 1RM, which Huber (2017) has already mentioned needs further investigation.
1.1 1RM predictions
Research has shown that there is a fundamental importance of quantification of the maximum load that can be lifted through a full range of motion when it comes to the design of resistance training programs (Fleck & Kraemer, 2014; Sayers, Schlaeppi, Hitz, & Lorenzetti, 2018). Maximum load can be seen as an indicator for strength, which forms together with muscular size and power the three main effects of resistance training. There are numerous acute training variables that have been identified and utilized for resistance training program designs, such as exercise type and order, intensity or load, number of repetitions and reps, and rests between sets (Jovanović & Flanagan, 2014), number of exercise interventions, duration of the experi-mental period, fractional and temporal distribution of the contraction modes per repetition and duration, time under tension, volitional muscular failure and recovery time in-between exer-cise sessions (Toigo & Boutellier, 2006). The magnitude and type of physiological responses and the adaptations to resistance training can be shaped through the manipulation of these variables. One of the most important stimulus is the exercise intensity or load, which has been generally identified with relative load (González-Badillo & Sánchez-Medina, 2010; Jovanović & Flanagan, 2014). Relative load is commonly understood as percentage of one-repetition maximum (% of 1RM), which has typically two different methods for its measurements. When trainers identify the athlete’s 1RM values for each exercise used in their training pro-gram through direct 1RM assessments, it is commonly referred to as the direct method (Jovanović & Flanagan, 2014). This method faces a number of issues such as the effect of athletes experience, technique, fatigue and motivation on the outcome, the time consumption (McMaster, Gill, Cronin, & McGuigan, 2014) as well as the temporary deterioration of the function of the tested muscles (Niewiadomski, Gąsiorowska, Cybulski, Laskowska, & Langfort, 2008) and the «degree of concern over risk of musculoskeletal injury when the sys-tem if subjected to such high loads» (Mann, Stoner, & Mayhew, 2012, p. 2623). Contrarily, the indirect method using predictive models such as performing reps to fatigue or using the movement velocity is a much more simple, safe and accurate procedure to estimating the 1RM load (Carroll, Sato, Bazyler, Triplett, & Stone, 2017; González-Badillo & Sánchez-Medina, 2010; Jidovtseff, Harris, Crielaard, & Cronin, 2011; LeSuer, McCormick, Mayhew, Wasserstein, & Arnold, 1997; L. Sánchez-Medina, González-Badillo, Pérez, & Pallarés, 2014; Luis Sánchez-Medina, Pallarés, Pérez, Morán-Navarro, & González-Badillo, 2017;
Sayers et al., 2018). Table 1 gives an overview of the analyzed 1RM prediction formulas for this thesis. The first formula is based on Reps-to-Fatigue (Epley, 1985) and is followed by two Load-Velocity relationship formulas (Jovanović & Flanagan, 2014; Sayers et al., 2018) with their corresponding adaptations.
Table 1
An overview of the analyzed 1RM prediction formulas and the abbreviations used to simplify further reading
Author Abbr. Formula
Epley (1985) Epley %1RM = weight lifted / (1.0278 - (0.0278 * No. of reps)) %1RM = weight lifted * (36 / (37 - No. of reps))
Jovanović & Flanagan (2014) %1RM = m(Velocity) + b ± Z(SEE)
%1RM = slopeVMean*MVT + interceptVMean ± Z(SEE)
VPeak method based on
Jovanović & Flanagan (2014) Jovanović %1RM = slope
VPeak * MVT + interceptVPeak
Sayers et al. (2018) %1RM = "#$%&'(.*(+,'*.-./( ∗ 100
VMean5 method based on
Sayers et al. (2018) Sayers %1RM = -100 * intercept
VMean5 / slopeVMean5
Notes. Abbr. = abbreviations of terms, which are used for the graphs; weight = total weight used in [kg]; reps = total reps performed; Z = represents the desired level of confidence (LOC); slope = steepness of the linear regression; MVT = minimum velocity threshold; intercept = the place where the line crosses the y-axis; Vpeak = peak bar velocity; Vmean = average bar velocity; VMean5 = the average velocity of the first 5 performed repetitions
To predict the 1RM with submaximal load Jovanović and Flanagan (2014) created a prescrip-tion of performing up to 3 reps in 5 consecutive sets (2-3 reps @ 30-40 % 1RM, 2 reps @ 40-50 % 1RM, 1-2 reps @ 60-70 % 1RM, 1 rep @ 70-80 % 1RM and 1 rep @ 80-85 % 1RM). Their formula used Vmean and was adapted to VPeak in order to fit the used method in this
the-sis. In addition, Jovanović and Flanagan (2014) also used the «regression line and associated parameters such as slope and intercept point on the Y axis» (Jidovtseff et al., 2011, p. 267) and combined them with previously analyzed minimum velocity thresholds (MVT) for the barbell bench press (BBP) and the barbell back Squat (BBSq). «MVT is the mean concentric velocity produced on the last successful repetition of a set to failure performed with maximal lifting effort» (Jovanović & Flanagan, 2014, p. 61). It can be claimed that the MVT «remains stable regardless of strength level and is true irrespective of the number of reps performed» (Turner, 2017), as there is no significant difference between the average MVT performed dur-ing the last repetition of sets at 75 %, 70 %, 65 % and 60 % of 1RM (Izquierdo et al., 2006). Jidovtseff et al. (2011) also discussed that MVT have shown to be exercise specific. Table 2-4 shows an overview of different MVT according to different authors for each of the tested
ex-Table 2
Summary of the minimal velocity threshold (MVT) for the BBP exercise (adapted from Baker, 2017) categorized into author, exact exercise performed, description of subjects (number, sports type and bodyweight), strength capacity (1RM) and concluded MVT
author exercise description subjects strength capacity velocity at 1RM (i.e., MVT [m/s]) BARBELL BENCH PRESS
(González-Badillo &
Sánchez-Medina, 2010) (isoinertial) concentric bench press on a smith machine 120 strength-trained males; 78.3 kg bodyweight 1RM = 87.8 ± 15.9 kg 0.16 ± 0.04 (Helms et al., 2017) bench press according to the rules of
the International Powerlifting Federa-tion (IPF)
15 experienced powerlifters 12 male @ 87.9 ± 16.3 kg 3 female @ 59.0 ± 5.8 kg
1RM = 114.94 ± 24.63 kg 0.10 ± 0.04 (Izquierdo et al., 2006) concentric bench press (1cm above
chest) on a smith machine 36 male Basque ball players; 80 kg bodyweight 1RM = 91 ± 17 kg 0.17 ± 0.04 @75 % 0.15 ± 0.03 0.18 ± 0.05 @70 % 0.18 ± 0.05 @65 % 0.17 ± 0.06 @60 % (Jidovtseff et al., 2011) concentric bench press (3cm above
nipple line) on a smith machine 112 mixed subjects; 72 ± 14 kg bodyweight 1RM = 60 ± 19 kg 0.23 ± 0.09 (Ormsbee et al., 2017) free weight touch & go bench press 13 college-aged novice benchers;
82.3 kg bodyweight 1RM = 89.5 kg 0.20 ± 0.05
(Ormsbee et al., 2017) free weight touch & go bench press 14 college-aged experienced benchers;
90.2 kg bodyweight
1RM = 133.0 kg 0.14 ± 0.04
(Pallarés, Sánchez-Medina, Pérez, De La Cruz-Sánchez, & Mora-Rodriguez, 2014)
smith machine paused (2s) bench
press 17 resistance-trained athletes 81.4 kg bodyweight 1RM = 89.1 kg 0.22 (Pallarés et al., 2014) free weight touch and go bench press 17 resistance-trained athletes
81.4 kg bodyweight 1RM = 92.1 kg 0.19
(L. Sánchez-Medina et
al., 2014) (isoinertial) concentric bench press on a smith machine 75 male junior and senior nation-al-level athletes (wrestling, canoe-ing, rowing or judo)
76.0 ± 8.8 kg bodyweight
1RM = 90.3 ± 16.3 kg 0.17
Table 3
Summary of the minimal velocity threshold (MVT) for the BBSq exercise (adapted from Baker, 2017) categorized into author, exact exercise performed, description of sub-jects (number, sports type and bodyweight), strength capacity (1RM) and concluded MVT
author exercise description subjects strength capacity velocity at 1RM (i.e., MVT [m/s]) BARBELL BACK SQUAT
(Carroll et al., 2017) high bar back squat on force platform 14 recreationally trained males;
88.2 ± 15.8 kg bodyweight 0.28 ± 0.07
(Conceição, Fernandes, Lewis, Gonzaléz-Badillo, & Jimenéz-Reyes, 2015)
smith machine paused (3-4s) full squat 15 male track and field athletes;
70.1 ± 14.5 kg bodyweight 1RM = 124.2 ± 26.6 kg 0.30 ± 0.04 (Helms et al., 2017) barbell back squat according to the
rules of the International Powerlifting Federation (IPF)
15 experienced powerlifters 12 male @ 87.9 ± 16.3 kg 3 female @ 59.0 ± 5.8 kg
1RM = 172.41 ± 32.84 kg 0.23 ± 0.05 (Izquierdo et al., 2006) parallel back squat on smith machine 36 male Basque ball players;
80 kg bodyweight 1RM = 200 ± 20 kg 0.31 ± 0.06 @75 % 0.27 ± 0.02 0.32 ± 0.07 @70 % 0.31 ± 0.06 @65 % 0.33 ± 0.07 @60 % (Pallarés et al., 2014) smith machine paused (2s) squat (PSq)
smith machine squat (Sq) 17 resistance-trained athletes 81.4 kg bodyweight 1RM = 90.3 kg PSq = 0.37 Sq = 0.39
(Turner, 2017) box squat 12 professional rugby players 0.25 ± 0.03
(Zourdos et al., 2016) back squat 14 novice squatters
training age: 0.4 ± 0.6 years 80.3 kg bodyweight
1RM = 91.2 kg 0.34
(Zourdos et al., 2016) back squat 15 experienced squatters training age: 5.2 ± 3.5 years 91.6 kg bodyweight
1RM = 171.9 kg 0.24 ± 0.04
Table 4
Summary of the minimal velocity threshold (MVT) for the BDL exercise categorized into author, exact exercise performed, description of subjects (number, sports type and bodyweight), strength capacity (1RM) and concluded MVT
author exercise description subjects strength capacity velocity at 1RM (i.e., MVT [m/s]) BARBELL DEADLIFT
(Helms et al., 2017) deadlifts according to the rules of the International Powerlifting Federation (IPF)
15 experienced powerlifters 12 male @ 87.9 ± 16.3 kg 3 female @ 59.0 ± 5.8 kg
1.2 Velocity based training
In order to understand the importance of MVT, VBT has to be discussed more thoroughly. VBT belongs together with Flexible Periodization, Auto-regulatory Progressive Resistance Exercise, Rating of Perceived Exertion (RPE) and Hearth Rate Variability (Fisher, 2016) to the common methods of auto-regulation and will be used for further analyses in this thesis. It is based upon the common understanding that «as the load of a given lift increases (and max-imal intent to lift it as fast as possible is applied), the speed at which it moves decreases in a linear fashion» (Turner, 2017). A number of researchers have stated that the relationship be-tween load and mean concentric velocity is extremely stable and very strong in the simple strength exercises bench press and back squat (González-Badillo & Sánchez-Medina, 2010; Jidovtseff et al., 2011). On account of commercially available linear position transducers (LPT) (such as the GymAware, T-FORCE or the Tendo Power), the «velocity of lifting can now be easily and reliably measured in many basic strength training exercises» (Jovanović & Flanagan, 2014, p. 59). The three LPT mentioned above were thoroughly studied on their reli-ability and validity of the parameters Vmax, Vmean and t Vmax (Lorenzetti, Lamparter, & Lüthy, 2017). Their findings for the evaluation of squat performance at different squatting speeds suggest that all three LPT devices are reliable. «In particular, the parameters Vmean and t Vmax
can be used to monitor and guide workouts» (Lorenzetti et al., 2017, p. 4). The Root Mean Square Error (RMSE) of Vmax was in traditional squats (RMSE between 0.151 and 0.194) as
well as ballistic squats (RMSE between 0.263 and 0.315) larger than the other parameters and indicates its value being a less robust measure.
1.2.1 Benefits and disadvantages of VBT. It is important to know that the application of the velocity-based approach involves different levels of implementation in contrast to an all-or-nothing implementation (Jovanović & Flanagan, 2014) and can, therefore, be used together with a percent-based periodization program. For example, the 1RM can be estimated from sub-maximal loads using the velocity-based approach and then be implemented into a re-sistance training program that uses percent-based variables. 1RM predictions from sub-maximal loads show big advantages to 1RM predictions from direct methods as already men-tioned in chapter 1.1 (Carroll et al., 2017; Jidovtseff et al., 2011; Sanchez-Medina, Perez, & Gonzalez-Badillo, 2010; Luis Sánchez-Medina et al., 2017; Sayers et al., 2018). Furthermore, those 1RM predictions can be done on a more regular basis without interfering the periodiza-tion or compromising injuries or even be done daily with the help of LPT. LPT that have the possibility of displaying live feedback on current movements have shown to be beneficial towards athletes’ performances, if they are already intrinsically motivated to reach a target
velocity measurement (Jovanović & Flanagan, 2014; Kilduski & Rice, 2003; Randell et al., 2011). This live feedback, if properly implemented into one’s resistance training, can also be used as a method of auto-regulation that optimizes training and avoids under- and overtrain-ing (Fleck & Kraemer, 2014). Auto-regulation of trainovertrain-ing accordovertrain-ing to the athletes readiness level for each training session can be performed through adjustments of load and the number of sets and repetitions (Jidovtseff et al., 2011) and holds a beneficial factor against traditional periodization of resistance training programs that solely rely on a periodical measurement of the athlete’s 1RM.
Another benefit of VBT is that maximal concentric velocity is encouraged (Fisher, 2016; Jovanović & Flanagan, 2014; Turner, 2017). This is most profitable for power athletes, con-tact sports, throwing events (e.g. shot put and hammer throw) and weightlifters (McMaster et al., 2014; Singh, 2016) who have a limited window to apply the maximal amount of force. As powers equals the product of multiplying force by velocity, «increasing the velocity will in-crease the power output of the exercise without needing to inin-crease or dein-crease the load if one is capable of doing so» (Fisher, 2016, p. 3). Completing an explosive movement with a max-imum effort forces the neurons to select the fast twitch motor units first. This phenomenon is called selective recruitment (Datta & Stephens, 1981; Lin & Chen, 2012) and suggests the understanding that motor units with high activation thresholds (type IIa and type IIx fast twitch motor units) are activated before the motor units with lower activation thresholds (type I slow twitch motor units). The selective recruitment phenomenon stands opposite the Hen-neman’s size principle (Henneman, 1957). Henneman demonstrated that as the level of force increases motor units were recruited in order of increasing size. Even though Henneman’s findings were based on working with anesthetized cats, his fundamentally important finding was later strongly confirmed by Milner-Brown, Stein, and Yemm (1973). Their results «pro-vide the first direct e«pro-vidence that motor units are recruited during increasing voluntary con-traction in an orderly fashion according to the size of concon-traction they produce» (p. 367). As already mentioned, an athlete using VBT would therefore benefit from directly targeting the type IIa and type IIx fast twitch motor units. At the same time those two principles show a disadvantage of the VBT, especially regarding the regulation of muscular hypertrophy, as training to complete muscle failure is not encouraged through the constant focus on maximal concentric velocity.
Through the constant focus on maximal concentric velocity an individual strength quality profile for each athlete can be concluded, analyzed and further used for comparisons of differ-ent athletes (Turner, 2017). This holds a big benefit compared to solely relying on 1RM tests.
different velocities in submaximal loads, which may show significant importance for their programming and transferring their performances onto the field. It is therefore of utmost im-portance to thoroughly comprehend the athletes’ purpose on the field and then properly adjust their work load, performance output and ultimately their programming.
As can be seen by now, another factor which has to be taken into account is the time used for proper adjustments of the training and the programming. The LPT have to be studied careful-ly and understood in depth before being used with a group of athletes. Furthermore, as the costs of LPT are already high, the chances of having more than one LPT to one’s disposal is rare. Therefore, a focus has to be set on a specific exercise, as the time for the preparation, installation and dismounting of the equipment also has to be taken into consideration. All this depends on the group size and the exercises being tested. The high costs of LPT cause a major disadvantages for VBT, which is the reason why Lorenzetti et al. (2017) suggested that future research should focus on «more valid and reliable devices for a cheaper prize» (p. 4). Hence, the next chapter focuses on Huber’s findings (Huber, 2017) and his strength training app.
1.3 Huber’s strength training app
Huber’s thesis (Huber, 2017) was based on account of the following four statements, that chronic diseases will cause the biggest health care expenses in the future (Fleck & Kraemer, 2014; Seeger, Buchmann, & Van Laerhoven, 2011; World Health Organization, 2018), that even regular and moderate physical activity would reduce the rate of different chronic disees (Carroll et al., 2017), that physical activity can be supported and promoted by workout as-sistants (Seeger et al., 2011), that various aerobic workout asas-sistants have already been suc-cessfully introduced on the market compared to the lack of strength training workout assis-tance (Pernek, Hummel, & Kokol, 2013). Hence, his thesis focused on four main objectives. First of all, he developed a workout analysis application using a recognition algorithm that can be used for the Apple Watch and iPhone and, therefore, drops the costs for an additional LP. He used a recognition algorithm that was developed and provided by FocusMotion. This algorithm was fully integrated into the watchOS and showed high functionality despite being in an early development stage. The weight could be entered through the Digital Crown on the smartwatch right after the set and further corrected on the iPhone App once imported. The same goes for the recognized exercise and repetition counting. If the exercise or the per-formed repetitions were not accurate, they could as well be changed with the help of the Digi-tal Crown.
In his second objective, he determined the accuracy of the exercise recognition and repetition counting. The data was collected with a reduced sample size of one male sports student and
showed an overall exercise recognition error with a low mean of 3.49 %error, a median of 0.00 %error and a high standard deviation (SD) of 18.46 %error. The tested exercises were biceps curl with twist, barbell biceps curl, dumbbell lateral raise, barbell bench press and bar-bell back squat, each performed with either 5 or 10 repetitions. His findings showed a high accuracy of exercise recognition comparable to other authors that had 2.0 %error with 9 exer-cises (Zhang et al., 2016), 2.3 %error with 3 exerexer-cises (SooHyun & SooWon, 2016), 7.0 %er-ror with 12 exercises (Guo, Liu, & Chen, 2016) and 44.2 %er%er-ror with 30 exercises (Koskimäki & Siirtola, 2016). The overall repetition counting %error (N = 83) showed a low mean of 0.92 %error and a low median of 0.00 %error, which can be partly explained due to neutralization of positive and negative values. The RMSE was not calculated, but the results showed a high SD of 21.74 %error. His findings have shown again comparable results to a 1.0 %error with 5 exercises (Pernek et al., 2013) and 2.0 %error with 6 exercises (Zhang et al., 2016). Huber concluded that, even though, his implemented recognition algorithm has shown a high accuracy in exercise detection and repetition counting and can be used as an accurate method to log workouts, further investigation with a larger sample size has to be conducted. For the third objective, Huber then implemented an estimation for the 1RM, as most research that used smartwatches for exercise recognition (Guo et al., 2016; Koskimäki & Siirtola, 2016; SooHyun & SooWon, 2016; Zhang et al., 2016) and repetition counting (Pernek et al., 2013; Zhang et al., 2016) did not include that. The estimate 1RM was calculated with a for-mula that uses the velocity parameter Vmean (Sayers et al., 2018). Two different testings of 5
sets each of 60 % and 80 % of the 1RM, that was determined with the direct method, were then conducted and compared solely performing the barbell bench press. The results for the 60 % 1RM estimation have shown a mean of 0.28 %error with a SD of 1.70 %error and for the 80 % 1RM estimation a mean of 7.80 %error and a SD of 28.19 %error. The explanation for those results were based on possible imprecise execution and the fact of it being a low sample size. Huber also states that one of the biggest limitations of using the velocity parame-ter with the smartwatch was that it «is calculated by a non-alparame-terable distance leading to wrong data if the user has a different height or does not use the same range of motion» (p. 63). Nev-ertheless, Huber concluded a successful implementation of the 1RM estimation for the barbell bench press exercise and suggested further investigation with other exercises and a larger sample size.
Huber’s fourth and last objective of developing and implementing a muscle fatigue parameter was not thoroughly concluded and will not be taken into consideration in this thesis.
1.4 The objective of the thesis
The primary aim of this thesis, was the comparison of different 1RM prediction methods that use either load-velocity relationship measurements or reps-to-fatigue relationship measure-ments as shown in detail in table 1 and which can be implemented into the strength training app. Hereby, the research question was:
a) Which load-velocity or reps-to-fatigue formula and which parameters are the most suitable for a future strength training app integration?
As to this point, the app has only been tested by one test subject. Hence, the secondary aim of this thesis will be on analyzing the validity, reliability and accuracy of the app’s functions and the quality of results with a broader subject group and additional exercises. The data will be compared with the results of the LPT GymAware PowerTool, that has already been tested on its validity in many research studies (Dorrell, Moore, Smith, & Gee, 2018; Orange et al., 2018; Turner, 2017). Other wearables and smartphone-based technologies (Balsalobre-Fernández, Kuzdub, Poveda-Ortiz, & Campo-Vecino, 2016; Balsalobre-Fernández et al., 2017) have also been testing their data with the same means. The results will be presented in %error and the tested parameters will be exercise recognition, repetition counting and 1RM
prediction with the exercises barbell bench press, barbell back squat and barbell deadlift.
Therefore, the asked research questions were:
b) Does the app give accurate readings on the parameter exercise recognition with all three exercises compared?
c) Does the app give accurate readings on the parameter repetition counting compared to real life performances?
d) How precise are the 1RM predictions of the app compared to the load-velocity or reps-to-fatigue approach by Jovanović and Flanagan (2014), Sayers et al. (2018) and Epley (1985)?
2 Methods
2.1 Experimental Approach to the Problem
As Jidovtseff et al. (2011) suggested, in order to predict 1RM from AV-load relationship, AV was measured at 4 increasing loads, starting with a light load. The MVT used for the adapted formula of Jovanović and Flanagan (2014) are 0.15 for BBP, 0.25 for BBSq and 0.3 for BDL as the subject group consists of recreationally resistance-trained males and females and not specifically Powerlifters, which tend to show lower MVT values.
2.2 Subjects
The analyzed subject group consisted of 30 (16 female, 14 male) physically healthy athletes (Mage = 28.4, SD = 6, range 19 – 41, Table 6) with a heterogeneous history of strength training
(Mtraining = 4.8 years, SD = 3.9, range 0.5 – 17, Table 6) and all participating in their own
weight training program 1 - 4 days a week. The detailed physical characteristics are presented in Table 7 with mean and SD. The sample size of 30 subjects comes from a recommendation for correlational studies that relate variables (Creswell, 2012). The subjects were found through posts on the facility’s platform and by E-mail to the Bachelor students of the Univer-sity of Bern, the UniverUniver-sity of Fribourg and the Swiss Federal Institute of Sports Magglingen and they volunteered to take part in this study. All subjects were informed of the nature of the study and signed an informed consent. The Cantonal Research Ethics Commission of Bern, Switzerland approved this study (project-ID: 2016.01970).
2.3 Equipment and Resources
The material used consisted of an Apple Watch Sports 1st Generation, iPhone 6s, MacBook
Pro, iPad Air, GymAware PowerTool, a standard olympic barbell (20kg = 44lbs), weight plates (5 - 20kg = 11 - 44lbs), measuring tape (for the body height), body scale (for the body weight). The Apple Watch Sports 1st Generation was connected to an iPhone 6s with the iOS
11.4.1. The GymAware PowerTool was attached with the Velcro Strap around the bar accord-ing to the instructions of the manufactures, so a perpendicular angle was achieved duraccord-ing all lifts and was then paired through Bluetooth to an iPad Air. Both the iPhone and the iPad had the corresponding App (GymAware, v2.5.1, ©2014-18 Kinetic Performance Technology Pty Ltd and Strength Control, v1.8, Betatester) for data acquisition installed.
The data was collected at either the UNIK Training1 gym facility in Bern, the ZSSw gym2 at
the Center of Sports and Sport Sciences of the university of Bern or at the athletive Training3
gym facility in Thun.
Fig. 1. Measurement devices as used for the three exercises: (1) Apple Watch Sports, (2) GymAware PowerTool
Fig. 2. Exemplary interface of the GymAware App for the iPad with an athlete performing a set of 10 repetitions on the barbell benchpress. The most typically seen velocity curve can be observed with the peak velocity occur-ing duroccur-ing the first five reps.
1 UNIK Training, Bolligenstrasse 82, CH-3006 Bern
2 ZSSw gym, Center of Sports and Sport Science, Bremgartenstrasse 145, CH-3012 Bern 3 athletive Training – Functional Training Thun, Gewerbestrasse 15, CH-3600 Thun
1 1 1 2 2 2
2.4 Procedures
All 30 subjects performed the three exercises in the following order: barbell deadlift, barbell bench press, barbell back squat. They performed 4 consecutive sets with increasing loads (adopted from Jidovtseff et al., 2011) that corresponded to 60 – 80 % of their estimated 1RM. The goal for each set was to perform no more than 10 repetitions (Reynolds, Gordon, & Robergs, 2006) . If the subject’s estimated 1RM was way off, an additional fifth set was per-formed until fatigue during the 10 reps was occurring. Subjects were allowed adequate rest (3-5 minutes) between each set (Nimphius, Mcguigan, & Newton, 2012; Shimano et al., 2006). The exercise instructions (Huber, 2017) were given to the subjects as shown in Table 5.
Table 5
The measurement process with the corresponding tasks and exercise instruction
Task/Exercise Instruction
Pre-Measurement
Instruction 1
The measurement process is described and explained to the subject and the consent form is signed. The subject gives his estimated 1RM for each exercise
Preparation
The subject changes clothes and gets ready for the individual warm up of around 10 minutes on the rower or bike.
Meanwhile, the warm up set weight for the deadlift is prepared and the GymAware is attached to the Barbell.
Instruction 2 The Apple watch is mounted on the subject’s left wrist.
Measurement
Preparation BDL The subject performs his/her warm up set and the GymAware and the Apple watch are being tested if they are sending data.
BDL
“Stand in front of the loaded barbell about hip width apart. Keep your back straight and bend your knees to reach forward to grab the bar using a shoulder-width grip. Hold the bar and start the lift by pushing with your legs while keeping your torso as upright as possible. Keep the shoulder blades back as you do this. On top, hold the weight for a second with locked hips and knees. Return to the starting position by lowering the weights to the floor.”
4 Sets; 10 reps max or till failure; 3-5 min break in between sets Preparation BBP The subject performs his/her warm up set and the GymAware and the
Apple watch are being tested if they are sending data.
BBP
“Lie back on a flat bench with your eyes under the bar. Grab the bar at about shoulder width. Unrack the bar by straightening your arms and position it directly above your chest. Slowly lower the bar to your
ing the bar back to the starting position.”
4 Sets; 10 reps max or till failure; 3-5 min break in between sets Preparation BBSq The subject performs his/her warm up set and the GymAware and the
Apple watch are being tested if they are sending data.
BBSq
“Use a squat rack and a straight bar to perform this exercise. Position the bar on your back, resting on your trapezius muscles. Hold the bar on both sides as you lower yourself into a squat position. Keep your back straight and let your knees go out in direction of your toes. As you come up keep your butt from going outward but instead keep your back straight. You don't want to bend forward as you extend your legs to return to starting position.”
4 Sets; 10 reps max or till failure; 3-5 min break in between sets
Post-Measurement
Dismissal
The subject is given the results from the Epley (1985), Brzycki (1993) and the Jovanović and Flanagan (2014) method and is informed about the further research process. In addition, the subject’s personal data (age, weight and height) is collected.
Hygiene The watch is disinfected and put back on the loading station to make sure the watch is ready for the next subject.
Data Transfer The data from the Apple watch is sent to the iPhone and then trans-ferred to the Excel.
2.5 Data Analysis
Data was sampled through the iPad Air that is connected to the GymAware PowerTool and through the iPhone 6 that is connected to the Apple Watch Sport. Microsoft® Excel for Mac, version 16.20, enabled data analysis, storage of information and instantaneous presentation of results. The 1RM calculation was done through Epley’s formula (1985) using submaximal load.
2.6 Statistical Analyses
To express the accuracy of the exercise recognition, repetition counting and 1RM prediction the standard error estimate (SEE) was calculated as follows:
!"" = %∑(()(*),
-The numerator is the sum of squared differences between the actual scores (Y) and the pre-dicted scores (Y1). The denominator is the sample size (N). For each exercise the linear
re-gression line of the relationship between the predicted 1RM methods is plotted through the known load1 (X) and known load2 (Y) values. From these linear regressions the intercept (b),
slope (a) and the coefficient of determination (R2) are calculated. In addition, a two-sample
paired t-test was used to show the significance level with the chosen statistical significance threshold of 0.05. Furthermore, the magnitudes of the relationships between the predicted 1-RMs were interpreted using Pearson correlation coefficients, described as low (0.1-0.3), mod-erate (0.3-0.5), high (0.5-0.7) and very high (0.7-0.9) (Cohen, 1988; Hopkins, 2002; McGraw & Wong, 1992) and the Root Mean Square Error (RMSE) was used to measure how much error there is between each data set of 1RM predictions.
./!" = %∑314*(01)21),
5
where f is the predicted score (from the app) and the o is the observed score (true value). The line above the squared differences indicates the mean.
3 Results
3.1 SubjectsThe recruitment lasted from September till November 2018 and the data was collected be-tween October and November 2018 at one of the three previously mentioned locations (see chapter 2.4 Resources).
Table 6
Physical characteristics (mean ± SD) for the overall subject group and for the two sex (M = male, F = female)
and their corresponding predicted 1RM using the method of Epley (1985)
Variable Total (N = 30) Men (N = 14) Women (N = 16) Age (years) 28.4 ± 6.0 28.1 ± 6.5 28.6 ± 5.8
Height (cm) 1.72 ± 0.09 1.79 ± 0.06 1.67 ± 0.07
Weight (kg) 72.3 ± 15.7 84.6 ± 13.2 61.9 ± 8,1
BMI 24.1 ± 3.4 26.5 ± 3.3 22.0 ± 1.8
Years of training experience 4.8 ± 3.9 6.8 ± 4.8 3.1 ± 1.7
1RMBBP (kg) 70.6 ± 34.5 96.5 ± 36.9 43.9 ± 7.6
1RMBBSq (kg) 116.0 ± 42.2 143.2 ± 50.6 84.8 ± 19.9
1RMBDL (kg) 126.5 ± 47.7 154.3 ± 61.1 94.3 ± 20.4
Notes. SD = standard deviation; BMI = body mass index; 1RMBBP = predicted 1 repetition maximum for the barbell bench press;
1RMBBSq = predicted 1 repetition maximum for the barbell back squat; 1RMBDL = predicted 1 repetition maximum for the barbell deadlift
3.2 1RM predictions
The individual results and their predictions are shown in the appendix. The correlations of the three formulas are listed in the following chapter separated by exercise. All graphs have been standardized to the same maximal weight on the axes. To simplify the reading Jovanović and Flanagan (2014) was abbreviated as Jovanović and Sayers et al. (2018) to Sayers.
3.2.1 1RM predictions for the barbell bench press.
Table 7
Correlation data between 1RM predictions of the three methods (Epley, 1985; Jovanović & Flanagan, 2014; Sayers et al., 2018) for the barbell bench press
b a R2 RMSE p r
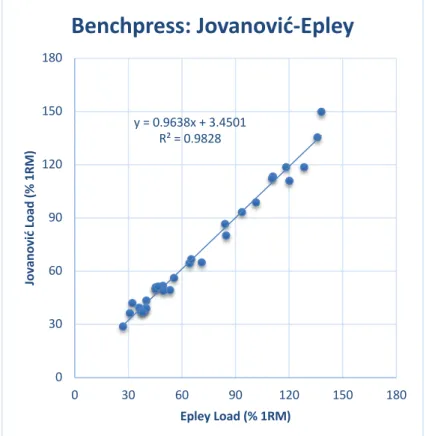
Jovanović - Epley 3.4501 0.9638 0.9828 3.49 0.29 0.99
Sayers - Epley 1.8475 1.0501 0.9731 6.95 <0.01 0.99
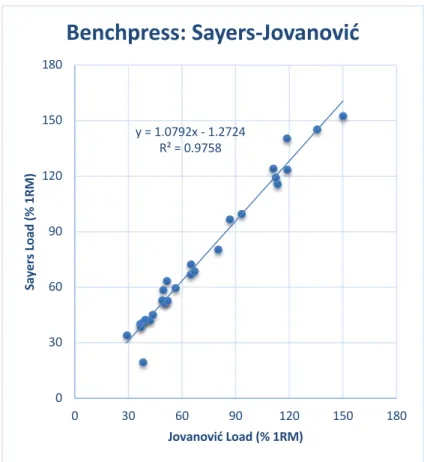
Sayers - Jovanović -1.2724 1.0792 0.9758 5.69 <0.01 0.99
Notes. b = intercept, a = slope, R2 = coefficient of determination, RMSE = root mean square error, p = probability of paired t-test for
Fig. 3. Scatter plot with correlation between 1RM predictions attained from the (Epley, 1985) method and the adap-tation of the method suggested by (Jovanović & Flanagan, 2014) for the barbell bench press exercise.
Fig. 4. Scatter plot with correlation between 1RM predictions attained from the (Epley, 1985) method and the adapted (Sayers et al., 2018) method for the barbell bench press exercise.
y = 0.9638x + 3.4501 R² = 0.9828 0 30 60 90 120 150 180 0 30 60 90 120 150 180 Jo va no vi ć Lo ad (% 1 RM ) Epley Load (% 1RM)
Benchpress: Jovanović-Epley
y = 1.0501x + 1.8475 R² = 0.9731 0 30 60 90 120 150 180 0 30 60 90 120 150 180 Sayer s Lo ad (% 1 RM ) Epley Load (% 1RM)Benchpress: Sayers-Epley
Fig. 5. Scatter plot with correlation between 1RM predictions attained from the adaptation of (Jovanović & Flanagan, 2014) method and the adapted (Sayers et al., 2018) method for the barbell bench press exercise.
3.2.2 1RM predictions for the barbell back squat.
Table 8
Correlation data between 1RM predictions of the three methods (Epley, 1985; Jovanović & Flanagan, 2014; Sayers et al., 2018) for the barbell back squat
b a R2 RMSE p r
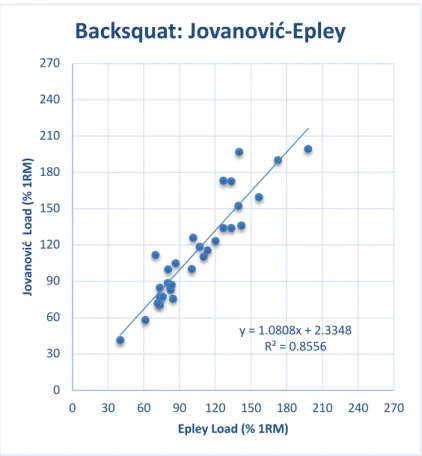
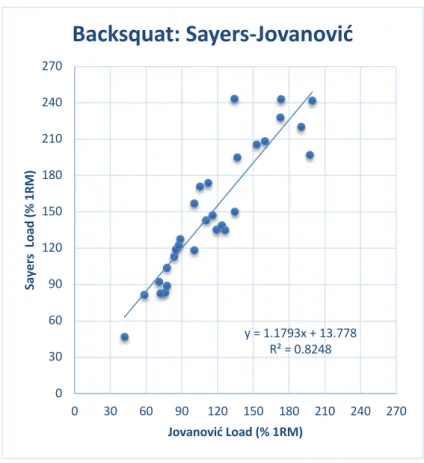
Jovanović - Epley 2.3348 1.0808 0.8556 12.15 <0.01 0.93 Sayers - Epley 18.3320 1.2574 0.6868 45.48 <0.01 0.91 Sayers - Jovanović 13.7780 1.1793 0.8248 34.58 <0.01 0.83
Notes. b = intercept, a = slope, R2 = coefficient of determination, RMSE = root mean square error, p = probability of paired t-test for
differ-ence; r = Pearson correlation coefficient
y = 1.0792x - 1.2724 R² = 0.9758 0 30 60 90 120 150 180 0 30 60 90 120 150 180 Sayer s Lo ad (% 1 RM ) Jovanović Load (% 1RM)
Benchpress: Sayers-Jovanović
Fig. 6. Scatter plot with correlation between 1RM predictions attained from the (Epley, 1985) method and the adap-tation of the method suggested by (Jovanović & Flanagan, 2014) for the barbell back squat exercise.
Fig. 7. Scatter plot with correlation between 1RM predictions attained from the (Epley, 1985) method and the adapted (Sayers et al., 2018) method for the barbell back squat exercise.
y = 1.0808x + 2.3348 R² = 0.8556 0 30 60 90 120 150 180 210 240 270 0 30 60 90 120 150 180 210 240 270 Jo va no vi ć Lo ad (% 1 RM ) Epley Load (% 1RM)
Backsquat: Jovanović-Epley
y = 1.2574x + 18.332 R² = 0.6868 0 30 60 90 120 150 180 210 240 270 0 30 60 90 120 150 180 210 240 270 Sayer s Lo ad (% 1 RM ) Epley Load (% 1RM)Backsquat: Sayers-Epley
Fig. 8. Scatter plot with correlation between 1RM predictions attained from the adaptation of (Jovanović & Flana-gan, 2014) method and the adapted (Sayers et al., 2018) method for the barbell back squat exercise.
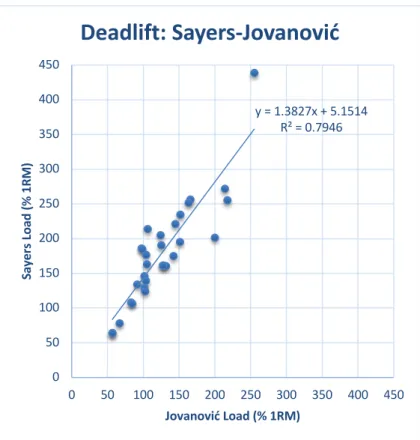
3.2.3 1RM predictions for the barbell deadlift.
Table 9
Correlation data between 1RM predictions of the three methods (Epley, 1985; Jovanović & Flanagan, 2014; Sayers et al., 2018) for the barbell deadlift
b a R2 RMSE p r
Jovanović - Epley 10.0060 0.9908 0.8309 14.90 0.02 0.91 Sayers - Epley 33.7060 1.2448 0.5451 63.09 <0.01 0.89 Sayers - Jovanović 5.1514 1.3827 0.7946 53.57 <0.01 0.74
Notes. b = intercept, a = slope, R2 = coefficient of determination, RMSE = root mean square error, p = probability of paired t-test for
differ-ence; r = Pearson correlation coefficient
y = 1.1793x + 13.778 R² = 0.8248 0 30 60 90 120 150 180 210 240 270 0 30 60 90 120 150 180 210 240 270 Sayer s L oad (% 1 RM ) Jovanović Load (% 1RM)
Backsquat: Sayers-Jovanović
Fig. 9. Scatter plot with correlation between 1RM predictions attained from the (Epley, 1985) method and the adap-tation of the method suggested by (Jovanović & Flanagan, 2014) for the barbell deadlift exercise.
Fig. 10. Scatter plot with correlation between 1RM predictions attained from the (Epley, 1985) method and the adapted (Sayers et al., 2018) method for the barbell deadlift exercise.
y = 0.9908x + 10.006 R² = 0.8309 0 50 100 150 200 250 300 350 400 450 0 50 100 150 200 250 300 350 400 450 Jo va no vi ć Lo ad (% 1 RM ) Epley Load (% 1RM)
Deadlift: Jovanović-Epley
y = 1.2448x + 33.706 R² = 0.5451 0 50 100 150 200 250 300 350 400 450 0 50 100 150 200 250 300 350 400 450 Sayer s Lo ad (% 1 RM ) Epley Load (% 1RM)Deadlift: Sayers-Epley
Fig. 11. Scatter plot with correlation between 1RM predictions attained from the adaptation of (Jovanović & Flana-gan, 2014) method and the adapted (Sayers et al., 2018) method for the barbell deadlift exercise.
3.2.4 MVT. The minimum velocity threshold (MVT) for the barbell bench press was the low-est with 0.16 ± 0.05, followed by the barbell back squat with 0.35 ± 0.09 and the barbell deadlift with 0.45 ± 0.13. The barbell deadlift has the biggest range of results.
Table 10
Average, SD and range of minimum velocity threshold for every exercise
N = 30 BBP BBSq BDL
M 0.16 0.35 0.45
SD 0.05 0.09 0.13
Range 0.08 – 0.28 0.22 – 0.56 0.27 – 0.81
Notes. N = number of subjects; M = average; SD = standard deviation; Range = range of results (spreading of data); BBP = barbell bench press; BBSq = barbell back squat; BDL = barbell deadlift
3.3 Detection accuracy of the app
3.3.1 Exercise recognition. Overall 88.4 % of all performed sets (N = 363) were recognized with the correct exercise. Most accurate was the BBP exercise with 96.5 % followed by BDL with 92.2 % and the BBSq with 76.5 %. Table 11 gives a more detail overview concerning the different exercises. The confusion matrix in Table 12 reveals tendencies in mistaking different exercises. y = 1.3827x + 5.1514 R² = 0.7946 0 50 100 150 200 250 300 350 400 450 0 50 100 150 200 250 300 350 400 450 Sayer s Lo ad (% 1 RM ) Jovanović Load (% 1RM)
Deadlift: Sayers-Jovanović
Table 11
Exercise recognition accuracy of the three exercises
N TRUE FALSE % TRUE % FALSE
BBP 119 115 4 96.5 % 3.5 %
BBSq 121 98 23 76.5 % 23.5 %
BDL 124 115 9 92.2 % 7.8 %
total 363 327 36 88.4 % 11.6 %
Notes. N = number of values; TRUE = correctly recognized exercises; FALSE = wrong recognition of exercise; BBP = barbell bench press; BBSq = barbell back squat; BDL = barbell deadlift
Table 12
Confusion matrix of the exercise recognition task. The number in the matrix indicates number of true exercise recognized as predicted exercise
predicted N = 363 BBP BBSq BDL DL LR GSq Sm TKB N/A tr ue BBP 115 3 1 BBSq 98 2 7 1 13 BDL 1 115 1 2 5
Notes. N = number of values; BBP = barbell bench press; BBSq = barbell back squat; BDL = barbell deadlift; DL = dumbbell lunges; LR = lateral raises; GSq = Goblet Squat; Sm = Superman; TKB = triceps kickbacks; N/A = no exercise was detected, analyzing screen kept show-ing
3.3.2 Repetition counting. The overall repetition counting has shown to have an insignificant difference and a moderate positive relationship between the true repetition counting and the recognized repetition counting (p-value of 0.06, r of 0.40). The results have also shown that there is a significant difference (p-value of 0.01) between the true and the recognized repetiti-on counting for the BBP.
Table 13
Repetition counting accuracy of the three exercises
N TRmean RRmean RMSE p r
BBP 118 8.84 ± 2.01 9.44 ± 3.15 1.36 ± 2.16 0.01 0.61
BBSq 108 9.47 ± 1.20 9.31 ± 4.09 2.51 ± 3.08 0.68 0.24
BDL 119 9.41 ± 1.54 9.97 ± 3.80 2.57 ± 2.47 0.09 0.37
total 345 9.23 ± 1.59 9.58 ± 3.67 2.14 ± 2.56 0.06 0.40
Notes. N = number of values; TR = true repetition counting; RR: recognized repetition counting; RMSE = root mean square error; p = t-test; r = Pearson correlationcoefficients
3.3.3 1RM prediction from the smart watch application. Due to the low number of pre-dicted 1RMs, the precision of the prediction was not being calculated.
Table 14
1RM predictions as taken from the app, categorized in attempts, predictions and % of successful attempts
N attempts of prediction predicted % of successful at-tempts
BBP 30 30 2 6.7 %
BBSq 30 30 1 3.3 %
BDL 30 30 3 10 %
total 90 90 6 8.9 %
Notes. N = number of values; BBP = barbell bench press; BBSq = barbell back squat; BDL = barbell deadlift
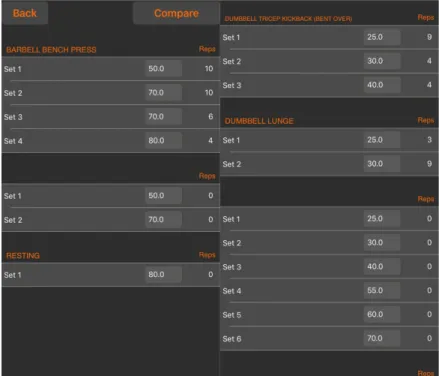
3.3.4 User interface of the app. Here are the two main interfaces of the strength training app from the iPhone, that show common errors and will be used for the discussion.
Fig. 12. The first interface of the app after launching it, showing the per-formed workouts with the date and time.
Fig. 13. This is the view of the app upon touching the workout with its closer details showing the performed exercises, the weights used and the repetitions performed.
4 Discussion
The following chapters firstly discuss the results of both aims and gives an overview of the findings. Then, the limitations of the method and the results for this thesis will be pointed out. To conclude this chapter, research and practical implications will be given.
4.1 1RM predictions
The overall results have shown that there is a probability of p < 0.01 that the differences be-tween any two 1RM prediction methods are by hazard. This indicates that the differences are significant and not just by coincidence. Only the comparison between the adapted methods of Jovanović and Flanagan (2014) based on load-velocity (%1RM = slopeVPeak * MVT +
inter-ceptVPeak) and the formula of Epley (1985) based on reps-to-fatigue (%1RM = weight lifted *
(36 / (37 - No. of reps)) for the barbell bench press exercise resulted in a p of 0.29, which is above the significance level of 0.05.
The coefficient of determination (R2) between the two formulas of Jovanović and Flanagan
(2014) and Epley (1985) was 0.9828 for the BBP, 0.8556 for the BBSq and 0.8309 for the BDL. Comparing those results with the other relationships we can also point out that the BBP had the overall best relationships between all three tested relationships, followed by the BBSq and ending with the BDL, which had the coefficient of determination of the lowest score. Fur-thermore, through guiding our viewpoint from the sum of squares total to the sum of squares error that can be seen in the RMSE value, the same results can be found. The RMSE of the BBP showed an overall smaller distribution of errors with values between 3.49 to 6.95 for all three relationships, compared to 12.15 to 45.48 for the BBSq and 14.90 to 63.09 for the BDL. Those results indicate a tendency towards a usage of Jovanović and Flanagan’s (2014) veloci-ty parameter VPeak and MVT for a future app implication. This implies that the user of the app
would have to perform each set with maximal velocity. Therefore, other options of 1RM es-timation should be integrated into the app, in order to broaden the spectrum of users. As dis-cussed in chapter 1.2.1 mostly power athletes, such a contact sports, throwing events and weightlifters, have a main interest in performing repetitions with a maximal concentric veloci-ty and could therefore get accurate results using this formula. Other more recreationally ori-ented athletes could still make usage of this feature, but at the same time should have the op-tion in the app to switch to Epley’s (1985) reps-to-fatigue formula. This could be included in the app’s overview menu, where bodyweight, body height and sex are already successfully integrated.
4.1.1 MVT. As explained in chapter 2.1 the MVT values used for the adapted Jovanović and Flanagan (2014) formula were 0.15 for BBP, 0.25 for BBSq and 0.3 for BDL. Those three values have shown to be the most successful in regards of the relationship to Epley’s (1985) formula. Nevertheless, I looked at the collected data for each exercise (N = 30) and deter-mined my own MVT values, which resulted in 0.16 for BBP, 0.35 for BBSq and 0.45 for BDL. Especially the MVT of 0.16 ± 0.05 for BBP can be compared with similar results from other authors, such as 0.15 ± 0.03 (Izquierdo et al., 2006; Turner, 2017), 0.16 ± 0.04 (González-Badillo & Sánchez-Medina, 2010) and 0.17 (L. Sánchez-Medina et al., 2014). All these authors share a similar subject group consisting of strength-trained athletes that have a 1RM between 88 and 91. The lower MVT values from the authors summarized in table 2 show an increased experience level of the athletes and also a more specific power oriented athlete group, such as powerlifters with an MVT of 0.10 ± 0.04 (Helms, 2013) and college-aged experienced benchers with an MVT of 0.14 ± 0.04 (Ormsbee et al., 2017). The MVT of 0.35 ± 0.09 for BBSq can only be compared with the results of Zourdos et al. (2016), who had an MVT of 0.34 testing back squats from novice squatters and Pallarés et al. (2014), who had an MVT of 0.37 for paused squats and 0.39 for regular squats using a smith machine. All other authors had smaller MVT values varying from 0.23 to 0.3. Those results would indicate that the tested subject group consisted of mainly novice squatters or that their squatting tech-nique was not the best, whereby, maximal concentric velocity could not be achieved. There was only one source (Helms et al., 2017) that looked at MVT for the BDL and they used ex-perienced powerlifters, which already indicates that their MVT value will most likely not be similar to the MVT of this subject group. Their MVT of 0.14 ± 0.05 was indeed much lower than my MVT of 0.45 ± 0.13. This big difference can be a result of the contrasting level of sports performances and experience in lifting.
4.2 Detection accuracy of the app
Likewise to its previous testing (Huber, 2017) non-laboratory conditions were used and, none-theless, the app showed an overall satisfying performance. Unfortunately, not all the sets gave conclusive data, as the smartwatch was sometimes stuck in a loop. Huber talked about similar lag problems that might have been caused by a too slow Apple S1 processor (CPU) of the Apple Watch 1st Generation.
4.2.1 Exercise recognition. The app’s algorithm achieved an overall exercise recognition accuracy of 88.4 %. The BBP was the most accurate measurement with low mean %error of -3.5 % followed by the BDL with a mean %error of -7.8 %. The BBSq exercise recognition was the most inaccurate with a high mean %error of -23.5 %, corresponding to almost ¼ of the measurements taken. Comparing those results with the previously concluded findings by Huber, we can see that his exercise recognition accuracy of 96.51 % was much higher. This could be explained through the usage of different exercises in Huber’s testings, such as the additionally utilized exercises barbell biceps curl, dumbbell biceps curl with twist and the dumbbell lunches, which performed almost perfect accuracy (1 out of 39 was wrong). Never-theless, the biggest difference is between the two BBSq accuracies. Huber had a BBSq (N = 16) mean %error of 0.00 % compared to 23.5 % of this thesis (N = 121). On the one hand, this could be explained through the big difference in sample size, but on the other hand, also due to the technical difficulties of BBSq including various lengths of ranges of motion. Further-more, out of these 23.5 % (N = 23) were 13 sets non-detectable. In other means, the smart-watch had a lag and was not able to process the data properly.
4.2.2 Repetition counting. Even though, the p-value of the BBSq and the BDL indicated an insignificant difference, having a look at the RMSE value revealed that the errors self-correct themselves through equaling out positive and negative results and are therefore just as inaccu-rate as the BBP results.
Comparing those results with the overall mean %error of 0.92 % from Huber, a big difference can be observed. Explanations for this big difference can be the relatively low sample size of Huber (N = 83) compared to this sample size (N = 345), but also the kind of exercise execu-tion in both tests. Huber did not explicitly focus on repetiexecu-tions with maximal concentric ve-locity or clear instructions on the execution speed. Therefore, the inaccurate repetition count-ing could also be due to the rapid concentric movements and non-standardization of the paus-es between the eccentric and concentric movements. As Pallarés et al. (2014) suggpaus-ested, may-be imposing a 2-s pause may-between the eccentric and concentric phases of each repetition would increase the reliability of isoinertial strength tests. He indicated that «the stop technique re-sulted in a significantly lower coefficient of variation for the whole load-velocity relationship compared to the standard one» (p. 1165). Maybe through lowering the coefficient of variation in load-velocity data readings by adding a clear instruction to the pauses, the implemented algorithm could execute the repetition counting more clearly and with a bigger precision.
4.2.3 1RM predictions. Transferring the data from the Apple watch to the App on the iPhone caused the most problems and disturbances. Only 8.9 % of attempts were successful and gave a 1RM prediction. The precision of 1RM predictions was due to its low number of predicted 1RMs not being calculated. There were two main issues. The first and more predominant issue was that the transfer of data caused problems with opening the app. Once the icon of the app was touched either nothing happened, or the app started launching and crashed within seconds. After repeated trials, the app on the iPhone had to be reinstalled, which also forced a reinstallation of the app on the Apple watch and in its process lost the collected data from the previous testing. The second issue was that, once the app actually opened, there were repeated workouts and sets, as seen in Fig. 12 and 13, that sometimes showed the wrong weights or did not count any repetitions. Deleting a whole workout or a single set did not cause any prob-lems, but there were issues with changing the weights or the reps of individual sets. Some-times the changes were possible without having the app lag or even crash, but then caused problems with saving the settings. In those cases, the 1RM predictions for the detected exerci-ses stayed on 0.
4.2.4 User interface. The user interface of the iPhone app was already discussed on the pre-vious chapter showing its issues with the lagging and the repetitive listings. Nonetheless, the overall appearance of the app and its structure was quite user friendly. The four main menus being History, Fatigue Index, Library and Settings were arranged logically and could defini-tely be operated by a broader public. Overall, the design, the choice of colors and the logo are great and serve as a solid foundation of the app. Nevertheless, it still needs some work and improvements in its data accuracy and data processing till it is ready for publication.
The user experience on the Apple watch was perceived very positively. Once the users got used to the Apple mechanics of touching, scrolling and waiting, the app did not show any major complications. However, there were some minor dissatisfactions that could easily be solved with some tweaks in the coding. Sometimes the display went black (sleep mode) after starting a set or after some repetitions and there was no way to observe the accuracy of the repetition counting and exercise detection. Throughout the testing there was no identifiable pattern of this incident. When asked about the user experience, some users were hoping for haptic feedback when using the Digital Crown, which could be implemented when adding the weights. Others asked for an audible tone when starting the workout, as there was a 3-5 sec-onds pause between the touching of the start button and the starting of the analyses screen and it was not clear through a visual or audible clue that this process has already started. This caused problems with impatient test subjects, as they repeatedly touched the start button.