HAL Id: hal-03183966
https://hal.archives-ouvertes.fr/hal-03183966
Submitted on 29 Mar 2021
HAL is a multi-disciplinary open access
archive for the deposit and dissemination of
sci-entific research documents, whether they are
pub-lished or not. The documents may come from
teaching and research institutions in France or
abroad, or from public or private research centers.
L’archive ouverte pluridisciplinaire HAL, est
destinée au dépôt et à la diffusion de documents
scientifiques de niveau recherche, publiés ou non,
émanant des établissements d’enseignement et de
recherche français ou étrangers, des laboratoires
publics ou privés.
Risk and vulnerability of Mongolian grasslands under
climate change
Banzragch Nandintsetseg, Bazartseren Boldgiv, Jinfeng Chang, Philippe
Ciais, Enkhbaatar Davaanyam, Altangerel Batbold, Tserenpurev Bat-Oyun,
Nils Stenseth
To cite this version:
Banzragch Nandintsetseg, Bazartseren Boldgiv, Jinfeng Chang, Philippe Ciais, Enkhbaatar
Davaanyam, et al.. Risk and vulnerability of Mongolian grasslands under climate change.
Envi-ronmental Research Letters, IOP Publishing, 2021, 16 (3), pp.034035. �10.1088/1748-9326/abdb5b�.
�hal-03183966�
Risk and vulnerability of Mongolian grasslands under climate change
To cite this article: Banzragch Nandintsetseg et al 2021 Environ. Res. Lett. 16 034035View the article online for updates and enhancements.
Environ. Res. Lett. 16 (2021) 034035 https://doi.org/10.1088/1748-9326/abdb5b OPEN ACCESS RECEIVED 29 March 2020 REVISED 30 November 2020 ACCEPTED FOR PUBLICATION 13 January 2021 PUBLISHED 25 February 2021 Original content from this work may be used under the terms of the
Creative Commons Attribution 4.0 licence. Any further distribution of this work must maintain attribution to the author(s) and the title of the work, journal citation and DOI.
LETTER
Risk and vulnerability of Mongolian grasslands under
climate change
Banzragch Nandintsetseg1,2,∗, Bazartseren Boldgiv1, Jinfeng Chang3,4, Philippe Ciais5,
Enkhbaatar Davaanyam2, Altangerel Batbold2, Tserenpurev Bat-Oyun2and Nils Chr. Stenseth6 1 Department of Biology, School of Arts and Sciences, National University of Mongolia, Ulaanbaatar, Mongolia 2 Information and Research Institute of Meteorology, Hydrology, and Environment, Ulaanbaatar, Mongolia 3 College of Environmental and Resource Sciences, Zhejiang University, Hangzhou, People’s Republic of China
4 Ecosystems Services and Management Program, International Institute for Applied Systems Analysis, Laxenburg, Austria 5 Laboratory for Sciences of Climate and Environment, UMR8212, CEA-CNRS-UVSQ, Gif Sur Yvette, France
6 Centre for Ecological and Evolutionary Synthesis, Department of Biosciences, University of Oslo, Oslo, Norway ∗
Corresponding author. E-mail:nandiad98@gmail.com
Keywords: drought, ecosystem, productivity, Mongolian grasslands, climate change Supplementary material for this article is availableonline
Abstract
Climate change is projected to increase the aridity of semi-arid ecosystems, including Mongolian
grasslands (MG), which provide ecosystem services that support food supply and pastoralist
lifestyle. Here, we conducted a grid-scale (0.5
◦× 0.5
◦) probabilistic risk assessment of MG under
climate change for 40 years (1976–2015) based on probability theory. We evaluated changes of risk
(impacts) and vulnerability of MG to drought between the recent two decades R20 = 1996–2015
and the previous two decades P20 = 1976–1995. The risk is quantified as the product of the
probability of hazardous drought and ecosystem vulnerability. The probability of hazardous
drought is defined from the Standardized Precipitation–Evapotranspiration Index. Vulnerability is
defined as the expected differences of key ecosystem variables between years with and without
hazardous conditions. The ecosystem variables are productivity (peak aboveground biomass, net
primary productivity, and leaf area index) and root-zone plant-available soil moisture, simulated
with a process-based vegetation model Organizing Carbon and Hydrology in Dynamic
Ecosystems-Grassland Management validated with field observations of biomass and soil moisture.
Results reveal that MG experienced more frequent hazardous droughts with rapid warming and
slight drying during R20 aggravated by ever-increasing grazing intensity (34% compared to P20),
which resulted in a reduction in soil water availability and grassland productivity, particularly in
northeastern areas (20%–65%). The risk of drought to productivity increased by 10% between P20
and R20 over extended areas, particularly in northcentral and northeast Mongolia. The increase in
the risk to MG was mainly caused by climate change-induced increase in the probability of
hazardous drought and, to a lesser extent, by the increasing vulnerability. Recent droughts modify
the risk to grasslands, particularly in northcentral and northeast Mongolia, suggesting that these
regions need strategic management for both adaptation and ecosystem conservation to cope with
climate change impacts.
1. Introduction
Climate change poses many challenges to global ecosystems, including grasslands, from increasing droughts and heatwaves, projected to become more frequent and intense [1–5]. Occupying approximately
one-quarter of the Earth’s land area, grasslands contribute to the feed base for grazing livestock, and food supply and livelihoods of more than 800 mil-lion people [6–8]. Their critical ecosystem services include biodiversity reserves and carbon sequestra-tion [9,10]. Despite the importance of grasslands,
there is mounting evidence that droughts and heat-waves may significantly affect the productivity and stability of grasslands [11–13] and potentially have feedback on atmospheric carbon dioxide (CO2)
con-centrations and climate [14].
Encompassing ∼2.6% of the global grass-lands [15, 16] and ∼80% of Mongolia’s territory (figure1(a)) [17, 18], Mongolian grasslands (MG) have been used by pastoralists for thousands of years [19]. Now it supports∼70 million livestock and live-lihoods of 29% of all working-age Mongolian popula-tion, contributing to∼15% of national GDP [20,21]. However, little attention has been paid to the climate-change-driven risks to MG. In recent decades, MG is facing widespread and frequent droughts [13,22,23] and warming [24], together with increasing grazing pressure due to the rapidly growing livestock popula-tion since the 1990s following socio-political changes [20,25,26]. This, in turn, affected the pastoralists’ livelihoods and food security in Mongolia, who rely directly on grassland production [27]. For instance, in the 2000s, an increase in the frequency and sever-ity of climate disasters (dzuds in Mongolian) caused massive livestock mortalities, which are caused by a combination of droughts and severe winters with extreme cold and heavy snowfall, limiting the availab-ility and accessibavailab-ility of pasture for livestock, thereby leading to high livestock mortality, often from star-vation [20,28].
Climate change-related risk assessment provides science-based information for risk management and decision-making. The terminology about cli-mate risks is not always consistent and depends on impacted variables [5,29–32]. Risks for ecosystems have generally been assessed using generic variables [33,34] given the lack of knowledge of ecosystem functioning thresholds [35, 36]. Under the United Nations [37], risk analyses were developed by dis-tinguishing hazard, vulnerability, and risk. Hazard is defined as the probability of a potentially damaging phenomenon within a given period and area. Vulner-ability refers to the sensitivity of the impacted system to those damaging conditions. Risk is commonly defined as an expected loss induced by hazardous conditions and calculated as the product of hazard and vulnerability. This framework is widely used in natural hazard and disaster risk reduction stud-ies [30,38]. To facilitate quantitative analysis, recent studies [36,39] made a further distinction between hazard as the potentially damaging phenomenon itself and the probability of the hazard occurring. The risk is zero if the likelihood of hazard or vulnerability is zero, and risk is only large when both components are large. A similar definition was recently used by the Intergovernmental Panel on Climate Change [5] as risk = probability of events or trends× consequences [5,12,31]. These definitions were primarily set up to facilitate risk analysis for hazards threatening human
Figure 1. (a) Grasslands in Eurasia and Africa, including MG (adapted and modified from 16 to 17, 18): Grassland without trees is the vegetation climax over most of the area (green) and human-modified grasslands (brown). (b) Ecozones (colored cells) and locations of stations (biomass and soil moisture measuring, brown dots) in Mongolia. (c) Climatology (1983–2015) of the growing season (May–August) total precipitation (P, mm) and mean air temperature (T,◦C). (d) Averaged (2000–2015) ground-observed AGB8obs(g m−2, colored symbols) with
the modeled AGB8mod(g m−2, background colors).
life, but they can be operational for ecosystem mod-eling. Furthermore, risk assessment has been based on historical data—assessing probabilities of hazards and impact based on experience from past events [20,39–41].
Probabilistic risk assessment (PRA) is frequently applied in ecology [42–44]. For quantitative risk ana-lysis, recent studies promoted an ecosystem-focused PRA [36,39], which can decompose the risk into two constituent terms. The PRA is designed to analyze the effect of an environmental variable (e.g. drought) on any system variable (e.g. carbon flux). ‘Hazardous conditions’ as those where the environmental variable is more extreme than a given threshold. Vulnerability is the difference between expectation values for the system variables under non-hazardous and hazardous
Environ. Res. Lett. 16 (2021) 034035 B Nandintsetseg et al
conditions. As is commonly done, the risk is defined as the expectation of loss: the difference between the system variable’s actual average and its value under continuously non-hazardous conditions [36,39].
Previous studies investigated the impacts of droughts on MG at a site level or regional level, including monitoring [22, 45, 46], experiments [23,47], and model-based research [18,22]. How-ever, a national-level analysis of climate change impacts on MG and associated risks and vulnerab-ilities is still not available to decision-makers with sufficient regional details to guide adaptive grassland management at the level of ecozone or administrat-ive units. Understanding present climate risks is a more appropriate basis for developing adaptation strategies to manage future climate risks than simply collecting baseline climate data and perturbing that data using climate change scenarios [40]. Applying the PRA framework at a grid cell level (0.5º resolu-tion) over MG, this study aims to quantify the recent (R20 = 1996–2015) drought risks (impact) to the MG by comparing with the preceding years (P20 = 1976– 1995).
Firstly, we examine changes in the probability of extreme drought (hazardous) under climate change. Then, how does climate change affect the vulner-ability of ecosystems to such extreme conditions will be examined. We focus on four ecosystem vari-ables, including productivity (AGB8: aboveground
biomass at the end of August, close to its yearly max-imum; ANPP: aboveground net primary productiv-ity for May−September; LAI8: leaf area index for
August) and root-zone plant-available soil moisture for June−August (W0−50).
2. Data and methods
MG ecosystems include four main major ecozones of forest steppe, steppe, desert steppe, and desert (figure1(b)), focusing on this study. The northern regions are covered by forested mountain ranges (dry sub-humid climate). The southern area is covered by desert steppe at lower elevations with a warmer and arid climate (figure1(c)). In general, the grow-ing season begins in late April and continues to mid-September, peaking in late August [48]. The predom-inant plant community of typical MG is characterized by C3, cool-season plant species [49].
2.1. Risk framework
2.1.1. PRA and its applications
Adapting the PRA framework [36,39], we refer to the environmental variable (drought in this study), which may or may not attain hazardous conditions as ‘drought’, and to the ecosystem variables at risk as ‘sys’. Numerically, the risk is defined as the expecta-tion of ecosystem loss, i.e. the amount by which aver-age ecosystem performance is less than it would be under continuously non-hazardous conditions.
Risk = E (sys|droughtnonhaz) − E(sys) (1) where E (sys) is the overall expected value of the ecosystem variable and E (sys|droughtnonhaz) is the expectation value of the sys variable when conditions are not hazardous. Hazardous conditions are defined as those where the drought is more extreme than a given threshold, and their probability of occurrence is denoted as Pr (drought haz). Quantitatively, vulner-ability is the difference in expected ecosystem variable between non-hazardous (good) and hazardous (bad) drought conditions:
Vulnerability = E (sys|droughtnonhaz)
− E(sys|droughthaz). (2) Finally, the risk is the product of the probabil-ity of hazardous conditions and the ecosystem’s vulnerability:
Risk = Pr (drought haz)× Vulnerability. (3) Equations (1) and (3) are mathematically equivalent, giving exact estimates of risk. A detailed description of PRA implementation is provided by [36].
Here, the risk analyses are conducted in three con-secutive steps (figure2). In Step 1, the probability of drought in summer (June−August) is calculated from the Standardized Precipitation–Evapotranspiration Index (SPEI) for a 3 month timescale (SPEI3). Haz-ardous conditions are defined as SPEI3 being lower than−1. Pr(droughthaz) is calculated as the fraction of the 20 years in each period with SPEI3 <−1. In Step 2, ecosystem variables (AGB8, ANPP, LAI8, and
W0−50) were simulated with a process-based
veget-ation model ORCHIDEE-GM (Organizing Carbon and Hydrology in Dynamic Ecosystems-Grassland Management). Finally, in Step 3, we quantified the PRAs for each variable (in absolute values) in each grid cell for R20 and P20, respectively. The vari-ous expectation values E (sys|drought) are calculated from the frequency distribution of sys values over the 20 years. Vulnerabilities and risks are calculated based on equations (2) and (3) (Step 3).
2.1.2. SPEI
The SPEI quantifies the degree of drought as a function of the difference between precipitation and potential evapotranspiration, and thereby it accounts for the impact of warming [50]. We calculated SPEI using monthly air temperature and precipitation from gridded CRUNCEP data [51] for 1971–2015. Here, we used SPEI3, the spanning critical grow-ing season (June–August) months (supplementary section 1).
2.1.3. Ecosystem model
AGB8, ANPP, LAI8, and W0−50 were simulated by
the ORCHIDEE-GM model (version 3.2) [52, 53]. ORCHIDEE-GM has been developed to explicitly 3
Figure 2. Risk framework: in Step 1, climate change-induced drought conditions calculated by the SPEI model with forcing of CRUNCEP climate data; in Step 2, ecosystem variables in MG (AGB8, ANPP, LAI8, and W0–50) simulated by ORCHIDEE-GM
model with forcing of climate CRUNCEP and livestock density (LD) data. Finally, PRAs (Step 3) are performed using outputs of Steps 1 and 2, respectively. The probability of hazardous drought, Pr(drought haz), is defined as SPEI3 <−1.0 and their probability of occurrence. E(sys|drought nonhaz) and E(sys|drought haz) is the expected value of the ecosystem variables when conditions are non-hazardous (SPEI3 >−1.0) and hazardous (SPEI3 <−1.0).
represent grassland management, including grazing [53, 54]. Its management module originated from PaSim, a grassland model developed initially for site applications [55]. The model can be forced by observed livestock density (LD) for grazing or can calculate the optimal densities and practices that maximize the use of ecosystem productivity. A detailed description of the model can be found in [53,54].
We applied ORCHIDEE-GM over the Mongolian spatial domain (41◦−52.25◦ N, 87◦−121◦ E) using the 6-hourly CRUNCEP climate data at 0.5◦× 0.5◦ spatial resolution for 1901–2016. In this study, we used the simulations for 1971−2015. Observed live-stock number for grazing intensity in sheep unit (SU) ha−1 and associated daily feed requirement (1.4 kg dry matter day−1 SU−1) [28] was prescribed to the model. We considered that all grid cells were covered by C3 grasses (dominant plant functional type in MG). We used the 12 USDA texture classes provided at a global 0.08◦ resolution [56] and upscaled these to the resolution of the atmospheric dataset for soil texture. Only the dominant texture type for a grid cell was used at the 0.5◦ resolution for defin-ing soil hydraulic parameters [57] in the model. The grazing period was determined in the model by biomass availability, snow, and soil conditions [54,55].
The model was first to run for a spin-up without management using the first ten years of the climate (1901–1910) cycled in a loop, and atmospheric CO2
concentration for 1900 (296 ppm) until all carbon pools reached equilibrium (long term net ecosystem exchange = 0 at each grid point). This first spin-up usually takes 10 000 years. Then the model was run over MG for 1901–2016, forced by observed increas-ing atmospheric CO2concentration, variable climate,
variable nitrogen deposition, and variable LD. The LD is assumed to be constant during 1901−1970 with
the same LD as that of 1971. The model results were evaluated against observations of AGB8, NDVI6–8,
and W0−50 over MG (supplementary section 2). The
result suggests that ORCHIDEE-GM could reproduce spatial and temporal variations of soil moisture and the productivity of grasslands (figure S1 (available online at stacks.iop.org/ERL/16/034035/mmedia)). Moreover, the ability of ORCHIDEE-GM to simulate the responses AGB8to extreme droughts (2002 and
2007) has been evaluated by validating against obser-vations of AGB8 and Normalized Difference
Veget-ation Index for June–August (NDVI6–8). We found
spatially consistent losses of the modeled AGB8and
observed AGB8and NDVI6–8in 2002 and 2007 (figure
S2). Results indicate that modeled drought effects exhibit a substantial variability, ranging from nearly 30% to 60% reduction in AGB8 relative to the
observed AGB8.
2.2. Data
2.2.1. Climate data
We used the CRUNCEP (version 7) [51] six-hourly gridded climate data (air temperature, precipita-tion, relative humidity, pressure, long-wave radi-ation, and wind speed) at 0.5◦ resolution during 1901–2016, which is a combination of the annually updated CRUTSv3.24 monthly climate dataset [58] and NCEP reanalysis [59] (supplementary section 3). Additionally, we used monthly temperature and pre-cipitation from 69 stations distributed across Mon-golia (figure 1(b)) during 1976–2015 to assess cli-mate change conditions compared to the CRUNCEP datasets.
2.2.2. LD data
Livestock numbers at the soum (administrative unit) level of Mongolia during 1971−2015 were obtained from the National Statistical Office of Mongolia (NSO), as counted annually in December [60]. Every
Environ. Res. Lett. 16 (2021) 034035 B Nandintsetseg et al
Figure 3. Interannual changes in (a) summer drought (SPEI3 for June–August) with P20 and R20, (b) climate (annual T and P), and (c) livestock number per each species in sheep units (SU) during 1976–2015. Spatial patterns of differences (∆) between two composites (R20 and P20) of (d) SPEI3, (e) LD in SU, and (f) the modeled AGB8(in relative terms, %). The (∆) for SPEI3 and
LD (AGB8) calculated as the absolute (relative) values in means between R20 and P20. In (c), black arrows indicate dzud disasters
(livestock losses) in 2000–2002 and 2010, respectively.
December, the NSO conducts an annual census of horses, cattle, sheep, goats, and camels in Mongolia. These data were converted into SU to standardize feed requirements as each type of livestock requires dif-ferent amounts of feed (supplementary section 4). This LD in SU distribution was then aggregated to the 0.5◦grid used by the ecosystem model.
2.2.3. Ground and satellite observations
For model validation, we used ground-measured AGB8 on 25 August in grazing areas at 66 stations
for 2000–2015 and satellite-derived monthly grided (0.5◦ × 0.5◦) Moderate Resolution Imaging Spec-troradiometer NDVI6–8, which derived from the 16 d
0.05◦ × 0.05◦ spatial resolution MOD13C1 dataset during 2000–2015 [61] (Supplementary section 5). The locations of the sampling stations are shown in figure1(b). To validate modeled W0−50,we used 10 d
measurements of W0−50at 23 stations for 1983–2011,
which were collected from the upper 50 cm of the soil layer, representing the typical rooting zone of MG [48].
3. Results
Modeled AGB8 showed a latitudinal gradient that
corresponds to gradients of temperature and pre-cipitation during May − August (figure1(c)) with
southward and westward decreasing precipitation and increasing temperature, consistent with modeled and observed AGB8(figure1(d)). Regions with higher
AGB8were found in north and eastern forest steppe
and steppe ecozones. In contrast, desert steppe in southwestern and southern arid regions had lower values of AGB8due to low precipitation (drier soil)
and warmer temperature (figure1(c)).
During 1975−2015, hazardous droughts are increased across MG with significant (p < 0.05) increases since the late 1990s, from the occurrence of major droughts in 2000−2002 and 2007 (figure3(a)), reflecting regional climate change (figure3(b)). The average value of SPEI3 indicates that all MG experi-enced a shift of climate regime with more severe and frequent drought in the late 1990s at the transition between P20 and R20 (figure3(a)). The map of aver-age summer SPEI3 for P20 indicates values greater than zero throughout MG. In contrast, there was a shift to more negative values in R20, particularly in central areas (figure S3). This indicates a widespread increase in drought conditions.
During 1975−2015, MG experienced a significant (p < 0.001) warming of 1.73◦C (figure3(b)) based on annual temperature from 69 stations (1.45◦C from CRUNCEP) with the 11 warmest years on record happening during the 2000s. Annual precipitation slightly decreased (p > 0.05) by 5.2% at the 69 stations 5
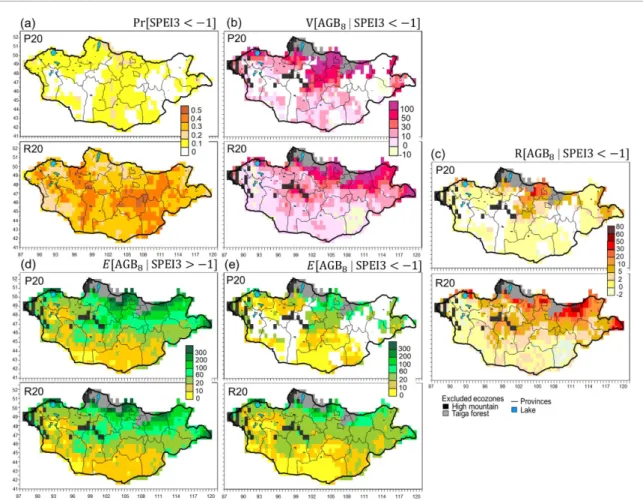
Figure 4. Probabilistic risk analysis (PRA) for AGB8(g m−2) for two periods: P20 (1976–1995) and R20 (1996–2015). The
considered hazard is drought, which is defined as SPEI3 <−1.0. (a) Probability of drought hazard, Pr(SPEI3 < −1.0); (b) vulnerability (V) of AGB8=(d–e); (c) risk (R) to AGB8=(a× b); (d) AGB8in non-hazardous drought years (good
conditions); and (e) AGB8in hazardous drought years (bad conditions). (a) Blank areas in (c) denote areas with SPEI3 > –1.0
(areas without moderate to severe droughts during P20), and these areas are excluded in the vulnerability and risk analyses (blank areas in (b) and (e)).
(by 10.8% from CRUNCEP). In the meantime, since the 1990s (figure3(c)), socioeconomic changes have significantly impacted traditional herding practices. The grazing intensity increased due to an increase in livestock number (by +34.2%) doubling from 50.9 million SU in 1990–102.8 million SU in 2015 (figure 3(c)) with significant losses in 2000−2002 and 2010 due to dzuds that combined with preceding droughts [20,28].
Figures3(d)–(f) show the patterns of differences (∆) between SPEI3, LD, and AGB8(relative) of R20
and P20. ∆SPEI3 shows widespread negative val-ues with the highest valval-ues in the central and east-ern regions (figure3(d)). ∆LD shows positive val-ues in northcentral areas, exceeding 20% (>20× 103 SU), whereas western and the southern areas exper-ienced negative anomalies (LD declined by >20%) (figure3(e)). Simulated relative ∆AGB8(figure3(f))
(∆ANPP, ∆LAI8, and ∆W0−50, figure S3) show a
widerspread reduction in most areas of MG, reach-ing below−65% in central and northeast regions. This indicates that MG, notably the forest steppe and steppe, experienced reduced grassland productiv-ity from declining soil moisture (up to 20%) due
to frequent droughts and warming, together with increasing grazing intensity.
Changes in drought vulnerabilities and risks to AGB8, ANPP, LAI8, and W0−50 were compared
for the two periods across MG. Figure 4 shows the PRA of AGB8 for R20 and P20 with the
Pr (drought haz) (figure4(a)), the vulnerabilities of AGB8 (figure4(b)), and resulting risks (figure4(c))
with mean values of AGB8 under non-hazardous
years (SPEI3 >−1.0) (figure 4(d)) and hazardous ones (SPEI3 <−1.0) (figure 4(e)). In figure 4, the blanked areas indicate areas are without hazardous (moderate to severe) or favorable climate conditions in P20, and these areas are excluded in the vulnerab-ility and risk analyses. For both periods, hazardous droughts caused a lower AGB8(figure4(e)).
Region-ally, vulnerabilities and risks of AGB8increased from
the south to the north (figures4(b) and (c)). During P20, Pr (drought haz) varied little (0.1−0.2) across the region from central to the northwest (figure4(a)), whereas the rest of the country experienced favorable climate conditions (blanked area in figure4(a)). The vulnerability of AGB8 within hazardous
Environ. Res. Lett. 16 (2021) 034035 B Nandintsetseg et al
Figure 5. Drought risks and vulnerbalites for AGB8, ANPP, LAI8, and W0–50for each period (P20: 1976–1995 and R20:
1996–2015) for three main ecozones of MG. The V and R are expressed in absolute (a) and relative (b) terms in averaged values over all grid cells for each ecozone. Relative terms (b) are estimated as fractions of variables under non-hazardous conditions in each grid cell.
largest in northcentral Mongolia (figure4(b)). Sim-ilar to the vulnerabilities, the drought risk of AGB8
was highest in the northcentral region (figure4(c)). In contrast, during R20, a higher Pr (drought haz) (>0.4) was found throughout Mongolia, particu-larly in central and eastern regions (figure 4(a)). Similarly, the vulnerability of AGB8 increased over
the eastern and western areas (figure 4(b)). There-fore, the drought risk to AGB8 has increased over
extended areas. Areas with higher risk to AGB8
(losses >20.0 g m−2 and >30% of the mean) were northcentral and northeast and extended eastward. Increases in the probability of drought, particu-larly in the 2000s, were the main factors contribut-ing to the greater extent of the increased risk than vulnerabilities.
Figure 5 shows the drought vulnerabilities and risks (absolute and relative terms) for the two periods averaging all grid-cells in three main ecozones. Rel-ative vulnerability (or risk) is vulnerability (or risk) divided by the value of each impacted variable at the same location under contemporaneous non-hazardous conditions. In general, vulnerabilities and risks increased from the desert steppe to the forest steppe. In P20, relative vulnerabilities for productiv-ity (AGB8, ANPP, and LAI8) were 25%−50% for the
three ecozones (figure5(b)). The risks were estim-ated as being low (2.0%−4.3%) due to the low Pr (drought haz). During R20 (figure5(b)), the relat-ive risks to productivities increased by 4.1%−11.2% within the three ecozones than P20, especially in the steppe and forest steppe. The largest increase in relative vulnerabilities of productivities (up to 14.1%) was found in the steppe. For W0−50,
vulner-abilities (10%−15%) and risks (2%−4%) increased
within ecozones. This indicates that the increased Pr (drought haz) led to decreased W0−50(soil drying),
thereby contributed to the increased risk to plant pro-ductivity.
4. Discussion and conclusions
Multi-centennial reconstructions of past temperature for MG indicated that recent warming over Mongolia [62–64] has been unusually rapid, with surface tem-perature anomalies higher than for much of the globe by reaching to∼1.5◦C higher than those in the pre-vious several centuries [24]. Recent tree-ring studies suggest that P20 pluvial episodes and R20 droughts are extraordinarily rare in MG over the last 2060 years [65,66].
Reducing long-term drought risk is a big chal-lenge. Our results show that during P20, MG experi-enced favorable wet summers (17 summers with wet conditions). In contrast, during R20, MG experienced more frequent hazardous droughts (15 summers with dry conditions) with rapid warming and slight dry-ing. The recent droughts in R20 have been con-current with significant socioeconomic changes that drove livestock densities upwards [20,26,28,67]. Cli-mate change and increasing intake led to declines in the majority of MG’s productivity, particularly in the R20, notably in northcentral and northeast Mongo-lia. These agree with previous ground measurements [22, 68], herder perceptions [63, 69], and remote sensing studies [70,71], which detected reductions in grassland production, particularly in the steppe [70]. During R20, climate change led to increasing drought vulnerabilities (risk of impacts) for AGB8,
ANPP, and LAI8 over extended areas in MG, with
8% (3%), 10% (6.2%), and 15% (3%) increases compared to the P20 levels, particularly in steppe and forest steppe. At the same time, W0−50 risk has
increased, leading to soil moisture deficits for plant growth. Soil moisture loss through evapotranspira-tion is typically high in early growing months, lead-ing to plant water stress in the early growlead-ing season, notably in June [48]. The increased Pr (drought haz) mainly caused increased risks to all variables. This is evident because vulnerabilities of variables gener-ally increased less (except some areas in the steppe) than those of the probability of droughts, and they even decreased slightly in the forest steppe. These decreases are possibly related to elevated CO2 that
increases drought tolerance by inducing stomatal closure [36], given the fact that the model can sim-ulate physiological adaptation (e.g. stomatal clos-ure with increased atmospheric CO2 concentration
and drought, increased allocation to roots when soil resources become limiting, and temperature optimum of photosynthesis) [52].
Drought is a gradual phenomenon with a time-lagged carry-over of anomalies in rainfall–soil moisture–pasture–hay/forage–livestock conditions that eventually culminate in a dzud [20,72]. During R20, the substantial increases in hazardous droughts resulted in a reduction in AGB8over MGs compared
to the P20, particularly in the most productive forest steppe areas (40%−65%) and steppe (20%−40%), leading to forage deficits for livestock. This is con-sistent with previous studies [73]. This could reduce fodder/hay reserves for the animals during the cold-season, causing livestock to become more vulner-able. Moreover, drought affects animal body condi-tions as animals cannot fatten enough to overcome winter due to lack of energy and nutrient intake and water shortage [20, 28, 74]. There is strong evid-ence that in 2000−2014 [20], the combination of summer droughts and severe winters (dzuds) killed 30.2 million livestock (equals to 57.4 million SU), resulting in vulnerable herders (e.g. malnutrition, infant losses, and health) [75,76], losing their live-lihoods [67,77], and significantly damaging Mon-golian socio-economy [21, 28, 78]. Approximately 16.7% of these deaths were attributed to a drought-induced deficit of forage/hay that caused livestock to become emaciated [20]. In this context, assessments of drought risks for the present MG conditions may support climate-related disaster risk management by identifying risky hotspots, allowing herders in risky areas to be prepared for events, and mitigating future potential impacts.
Given MG’s benefits for both ecosystem services and socioeconomic consequences, recent increases in hazardous droughts and associated risk to MG sig-nal an urgent need to implement grassland manage-ment or drought mitigation strategies and policies that sustain MG. They may include mitigation and
management (e.g. grazing and herd management) in the high-risk areas to better manage climate change consequences [79,80]. Recent international and regional initiatives focus on a proactive way to reduce drought risks by protecting and restor-ing affected ecosystems through land rehabilitation [79]. Furthermore, comprehensive drought monitor-ing and early warnmonitor-ing systems are crucial for proactive preparedness for future drought.
We identified that the hotspots of MG areas at risk from climate change are the northcentral and northeast Mongolia, suggesting that these regions require strategic management (grassland/livestock) for adaptation and ecosystem conservation to cope with climate change impacts. Recently, there have been science-based recommendations for improve-ments of grassland and livestock management policy [46], including implementing rotational and planned grazing system, improving coordination of pastoral mobility [73,81], reducing animal numbers, sustain-ing traditional best practices, ecosystem conserva-tion practices, and soil improvement, and increas-ing knowledge and information sharincreas-ing [26, 82], all of which will likely contribute to dealing with increased risk to MG. On the other hand, recent studies suggest that MG may be approaching a tipping point by declining plant species richness and increasing drought-tolerant grass caused by cli-mate change and increasing grassland use [82]. This declining species richness may affect grassland resi-lience after drought [83]. Shifts in plant functional types under the changing climate and land use need to be confirmed for all MG [23]. The current model used here does not replace plant functional types with others when the environment changes [54].
The ecosystem-focused PRA used in this study allows for straightforward quantification and decom-position of ecosystem risks, enhancing future risk assessment. On the side of the grassland services, we focused here on the vulnerability of MG productiv-ity in pasture using ORCHIDEE-GM, which is one of few ecosystem models that can describe vegetation dynamics under changing climate with the grazing practice for large-scale applications such as Mongolia over a long-term. In our definition, vulnerability is the ultimate impact of drought on the ecosystem. However, we do not know if the vulnerability has changed because of increased LD that might induce some risk uncertainties. This may be interesting to look at in a follow-up study by, e.g. comparing the sensitivity of AGB8or NDVI to drought for the same
drought intensity but in different districts and years with the same background climate and character-ized only by different LDs. Besides, it might be partly assessed by running the model with variable and static LD (or for a range of densities) and comparing sensitivity differences.
Environ. Res. Lett. 16 (2021) 034035 B Nandintsetseg et al
Moreover, this study does not provide an ensemble modeling approach. We used one ecosys-tem model by parameterizing and validating with observed biomass and soil moisture in MG. This model has been tested against observations and experimental data across Europe with reasonably well-performing ecosystem variables under grazing [53,54]. It is also used for ecosystem risk analysis with different impact models under current and future cli-mate scenarios [39,84]. Moreover, we also used one environmental variable (drought) using the SPEI, which is not explicitly incorporated in the ecosys-tem model. However, we calculated the SPEI from the ORCHIDEE-GM input data and used the model to quantify the associated risk [39]. In the future, additional environmental and sys variables could be included to analyze the risks more comprehensively. However, we would need to extend the exercise to other models, if we want to know which ecosystem types are at the greatest risk.
Future climate change is expected to negatively impact the productivity and stability of ecosystems in drylands [85]. In turn, such ecosystem degrada-tion can further enhance climate change risks, espe-cially ‘hot droughts,’ which are expected to become more frequent and severe in semi-arid regions within the next few decades [66, 86, 87], leading to soil moisture deficits [1]. Consequently, alleviating the adverse impacts of climate change on ecosystems, livestock, and pastoralists through strengthening cop-ing capacities, risk reduction strategies, and resili-ence in degraded environments will be a crucial chal-lenge. Therefore, addressing the mechanistic details of the continued increase of drought risk to MG and identifying MG areas that will be most affected in the future are urgently needed. Considering these, the MG’s future risk analysis needs to be assessed using multiple climate scenarios and multiple ecosystem models for future adaptation policies that promote and sustain grasslands and human well-being.
Data availability statement
All data that support the findings of this study are included within the article (and any supplementary files).
Acknowledgments
This research was supported by Research Fellow-ship Grant (No. P2017-2504) from the National University of Mongolia, and partly by the Taylor Family-Asia Foundation Endowed Chair in Eco-logy and Conservation BioEco-logy, and International (Regional) Cooperation and Exchange Programs of China (No. 41961144019). The authors thank Michael C Grundler (Department of Ecology and Evolutionary Biology, University of Michigan, Ann Arbor, USA) to prove the English. We acknowledge
climate and land surface data from the Information and Research Institute of Meteorology, Hydrology and Environment of Mongolia, and livestock data from the National Statistical Office of Mongolia.
Author Contributions
BN conceived the idea and designed the research. BN and JC performed research with comments from BB and PC. BN analysed data with support from ED. BN wrote the manuscript and prepared all Figures with comments and edits from BB, JC, PC, and NCS. AB and TsB prepared climate and biomass data.
ORCID iDs
Banzragch Nandintsetseg https://orcid.org/0000-0002-2501-3495
Bazartseren Boldgiv https://orcid.org/0000-0003-0015-8142
Jinfeng Chang https://orcid.org/0000-0003-4463-7778
Philippe Ciais https://orcid.org/0000-0001-8560-4943
Nils Chr. Stenseth https://orcid.org/0000-0002-1591-5399
References
[1] Sheffield J and Wood E F 2008 Projected changes in drought occurrence under future global warming from multi-model, multi-scenario, IPCC AR4 simulations Clim. Dyn.31 79–105
[2] Zscheischler J, Reichstein M, Harmeling S, Rammig A, Tomelleri E and Mahecha M D 2014 Extreme events in gross primary production: a characterization across continents
Biogeosci.11 2909–24
[3] Brookshire E N J and Weaver T 2015 Long-term decline in grassland productivity driven by increasing dryness Nat.
Commun.6 7148
[4] Frank D et al 2015 Effects of climate extremes on the terrestrial carbon cycle: concepts, processes and potential future impacts Glob. Change Biol.21 2861–80
[5] IPCC 2014 Full Report Part A: Global and sectoral aspects Contribution of Working Group II to the Fifth Assessment Report of the Intergovernmental Panel on Climate Change (Cambridge: Cambridge University Press)
[6] FAO 2005 Grassland of the World ed J M Suttie, S J Reynolds and C Batello (Rome: Food and Agriculture Organization of the United Nations)
[7] Bouwman A F, Van Der Hoek K W, Eickhout B and Soenario I 2005 Exploring changes in world ruminant production systems Agric. Syst.84 121–53
[8] O’Mara F P 2012 The role of grasslands in food security and climate change Ann. Bot.110 1263–70
[9] Jones M B and Donnelly A 2004 Carbon sequestration in temperate grassland ecosystems and the influence of management, climate and elevated CO2New Phytol.
164 423–39
[10] FAO 2010 Grassland carbon sequestration: management,
policy and economics Integrated Crop Management ed
M Abberton, R Conant and C Batello (Rome: Food and Agriculture Organization of the United Nations) Vol. 11–2010
[11] Ciais P et al 2005 Europe-wide reduction in primary productivity caused by the heat and drought in 2003 Nature
437 529–33
[12] IPCC 2012 Managing the Risks of Extreme Events and Disasters to Advance Climate Change Adaptation—SREX Summary for Policymakers: A Special Report of Working Groups I and II of the Intergovernmental Panel on Climate Change (Cambridge: Cambridge University Press) [13] Shinoda M, Nandintsetseg B, Nachinshonhor U G and
Komiyama H 2014 Hotspots of recent drought in Asian steppes Reg. Environ. Change14 103–17
[14] Reichstein M et al 2013 Climate extremes and the carbon cycle Nature.500 287–95
[15] Henwood W D 2010 Toward a strategy for the conservation and protection of the world’s temperate grasslands Great
Plains Res. 20 121–34 (https://www.jstor.org/stable/ 23782179)
[16] Wiegand T, Wiegand K and Pütz S 2008 Grassland models
Encyclopedia of Ecology (Elsevier: Amsterdam) pp1754–65
[17] Shinoda M, Gillies J A, Mikami M and Shao Y 2011 Temperate grasslands as a dust source: knowledge, uncertainties, and challenges Aeolian Res.3 271–93
[18] Nandintsetseg B and Shinoda M 2015 Land surface memory effects on dust emission in a Mongolian temperate grassland
J. Geophys. Res. Biogeosci.120 414–27
[19] Hanks B 2010 Archaeology of the Eurasian steppes and Mongolia Annu. Rev. Anthropol.39 469–86
[20] Nandintsetseg B, Shinoda M, Du C and Munkhjargal E 2018 Cold-season disasters on the Eurasian steppes:
climate-driven or man-made Sci. Rep.8 14769
[21] Sternberg T 2010 Unravelling Mongolia’s extreme winter disaster of 2010 Nomad. People.14 72–86
[22] Nandintsetseg B and Shinoda M 2013 Assessment of drought frequency, duration, and severity and its impact on pasture production in Mongolia Nat. Hazards66 995–1008
[23] Jamiyansharav K, Fern´andez-Giménez M E, Angerer J P, Yadamsuren B and Dash Z 2018 Plant community change in three Mongolian steppe ecosystems 1994–2013: applications to state-and-transition models Ecosphere9 e02145
[24] Davi N K, D’Arrigo R, Jacoby G C, Cook E R, Anchukaitis K, Nachin B, Rao M P and Leland C 2015 A long-term context (931–2005 C.E.) for rapid warming over Central Asia Q. Sci.
Rev.121 89–97
[25] Lkhagvadorj D, Hauck M, Dulamsuren C and Tsogtbaatar J 2013 Pastoral nomadism in the forest-steppe of the Mongolian Altai under a changing economy and a warming climate J. Arid Environ.88 82–89
[26] Fern´andez-Giménez M E, Venable N H, Angerer J, Fassnacht S R, Reid R S and Khishigbayar J 2017 Exploring linked ecological and cultural tipping points in Mongolia
Anthropocene17 46–69
[27] World Bank 2007 Mongolia: Livestock sector study (Washington, DC.: World Bank) (http://hdl.handle.net/ 10986/13056)
[28] Nandintsetseg B, Shinoda M and Erdenetsetseg B 2018 Contributions of multiple climate hazards and overgrazing to the 2009/2010 winter disaster in Mongolia Nat. Hazards
92 109–26
[29] Brooks N 2003 Vulnerability, risk and adaptation: A conceptual framework, tyndall centre for climate change research (Norwich: University of East Anglia)
[30] Birkmann J 2013 Measuring vulnerability to natural hazards:
Towards disaster resilient societies (Tokyo, New York, Paris:
United Nations University Press)
[31] Aven T 2016 Risk assessment and risk management: review of recent advances on their foundation Eur. J. Oper. Res.
253 1–13
[32] Olsson L, Opondo M, Tschakert P, Agrawal A, Eriksen S, Ma S, Perch L and Zakieldeen S 2014 Livelihoods and poverty Livelihoods and poverty Livelihoods and poverty
Climate Change 2014: Impacts, Adaptation, and Vulnerability. Part A: Global and Sectoral Aspects. Contribution of Working Group II to the Fifth Assessment Report of the
Intergovernmental Panel on Climate Change ed C B Field et al (Cambridge: Cambridge University Press)
[33] Ahmad Q K et al 2001 Summary for policymakers. Climate change 2001: Impacts, Adaptataion, and Vulnerability. Contribution of Working Group II of the Intergovernmental Panel on Climate Change (Cambridge: Cambridge University Press)
[34] Scholze M, Knorr W, Arnell N W and Prentice I C 2006 A climate-change risk analysis for world ecosystems Proc. Natl
Acad. Sci. USA103 13116–20
[35] Ionescu C, Klein R J T, Hinkel J, Kavi Kumar K S and Klein R 2009 Towards a formal framework of vulnerability to climate change Environ. Model. Assess.14 1–16
[36] Van Oijen M, Beer C, Cramer W, Rammig A, Reichstein M, Rolinski S and Soussana J F 2013 A novel probabilistic risk analysis to determine the vulnerability of ecosystems to extreme climatic events Environ. Res. Lett.8 015032
[37] UNDHA 1992 Internationally Agreed Glossary of Basic Terms
Related to Disaster Management (Geneva: United
Nations—Department of Humanitarian Affairs) [38] UN 2010 2009 global assessment report on disaster risk
reduction risk and poverty in a changing climate [39] Van Oijen M et al 2014 Impact of droughts on the carbon
cycle in European vegetation: a probabilistic risk analysis using six vegetation models Biogeosci11 6357–75
[40] Jones R and Boer R 2005 Assessing current climate risks
Adapt. Policy Fram. Clim. Chang. Dev. Strateg. Policies Meas.
ed B Lim, E Spanger-Siegfried, I Burton, E Malone and S Huq (Cambridge: Cambridge University Press) p 28
[41] Eckstein D, Hutfils M-L and Winges M 2019 The global climate risk index 2019: Who suffers most from extreme weather events? Weather-related loss events in 2017 and 1998–2017 36 (Bonn and Berlin: Germanwatch e.V.) [42] Hope B K 2000 Generating probabilistic spatially-explicit
individual risk assessments Risk Anal.20 573–90
[43] Diez J M, Hulme P E and Duncan R P 2012 Using prior information to build probabilistic invasive species risk assessments Biol. Invasions ( https://doi.org/10.1007/s10530-011-0109-5)
[44] Rolinski S, Rammig A, Walz A, Von Bloh W, Van Oijen M and Thonicke K 2015 A probabilistic risk assessment for the vulnerability of the European carbon cycle to weather extremes: the ecosystem perspective Biogeosci12 1813–31
[45] Vandandorj S, Gantsetseg B and Boldgiv B 2015 Spatial and temporal variability in vegetation cover of Mongolia and its implications J. Arid Land7 450–61
[46] GGP and NAMEM (Green Gold Project, National Agency of Meteorology and Environmental Monitoring) 2015 National Report on the Rangeland Health of Mongolia (Ulaanbaatar: Green Gold - Animal Health Project, SDC)
[47] Shinoda M, Nachinshonhor G U and Nemoto M 2010 Impact of drought on vegetation dynamics of the Mongolian steppe: a field experiment J. Arid Environ.74 63–69
[48] Nandintsetseg B and Shinoda M 2011 Seasonal change of soil moisture in Mongolia: its climatology and modelling Int. J.
Clim.31 1143–52
[49] Pyankov V I, Gunin P D, Tsoog S and Black C C 2000 C4
plants in the vegetation of Mongolia: their natural occurrence and geographical distribution in relation to climate Oecologia123 15–31
[50] Vicente-Serrano S M, Beguería S and López-Moreno J I 2010 A multiscalar drought index sensitive to global warming: the standardized precipitation evapotranspiration index J. Clim.
23 1696–718
[51] Viovy N 2018 CRUNCEP version 7—atmospheric forcing data for the community land model Research Data Archive at the National Center for Atmospheric Research, Computational and Information Systems Laboratory (available at:http://rda.ucar.edu/datasets/ds314.3/) (Accessed 5 June 2017)
[52] Krinner G, Viovy N, de Noblet-ducoudré N, Ogée J, Polcher J, Friedlingstein P, Ciais P, Sitch S and Prentice I C 2005 A dynamic global vegetation model for studies of the
Environ. Res. Lett. 16 (2021) 034035 B Nandintsetseg et al
coupled atmosphere-biosphere system Glob. Biogeochem.
Cycles19 GB1015
[53] Chang J F et al 2013 Incorporating grassland management in ORCHIDEE: model description and evaluation at 11 eddy-covariance sites in Europe Geosci. Model Dev.
6 2165–81
[54] Chang J, Viovy N, Vuichard N, Ciais P, Campioli M, Klumpp K, Martin R, Leip A and Soussana J F 2015 Modeled changes in potential grassland productivity and in grass-fed ruminant livestock density in Europe over 1961–2010 PLoS
One10 e0127554
[55] Graux A I, Gaurut M, Agabriel J, Baumont R, Delagarde R, Delaby L and Soussana J F 2011 Development of the pasture simulation model for assessing livestock production under climate change Agric. Ecosyst. Environ.144 69–91
[56] Reynolds C A, Jackson T J and Rawls W J 2000 Estimating soil water-holding capacities by linking the food and agriculture organization soil map of the world with global pedon databases and continuous pedotransfer functions Wat
Resour. Res.36 3653–62
[57] Carsel R F and Parrish R S 1988 Developing joint probability distributions of soil water retention characteristics Water
Resour. Res.24 755–69
[58] Harris I, Jones P D, Osborn T J and Lister D H 2014 Updated high-resolution grids of monthly climatic observations—the CRU TS3.10 dataset Int. J. Clim.34 623–42
[59] Kalnay E et al 1996 The NCEP/NCAR 40 year reanalysis project Bull. Am. Meteorol. Soc.77 437–71
[60] NSO (National Statistical Office) 2019 Mongolia livestock statistical data (available at:www.1212.mn/)
[61] Tucker C J, Pinzon J E, Brown M E, Slayback D A, Pak E W, Mahoney R, Vermote E F and El Saleous N 2005 An extended AVHRR 8-km NDVI dataset compatible with MODIS and SPOT vegetation NDVI data Int. J. Remote Sens.
26 4485–98
[62] Nandintsetseg B, Greene J S and Goulden C E 2007 Trends in extreme daily precipitation and temperature near Lake Hövsgöl, Mongolia Int. J. Clim.27 341–7
[63] Goulden C E, Mead J, Horwitz R, Goulden M,
Nandintsetseg B, McCormick S, Boldgiv B and Petraitis P S 2016 Interviews of Mongolian herders and high resolution precipitation data reveal an increase in short heavy rains and thunderstorm activity in semi-arid Mongolia Clim. Change
136 281–95
[64] MARCC 2014 Mongolia second assessment report on climate change 2014 (Ulaanbaatar: Ministry of Environment and Green Development of Mongolia)
[65] Pederson N, Hessl A E, Baatarbileg N, Anchukaitis K J and Di Cosmo N 2014 Pluvials, droughts, the Mongol Empire, and modern Mongolia Proc. Natl Acad. Sci.111 4375–9
[66] Hessl A E, Anchukaitis K J, Jelsema C, Cook B,
Byambasuren O, Leland C, Nachin B, Pederson N, Tian H and Hayles L A 2018 Past and future drought in Mongolia
Sci. Adv.4 e1701832
[67] Du C, Shinoda M, Tachiiri K, Nandintsetseg B, Komiyama H and Matsushita S 2017 Mongolian herders’ vulnerability to
dzud: a study of record livestock mortality levels during the
severe 2009/2010 winter Nat Hazards92 3–17
[68] Addison J, Friedel M, Brown C, Davies J and Waldron S 2012 A critical review of degradation assumptions applied to Mongolia’s Gobi Desert Rangel. J.34 125–37
[69] Bruegger R A, Jigjsuren O and Fern´andez-Giménez M E 2014 Herder observations of rangeland change in Mongolia: indicators, causes, and application to community-based management Rangel. Ecol. Manage.67 119–31
[70] Liu Y Y, Evans J P, McCabe M F, Ram D J, Aijm V D, Dolman A J and Saizen I 2013 Changing climate and overgrazing are decimating Mongolian steppes PLoS One
8 4–9
[71] Bao G, Qin Z, Bao Y, Zhou Y, Li W and Sanjjav A 2014 NDVI-based long-term vegetation dynamics and its response to climatic change in the Mongolian Plateau
Remote Sens.6 8337–58
[72] Shinoda M 2017 Evolving a multi-hazard focused approach for arid Eurasia Clim. Hazard Cris. Asian Soc. Environ. ed T Sternberg (London: Routledge) (https://doi.org/10.4324/ 9781315572413)
[73] Kakinuma K, Yanagawa A, Sasaki T, Rao M P and Kanae S 2019 Socio-ecological interactions in a changing climate: a review of the Mongolian pastoral system Sustainability
11
[74] Rao M P, Davi N K, D’Arrigo R D, Skees J, Nachin B, Leland C, Lyon B, Wang S Y and Byambasuren O 2015 Dzuds, droughts, and livestock mortality in Mongolia
Environ. Res. Lett.10 074012
[75] Otani S, Onishi K, Kurozawa Y, Kurosaki Y, Bat-Oyun T, Shinoda M and Mu H 2016 Assessment of the effects of severe winter disasters (Dzud) on public health in Mongolia on the basis of loss of livestock Disaster Med. Public Health
Preparedness10 549–52
[76] Groppo V and Kraehnert K 2016 Extreme weather events and child height: evidence from Mongolia World Dev.
86 59–78
[77] Lehmann-uschner B K and Kraehnert K 2018 Extremely harsh winters threaten the livelihood of Mongolia’s herders
DIW Wkly. Rep. 8 369–75 (http://hdl.handle.net/ 10419/183866)
[78] Benson C 2011 Dzud disaster financing and response in Mongolia 80
[79] Wilhite D A, Sivakumar M V K and Pulwarty R 2014 Managing drought risk in a changing climate: the role of national drought policy Weath Clim. Extremes
3 4–13
[80] Crossman N D 2019 Drought resilience, adaptation and management policy framework: Supporting technical guidelines (Bonn: UNCCD)
[81] Fern´andez-Giménez M E, Batkhishig B and Batbuyan B 2012 Cross-boundary and cross-level dynamics increase vulnerability to severe winter disasters (dzud) in Mongolia
Glob. Environ. Change22 836–51
[82] Khishigbayar J, Fern´andez-Giménez M E, Angerer J P, Reid R S, Chantsallkham J, Baasandorj Y and Zumberelmaa D 2015 Mongolian rangelands at a tipping point? Biomass and cover are stable but composition shifts and richness declines after 20 years of grazing and increasing temperatures J. Arid Environ.115 100–12
[83] Vogel A, Scherer-Lorenzen M and Weigelt A 2012 Grassland resistance and resilience after drought depends on management intensity and species richness PLoS One
5 e36992
[84] Chang J, Ciais P, Viovy N, Soussana J F, Klumpp K and Sultan B 2017 Future productivity and phenology changes in European grasslands for different warming levels:
implications for grassland management and carbon balance
Carbon Balance Manage.12 11
[85] Hoegh-Guldberg O et al 2018 Impacts of 1.5◦C Global Warming on Natural and Human Systems. In: Glob. Warm. 1.5 ◦C an IPCC Spec. Rep. impacts Glob. Warm. 1.5◦C above pre-industrial levels Relat. Glob. Greenh. gas Emiss. pathways, Context Strength. Glob. response to Threat Clim. Chang. ed V Masson-Delmotte (Cambridge: Cambridge University Press)
[86] Overpeck J and Udall B 2010 Dry times ahead Science
328 1642–3
[87] Zhao T and Dai A 2015 The magnitude and causes of global drought changes in the twenty-first century under a low-moderate emissions scenario J. Clim.
28 4490–512