HAL Id: hal-00296523
https://hal.archives-ouvertes.fr/hal-00296523
Submitted on 11 Apr 2008
HAL is a multi-disciplinary open access
archive for the deposit and dissemination of
sci-entific research documents, whether they are
pub-lished or not. The documents may come from
teaching and research institutions in France or
abroad, or from public or private research centers.
L’archive ouverte pluridisciplinaire HAL, est
destinée au dépôt et à la diffusion de documents
scientifiques de niveau recherche, publiés ou non,
émanant des établissements d’enseignement et de
recherche français ou étrangers, des laboratoires
publics ou privés.
the Mexico City area and over the North Pacific
R. Talbot, H. Mao, E. Scheuer, J. Dibb, M. Avery, E. Browell, G. Sachse, S.
Vay, D. Blake, G. Huey, et al.
To cite this version:
R. Talbot, H. Mao, E. Scheuer, J. Dibb, M. Avery, et al.. Factors influencing the large-scale distribution
of Hg° in the Mexico City area and over the North Pacific. Atmospheric Chemistry and Physics,
European Geosciences Union, 2008, 8 (7), pp.2103-2114. �hal-00296523�
www.atmos-chem-phys.net/8/2103/2008/ © Author(s) 2008. This work is distributed under the Creative Commons Attribution 3.0 License.
Chemistry
and Physics
Factors influencing the large-scale distribution of Hg
◦
in the Mexico
City area and over the North Pacific
R. Talbot1, H. Mao1, E. Scheuer1, J. Dibb1, M. Avery2, E. Browell2, G. Sachse2, S. Vay2, D. Blake3, G. Huey4, and
H. Fuelberg5
1Institute for the Study of Earth, Oceans, and Space, Climate Change Research Center, University of New Hampshire,
Durham, NH 03824, USA
2NASA Langley Research Center, Chemistry and Dynamics Branch, Hampton, VA 23681, USA 3University of California – Irvine, Department of Chemistry, Irvine, CA 92697, USA
4Department of Earth and Atmospheric Sciences, Georgia, Institute of Technology, Atlanta, GA 30332, USA 5Department of Meteorology, Florida State University, Tallahassee, FL 32306, USA
Received: 19 September 2007 – Published in Atmos. Chem. Phys. Discuss.: 2 November 2007 Revised: 13 February 2008 – Accepted: 6 March 2008 – Published: 11 April 2008
Abstract. Gas-phase elemental mercury (Hg◦) was
mea-sured aboard the NASA DC-8 aircraft during the Intercon-tinental Chemical Transport Experiment Phase B (INTEX-B) campaign in spring 2006. Flights were conducted around Mexico City and on two subsequent deployments over the North Pacific based out of Honolulu, Hawaii and Anchorage, Alaska. Data obtained from 0.15–12 km altitude showed that Hg◦exhibited a relatively constant vertical profile centered around 100 ppqv. Highly concentrated pollution plumes em-anating from the Mexico City urban agglomeration revealed that mixing ratios of Hg◦as large as 500 ppqv were related to combustion tracers such as CO, but not SO2which is
pre-sumably released locally from coal burning, refineries, and volcanoes. Our analysis of Mexico City plumes indicated that widespread multi-source urban/industrial emissions may have a more important influence on Hg◦than specific point sources. Over the Pacific, correlations with CO, CO2, CH4,
and C2Cl4were diffuse overall, but recognizable on flights
out of Anchorage and Honolulu. In distinct plumes origi-nating from the Asian continent the Hg◦- CO relationship
yielded an average value of ∼0.56 ppqv/ppbv, in good agree-ment with previous findings. A prominent feature of the INTEX-B dataset was frequent total depletion of Hg◦in the upper troposphere when stratospherically influenced air was encountered. Ozone data obtained with the differential ab-sorption lidar (DIAL) showed that the stratospheric impact on the tropospheric column was a common and pervasive
Correspondence to: R. Talbot (robert.talbot@unh.edu)
feature on all flights out of Honolulu and Anchorage. We propose that this is likely a major factor driving large-scale seasonality in Hg◦mixing ratios, especially at mid-latitudes, and an important process that should be incorporated into global chemical transport models.
1 Introduction
In the lower troposphere (0–6 km) elemental mercury (Hg◦) is observed ubiquitously with contemporary mixing ra-tios at the parts per quadrillion by volume (ppqv; 1 ng m−3=112 ppqv) level. Accumulation of mercury in lake sed-iments of both hemispheres shows a worldwide increase in its atmospheric deposition that is highly correlated with in-dustrialization and emissions of CO2 from combustion of
fossil fuels (Lamborg et al., 2002). Although atmospheric measurements are exceedingly sparse, mixing ratios near the Earth’s surface appear to have decreased from the mid-1980’s to 1990’s and stayed constant thereafter (Slemr and Scheel, 1998; Ebinghaus et al., 2002; Slemr et al., 2003; Kim et al., 2005).
The sources and sinks of atmospheric mercury are just be-ginning to be characterized and quantified. Anthropogenic sources appear to be dominated by emissions from combus-tion of coal, waste incineracombus-tion, space heating, transportacombus-tion, mining, and chlor-alkali facilitites (Seigneur et al., 2004, 2006). Natural emissions occur from mercury-enriched soils and vegetation, forest fires, volcanoes, and the oceans (Sigler et al., 2003; Sigler and Lee, 2006; Brunke et al., 2001; Friedli et al., 2001, 2003a, 2003b, 2004; Ebinghaus et al.,
2007). Global budget estimates put anthropogenic sources at ∼2100 metric tons yr−1with roughly twice that amount
de-rived from natural processes and re-emission (Seigneur et al., 2004; Mason and Sheu, 2002; Pacyna and Pacyna, 2002), for a total input of 6000–6500 metric tons yr−1(Streets et al., 2005). However, accurate estimation of natural source strengths is confounded by re-emission of anthropogenic mercury that has deposited to ecosystems and oceans.
There have been few measurements of Hg◦over the North Pacific. The first airborne observations were made during the ACE-Asia 2001 campaign over the western Pacific. Plumes containing industrial emissions contained the highest levels that reached 706, 336, and 336 ppqv from China, Korea, and Japan respectively (Friedli et al., 2004). Background concen-trations of Hg◦from the surface to 7 km were estimated to be about 146 ppqv. Overall, the vertical distribution of Hg◦was
∼224 ppqv at 0.5 km, decreasing slightly to 190 ppqv from 1 to 6 km, and then again sharply to 146 ppqv at 7 km. In a later ground-based study directly downwind of Asian continental outflow at Okinawa, Japan, the mean Hg◦concentration was 224 ppqv over the period 23 March to 2 May 2004 (Jaffe et al., 2005).
Asian Hg◦ emissions have also been assessed through sampling on the U.S. west coast at Mount Bachelor, Ore-gon. The site is located at 2.7 km altitude, with discrete Asian pollution plume events sampled periodically during spring-time. The instrument arrangement measured total gaseous and particulate Hg (TGM) with an average concentration of 198 ppqv from 28 March to 19 May 2004 (Weiss-Penzias et al., 2006). Time periods impacted by Asian emissions were identified by TGM-CO ratios characteristic of Asian sources (∼0.005 ng m−3/ppbv or 0.56 ppqv/ppbv). The largest of
these events (25 April) exhibited a TGM concentration near 280 ppqv, and a TGM-CO ratio of 0.045 ng m−3/ppbv or 5.0 ppqv/ppbv (Jaffe et al., 2005; Weiss-Penzias et al., 2006). Over the eastern Pacific in spring 2002, Radke et al. (2007) found much lower concentrations where the median ranged from 134 ppqv at 0.5 km to 56 ppqv at 8 km during the Inter-continental Transport and Chemical Transformation Experi-ment – 2002 (ITCT2K2). Using the variance of their mea-surements, a lifetime of ∼100 days was determined for Hg◦ compared to earlier estimates that suggested a much longer timeframe of 0.5–2 years (Schroeder and Munthe, 1998).
The Tropospheric Chemistry Program (TCP) at the Na-tional Aeronautics and Space Administration has conducted airborne science missions over the past 25 years to under-stand the human impact on the global atmosphere (McNeal et al., 1998). A primary focus has been on quantifying the impact of long-range transport of trace gases and aerosols on the changing chemical composition of the troposphere. Special emphasis has been placed on the North Pacific tro-posphere due to accelerating Asian emissions during the last two decades (Streets et al., 2001). Four major Pacific expe-ditions have been conducted by the TCP since 1991 (Hoell et al., 1996, 1997; Jacob et al., 2003), with the Intercontinental
Chemical Transport Experiment Phase B (INTEX-B) being the most recent one in spring 2006. Instrumentation for mea-surement of Hg◦was integrated into the University of New
Hampshire (UNH) flight package for INTEX-B to examine its large-scale distribution in North Pacific air masses travel-ing toward the North American continent.
2 Methods
2.1 Field deployments
The INTEX-B flight series was conducted in two deploy-ments, with the first component based out of Houston, Texas, and the second half split between Honolulu, Hawaii and Anchorage, Alaska. The six Houston flights (4– 19 March 2006) were focused on the Mexico City area and the MILAGRO mega-city air quality study occurring there 1–30 March 2006. After a three-week break with the aircraft based at Moffett Field, California, the DC-8 flew three flights out of Honolulu (23–28 April 2006) and then four additional flights from Anchorage (4–12 May 2006). There were an additional 3 transit flights between the hub locations. Mer-cury measurements were not obtained during the initial tran-sit from Grand Forks, North Dakota to Houston and then on the first local flight (#3) due to a data acquisition problem with the computer. Once this was corrected, data was ob-tained on all remaining flights.
2.2 Airborne measurements
The inlet arrangement utilized our existing high flow mani-fold (1500 standard liters per minute) for HNO3 (Talbot et
al., 1997a, 1999). It is designed with a diffuser that boosts the internal pressure of the inlet by up to 150 mbar over am-bient to facilitate attaining high flow rates in the upper tro-posphere, especially when the DC-8 is cruising at Mach 0.88 (Fig. 1). The diffuser and shroud assembly was anodized with mil-spec coating MIL-A-8625E, Chromic Type 1, Class Z with black color. This provided a very hard and smooth surface over the aluminum which reduced drag significantly and acted as an inert surface. The manifold pipe was coated with a vapor deposited fused-silica and heated to 40◦C dur-ing flight. Flow was maintained by ram pressure and a 400 Hz blower on the exhaust port. For the Hg◦measurements the high flow air stream was sub-sampled through a heated (40◦C) PFA Teflon line just a few centimeters after the flow
entered the main 10 cm diameter manifold (Fig. 1).
A modified Tekran 2537A cold vapor atomic fluorescence spectrometer was used to measure Hg◦in a sequential dual channel arrangement with a 150 s time response and limit of detection of ∼10 ppqv. Constant mass flow of 1.5 stan-dard liters per minute was stabilized through the instrument by the addition of a vacuum source from one of our venturi pumps used for aerosol sampling. The internal pressure of the instrument was maintained during the analysis stage at
Fig. 1. Schematic representation of custom cold vapor atomic fluorescence spectrometer configured for operation on the DC-8.
a slight overpressure to sea level using upstream control set to 1100 hPa. Mercury-free zero air was generated onboard the DC-8 using cabin air and our own Hg-stripping cartridge train assembly. Zeroing was performed in-flight, and there was no detectable Hg◦in the zero air stream at any time dur-ing INTEX-B.
To the best of our knowledge, we conducted the first in-flight standard additions for Hg◦. On non-flight days these were conducted on the ground and then on every sci-ence flight at altitudes ranging from 1–12 km. Overall, the Hg◦ permeation rate was reproducible to within ±9.2% at 0.098±0.009 ng min−1(n=312). Instrument calibration was cross-checked using injections from the headspace of a ther-moelectrically cooled Hg◦ reservoir (Tekran model 2505).
This was done during instrument integration prior to field de-ployment, and then again back at UNH after INTEX-B was completed. The calibration was reproducible to within ±3% over this five month time period. The response factor (peak area counts pg−1 Hg◦) was calculated for each of the two channels and found to be constant to ±1% for the entire data set (Fig. 2). The average response factor for each channel (7170 and 7325 counts pg−1)was used in the preparation of the final data to provide an internally consistent data product. The precision of the measurements was assessed by sampling ambient air at ground level using three
co-Fig. 2. Response factor of the modified instrument during
INTEX-B, including all ambient measurements and standard addition cali-brations.
located 2537A instruments. This was done at our lo-cal AIRMAP (www.airmap.unh.edu) field site (Thomp-son Farm) in Durham, New Hampshire (Mao and Talbot, 2004) immediately after the INTEX-B campaign. These
Fig. 3. Large-scale distribution of Hg◦in the Mexico City area and over the North Pacific.
instruments were inter-calibrated using a syringe injection from a Tekran 2505 unit prior to the ambient air measure-ment time periods. We found that two brand new instrumeasure-ments agreed within ±4–5%, while including a one-year old instru-ment in the average increased it to ±8–10%. Based on these comparisons, it appears that the precision is on the order of ±10%. The accuracy of the Hg◦ measurements should be around ±5% due to careful calibration with the headspace injections. This may need to be re-assessed when rigorous calibration standards are available from the US National In-stitute of Standards and Technology.
The Tekran instrument measures TGM
(Hg◦+RGM) as Hg◦ (reactive gaseous
mercury=RGM=HgCl2+HgBr2+HgOBr+. . . ). However, we
are not aware of any published information on the direct response of the 2537A to RGM species. At this time we do not have a reliable RGM calibration source in which we have high confidence regarding its operation and output; this is work in progress. In addition, we are unsure of the passing efficiency of RGM through our heated PFA line, but we configured our inlet design to facilitate its quantitative transfer based on extensive experience with airborne HNO3
measurements. We believe that it should pass RGM with high efficiency based on our current understanding of mea-suring highly reactive trace gases. In practice the amount of TGM measured over a several minute time interval essentially represents Hg◦ unless there is an unusually large amount of RGM present. In most environments, a few minute sampling resolution for RGM is too short to contribute to the measured TGM. Although the distribution of RGM is not known with much certainty, it is predicted to increase with altitude reaching ∼25 ppqv at 12 km (Selin et al., 2007). Until we have a better understanding of
atmospheric mercury and its speciation, we have chosen to report our TGM measurements as Hg◦.
The complementary data used here from numerous instru-ments has a long history of inclusion in the DC-8 TCP pay-load, and the techniques were essentially identical to those described previously by Jacob et al., (2003). Our analysis utilized data for in situ O3, CO, CO2, CH4, hydrocarbons,
halocarbons, and remotely sensed O3 from the DIAL. For
the in situ measurements, the TCP data center generated a merged product averaged to the Hg◦ time stamp. This was used extensively to understand the principal factors influenc-ing the large-scale distribution of Hg◦during INTEX-B.
3 Large-scale distribution
The large-scale distribution of Hg◦during flights 4–19 is pre-sented in Fig. 3. The majority of Hg◦ mixing ratios fell within the range of 60-150 ppqv in all three sampling re-gions. Exceptions to this were Hg◦ mixing ratios of 200–
500 ppqv in plumes in the vicinity of Mexico City and Hg◦
dropping to essentially zero in air masses at ≥10 km altitude that were impacted by stratospheric inputs. Relatively few distinct plumes of Asian continental outflow (>200 ppqv) were encountered over the eastern North Pacific. These in-teresting cases of high and low Hg◦ are examined in more detail in Sects. 3.2 and 3.3.
The vertical distribution of Hg◦, O3, and CO, covering the
latitudinal band of 14◦–62◦N over the North Pacific basin, is presented in Fig. 4. An interesting feature of the data from the Mexico City area was the strikingly reduced mixing ra-tios of CO, and to a lesser extent O3, above 4 km altitude.
Backward trajectories indicated that air masses sampled in the middle and upper troposphere originated over the tropi-cal North Atlantic. To illustrate this point, a 5-day kinematic backward trajectory, calculated by the Florida State Univer-sity group, is shown in Fig. 5. This trajectory corresponded to a constant altitude leg flown near the midpoint of flight 7. If the trajectories are run backward farther in time, most of them meander in the equatorial region in the Inter-Tropical Convergence Zone. This indicates that these air masses aged photochemically over the remote tropical North Atlantic.
The DIAL data show that there was a preponderance of low O3in the 20–40 ppbv range up to 12 km altitude. This
was apparent in the DIAL data for every flight conducted in the Mexico City area, and we use flight 7 to depict this pro-nounced feature in the vertical distribution (Fig. 6). The as-sociated air masses most likely originated at low altitude over the equatorial Atlantic and were lifted to higher altitudes by convective activity, as observed over the Pacific on previous DC-8 airborne missions (Browell et al., 1996, 2001, 2003a). The fact that Hg◦ did not follow the sharply decreased al-titudinal trend of CO (Fig. 4) indicates that it is not being depleted rapidly in the Tropics. In particular, abundant equa-torial OH does not appear to have a large impact on the Hg◦
Hgo, ppqv 0 50 100 150 200 250 0 2 4 6 8 10 12 14 Honolulu O3, ppbv 0 50 100 150 200 250 0 2 4 6 8 10 12 14 CO, ppbv 0 50 100 150 200 250 0 2 4 6 8 10 12 14 Hgo, ppqv 0 50 100 150 200 250 0 2 4 6 8 10 12 14 Anchorage O3, ppbv 0 50 100 150 200 250 0 2 4 6 8 10 12 14 CO, ppbv 0 50 100 150 200 250 0 2 4 6 8 10 12 14 Hgo, ppqv 0 50 100 150 200 250 Presure Altitude, km 0 2 4 6 8 10 12 14 Mexico City O3, ppbv 0 50 100 150 200 250 Pressure Altitude, km 0 2 4 6 8 10 12 14 CO, ppbv 0 50 100 150 200 250 Pressure Altitude, km 0 2 4 6 8 10 12 14
Fig. 4. Vertical distribution of Hg◦, O3, and CO covering the latitude band of 14–62◦N. Note that the high O3and low Hg◦present at
11.5 km occurred on the transit flight from Houston, TX to Moffett Field, CA (for details, see Talbot et al., 2007).
distribution. Indeed, slow removal of Hg◦in the troposphere
by OH was surmised recently through theoretical considera-tions by Calvert and Lindberg (2005).
Our data provide the first detailed look at the vertical distri-bution of Hg◦in the middle and upper troposphere (Fig. 4). In moving from low to high latitudes we observed the ex-pected patterns in O3and CO: (1) a general increase in CO
and the presence of distinct plumes due to transport of Asian emissions across the Pacific and, (2) an increasing impact of the stratosphere on the troposphere above 6 km resulting in increased O3and decreased CO. The overall corresponding
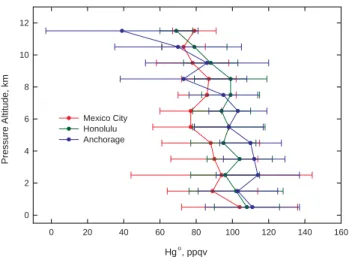
latitudinal trends in Hg◦ were subtle, as illustrated by the data binned (average ± standard deviation) in 1 km incre-ments (Fig. 7). In the boundary layer mixing ratios of Hg◦
were essentially indistinguishable between the three study re-gions. From 2–7 km the average mixing ratio of Hg◦ was
lowest around Mexico City and as much as 25 ppqv higher at mid-to-high latitudes over the North Pacific. Above 8 km there was little variation in the average mixing ratios of Hg◦ observed during the Mexico City based flights, with values centered around 80 ppqv. As the study area moved
north-ward, sharp decreases in average values were documented. At 11.5 km altitude, the steepest decline occurred in the high latitude flights out of Anchorage where the average mixing ratio of Hg◦ was 39±42 ppqv with a median of 13 ppqv. These low mixing ratios were driven by the substantial num-ber of 150 s measurement intervals with no detectable Hg◦ (Talbot et al., 2007).
In the Honolulu area we observed few plumes of Asian pollution (n=99 data in plumes) which presumably reduced the overall scatter in Hg◦mixing ratios. Our previous work has shown that most of the industrial pollution emanating from Asian sources in springtime is transported across the Pacific at latitudes >40◦N (Talbot et al., 1997b, 1999). Data obtained during flights based in Anchorage show a much stronger impact from Asia (n=247 data in plumes), and cor-respondingly more scatter in the Hg◦data with higher
maxi-mum values. The significant impact of combustion emissions is evident in the whole tropospheric column based on the dis-tribution of CO. In general, the FSU backward trajectories indicated that the Honolulu flights sampled air masses that originated at low latitudes over southern Asia. These regions
Fig. 5. Kinematic 5-day backward trajectory for the middle
tropo-sphere during flight 7.
Fig. 6. Vertical distribution of O3determined by the DIAL system
during flight 7 in the Mexico City area. Note the Mexico City urban plume embedded in O3<40 ppbv background air from the surface
to 12 km altitude.
have less urban-industrial sources than coastal northerly ar-eas of China, and could also contain dilute emissions from biomass burning in Southeast Asia.
The lowest average Hg◦mixing ratios between 2 and 6 km
altitude were observed in the Mexico City area (Fig. 7), which potentially could be related to emission of mega-city anthropogenic halogen compounds. On the other hand, the slightly lower Hg◦was associated with low CO (Fig. 4), and Hg◦could have been lowered by oxidation during aging in the Tropics. In the Tropics the air is generally moving ver-tically, so that boundary layer air gets mixed upward. Hg◦
UT, seconds 80000 80500 81000 81500 82000 82500 83000 Hg o, ppqv 0 50 100 150 200 CO, ppbv 0 200 400 600 800 C3 H8 , pptv and SO 2 , pptv 0 2000 4000 6000 8000 10000 12000 14000 16000 18000 Flight 6 UT, seconds 62000 62500 63000 63500 64000 Hg o, ppqv 0 100 200 300 400 500 CO, ppbv 0 200 400 600 800 1000 1200 C3 H8 , pptv and SO 2 , pptv 0 10000 20000 30000 40000 Flight 7
Fig. 7. Vertical distribution of Hg◦ based on binning the data in 1 km altitude increments. The data are plotted as the mean
±standard deviation.
might be reduced in the marine boundary layer due to its ox-idation by halogens, and this air was then transported ver-tically. A better understanding of the phenomena affecting Hg◦ will require additional measurements and modeling to
determine the relative influence of halogen chemistry with subsequent removal of RGM by precipitation scavenging.
There have been few measurements of Hg◦ over the oceans. Laurier et al. (2003) found a relatively constant 280 ppqv over the North Pacific during a May 2002 cruise between Osaka, Japan, and Honolulu, Hawaii. These rela-tively high concentrations were collected about ∼10 m above the sea surface and could be influenced by recent oceanic emissions of Hg◦. During ACE-Asia 2001 over the western Pacific Friedli et al. (2004) observed an average TGM con-centration of about ∼225 ppqv in the marine boundary layer (MBL). Over the eastern Pacific just offshore from Califor-nia, Oregon, and Washington in spring 2002, measurements of Hg◦ during ITCT2K2 yielded an average MBL concen-tration of ∼135±22 ppqv (Radke et al., 2007). The Radke et al. (2007) data are well within the range of our MBL (<2 km) grand mean value of 105±27 ppqv (n=691).
Interestingly, we observed mixing ratios of Hg◦ near 50 ppqv in the boundary layer (<2 km) in each of the study areas. The occurrence of these low values was about 10% of the time during the Mexico City flights, and decreased to only a few percent in Honolulu and Anchorage. These low values are likely related to halogen oxidation of Hg◦ with
C2Cl4, pptv 0.0 0.2 0.4 0.6 0.8 1.0 1.2 Hg o, ppqv 0 50 100 150 200 CO2, ppmv 380 382 384 386 388 390 392 394 Hg o, ppqv 0 50 100 150 200 CH4, ppbv 1760 1780 1800 1820 1840 1860 1880 1900 Hg o, ppqv 0 50 100 150 200 Mexico City CO, ppbv 0 50 100 150 200 250 300 Hg o, ppqv 0 50 100 150 200 C2Cl4, pptv 0.0 0.2 0.4 0.6 0.8 1.0 1.2 Hg o, ppqv 0 50 100 150 200 CO2, ppmv 380 382 384 386 388 390 392 394 Hg o, ppqv 0 50 100 150 200 CH4, ppbv 1760 1780 1800 1820 1840 1860 1880 1900 Hg o, ppqv 0 50 100 150 200 Honolulu CO, ppbv 0 50 100 150 200 250 300 Hg o, ppqv 0 50 100 150 200 C2Cl4, pptv 0.0 0.2 0.4 0.6 0.8 1.0 1.2 Hg o, ppqv 0 50 100 150 200 CO2, ppmv 380 382 384 386 388 390 392 394 Hg o, ppqv 0 50 100 150 200 CH4, ppbv 1760 1780 1800 1820 1840 1860 1880 1900 Hg o, ppqv 0 50 100 150 200 Anchorage CO, ppbv 0 50 100 150 200 250 300 Hg o, ppqv 0 50 100 150 200
Fig. 8. Regional correlations between Hg◦and CO2, CO, CH4, and C2Cl4.
subsequent removal of RGM in the MBL or from downward transport of stratospheric air containing low Hg◦. In most cases of low Hg◦ in the boundary layer the data indicated that the air masses were aged with relatively small mixing ratios of urban-industrial tracers such as C2Cl4and CHCl3.
The reason for the low Hg◦mixing ratios was not apparent in our data, but likely was caused by a combination of oxida-tion by halogens (Holmes et al., 2006) and stratospheric air occasionally reaching the surface (Talbot et al., 2007). 3.1 Correlation with source tracer species
Regional correlations between Hg◦and CO, CO2, CH4, and
C2Cl4 are illustrated in Fig. 8. Although these
relation-ships are somewhat diffuse, they suggest a continental urban source for Hg◦in the sampled air masses, especially at lat-itudes downwind of Asian and possibly European sources. It is well known that there is rapid and substantial export
of polluted air masses to the North Pacific from the Asian continent in springtime (Talbot et al., 1997b; Russo et al., 2003). Kinematic backward trajectories calculated along the INTEX-B flight tracks indicated that the plumes originated over the Asian continent usually 2–3 days prior to our sam-pling of them (not shown). The general correlation of Hg◦ with C2Cl4in these plumes is indicative of urban/industrial
sources, and there was also an identical relationship with CHCl3 (not shown) but not halon-1211 (CF2ClBr) which
is a fairly recent specific tracer of Chinese urban emissions (Blake et al., 2003). The apparent correlation of Hg◦ with
CH4and other hydrocarbons such as C2H6, C2H2, and C3H8
(not shown) likely reflects their co-located sources in Asia such as landfills, wastewater treatment, and bio/fossil fuel burning (Bartlett et al., 2003). There was little or no corre-lation of Hg◦with SO2, CO2, or aerosol-SO2−4 as might be
Hgo, ppqv 0 20 40 60 80 100 120 140 160 Pressure Altitude, km 0 2 4 6 8 10 12 Mexico City Honolulu Anchorage
Fig. 9. Selected plume composition at 2.6 km altitude around
Mex-ico City on flights 6 and 7.
combustion in China (Streets et al., 2005). This result prob-ably reflects the influence of wet convective processing on Asian sulfur emissions and a complexity of sources for CO2.
Overall, the correlations were weaker in the Honolulu dataset and essentially nonexistent around Mexico City ex-cept in concentrated pollution plumes. At low latitudes this may have been the result of aged well processed equato-rial air masses sampled above 2–3 km altitude. This con-sequently was reflected in, for example, the range in mix-ing ratios of CO2being several ppmv less at low compared
to mid-to-high latitudes (Fig. 8). These trends were present despite CO2reaching its seasonal maximum mixing ratio in
March (Mexico City) and approaching the high northern lat-itude minimum in May (Anchorage). This presumably re-flects the significant impact of combustion, presumably orig-inating in Asia, on the high latitude atmosphere.
Pollution plumes originating from Mexico City were eas-ily identifiable by their anomalously enriched mixing ra-tios of C3H8 (Blake and Rowland, 1995), on the order of
tens of ppbv. The largest mixing ratios of Hg◦ observed during INTEX-B were also found in these plumes. The plumes, sampled near 2.6 km (i.e., near the altitude of Mex-ico City), were thin well defined layers rich in combustion related trace gases represented by CO in Fig. 9. The highest mixing ratio of Hg◦in the Mexico City plumes approached 500 ppqv (Fig. 9, lower panel), coincident with C3H8
lev-els near 30 ppbv. While some of the C3H8 was
undoubt-edly a combustion byproduct, its exceedingly high mixing ratios and C2H6/C3H8 ratios <0.5 indicate that leakage is
still occurring from liquefied petroleum storage on a mas-sive scale as identified by Blake and Rowland (1995) more than a decade ago. Moreover, many of the layers contained mixing ratios of HCN and CH3CN at several ppbv which is
indicative of combustion contributions from biomass burn-ing. There were not, however, coincidently enhanced
mix-ing ratios of the biomass burnmix-ing tracer CH3Cl, a result that
complicates source identification. There was little correspon-dence between Hg◦ and SO
2 which presumably is due to
emissions from coal combustion, refineries, and active vol-canoes in the area. In fact, Hg◦and SO2were almost
anti-correlated in these layers (Fig. 9), and all the other ones en-countered during the Mexico City flight series. The plumes sampled during flights 6 and 7 were northeast of the city area and traveling toward the Gulf of Mexico. The flights on these two days covered nearly identical geographic paths. Back-ward trajectories indicated the air masses were over the Gulf of Mexico the previous day, then traveled directly over the urban area and headed back out to the ocean. The volcano Popocatepetl is south of the city area and at >5 km altitude, so we do not believe it was sampled by the DC-8. Our analy-sis of the composition of these Mexico City plumes indicates that widespread multi-source urban/industrial emissions may have a more important influence on Hg◦than specific point
sources.
3.2 Plume Hg◦– CO relationships
It is apparent from the vertical distributions of Hg◦and CO (Fig. 4) that pollution plumes were sampled in all three study areas. These data were extracted from the dataset by cal-culating the median CO mixing ratio in 2 km altitude bins to generate subsets with several hundred data points in each. The data corresponding to CO values greater than the median value are plotted in Fig. 10. We were able to fit the data from the flight series in Honolulu and Anchorage with a linear cor-relation that produced slopes of 0.37±0.07 ppqv/ppbv and 0.66±0.05 ppqv/ppbv respectively. The data obtained around the Mexico City area exhibited too much scatter to reliably determine a relationship between Hg◦and CO with the few measurements obtained in the highly concentrated plumes emanating from Mexico City. However, we estimated it to be very similar to the value determined for Honolulu, or around 0.30 ppqv/ppbv based on the sampling of selected plumes (Fig. 9). The lower ratio values around Mexico City and Honolulu compared to higher latitudes might reflect less con-tribution from coal-combustion and possibly a greater impact of biomass burning emissions. We also examined the Hg◦– CO2relationship in all three study locations, but the scatter
was too great to provide meaningful information.
For comparison to our Hg◦–CO correlations, Jaffe et al. (2005) reported a mean value of 0.63±0.18 ppqv/ppbv determined at Okinawa, Japan and a similar value for Asian plumes sampled at Mount Bachelor, Oregon. The Asian plume data collected at Mount Bachelor between March 2004 and September 2005 was summarized by Weiss-Penzias et al. (2007), and yielded 0.52±0.15 ppqv/ppbv. Friedli et al. (2004) also examined the Hg◦–CO relationship in Asian emissions over the western Pacific during ACE-Asia-2001. They found no clear relationship and attributed it to the suite of mixed combustion sources sampled in the
100 120 140 160 180 200 220 240 260 Hg o , ppqv 40 60 80 100 120 140 160 180 CO, ppbv 0 200 400 600 800 1000 1200 Hg o, ppqv 0 100 200 300 400 500 100 120 140 160 180 200 Hg o, ppqv 40 60 80 100 120 140 160 180 0.66 ppqv / ppbv r2 = 0.46 p = 0.014 0.37 ppqv / ppbv r2 = 0.21 p = 0.022 Anchorage Honolulu Mexico City
Fig. 10. Relationship between Hg◦ and CO in plumes with CO>median value in 2 km altitude bins.
same air masses. In the Shanghai plume, sampled sepa-rately, a value of 0.63 ppqv/ppbv was determined. These two studies close to Asia and our data for the central North Pacific all indicate that Asia, in particular continental out-flow from China, has a characteristic Hg◦–CO ratio near 0.56 ppqv/ppbv. In the U.S. with lower mercury emissions (Pacyna and Pacyna, 2002), we have determined a distin-guishing value for the Northeast of ∼0.22 ppqv/ppbv (Mao
Fig. 11. Vertical distribution of O3measured by the DIAL system along the flight track of mission 16. The three regions of Hg◦ de-pletion occurred north of 48◦N at 10 km altitude. These regions were well into the lower stratosphere as indicated by the O3mixing
ratios exceeding 100 ppbv.
et al., 2007). This value is similar to what was found on one flight over the Los Angeles Basin where the Hg◦–CO relationship varied from 0.17 to 0.27 ppqv/ppbv (Radke et al., 2007). Somewhat lower Hg◦–CO emission ratios re-sult from biomass burning in South America, South Africa, Canada, and the U.S., falling within the rather narrow range of 0.67–2.4±10−7mol/mol (∼0.16 ppqv/ppbv) (Ebinghaus
et al., 2007).
3.3 Hg◦depletion in upper troposphere
A prominent feature of the INTEX-B dataset was the fre-quent total depletion of Hg◦(∼zero ppqv) in the upper tropo-sphere/lower stratosphere (Figs. 4 and 7; Talbot et al., 2007). Depletion (i.e., Hg◦<50 ppqv, the minimum observed in the lower troposphere) was observed on four of the six flights flown from Anchorage, Alaska, and on one flight from Hous-ton, Texas to Moffett Field, California during March 2006. The mixing ratios of O3in these air masses were commonly
200–400 ppbv, and peaked near 1 ppmv during flight 14. A negative correlation between Hg◦and O3was also observed
previously at 6–8 km altitude during two ITCT2K2 flights along the US west coast (Radke et al., 2007).
The DIAL data, for example, show that on flight 16 the tropopause folding region north of 48◦N indicated that the
DC-8 was well within this stratospherically influenced re-gion during three Hg◦depletion events (Fig. 11). It also ap-pears that the stratospheric influence (i.e., elevated O3)
pen-etrated downward to 2 km altitude. Overall, the DIAL data demonstrate that a pervasive stratospheric impact on the tro-pospheric column was a common feature of all flights out of Honolulu and especially Anchorage.
Our previous measurements have shown that in tropo-spheric air impacted by stratotropo-spheric inputs there is good cor-respondence between O3and potential vorticity over large
re-gions (Browell et al., 2003 a, b). Mixing of stratospheric and tropospheric air would effectively reduce the mixing ratio of Hg◦in the free troposphere by addition of stratospheric air containing little or no Hg◦. Eventually this impact must filter down into the MBL, but there was no evidence of a gradi-ent in the Hg◦mixing ratio at low altitude (Fig. 7). Because tropopause folding events occur with highest frequency in late winter and spring (Seo and Bowman, 2001; Holton et al., 1995), they are likely a major factor driving large-scale seasonality in tropospheric Hg◦ mixing ratios. In fact, the INTEX-B data probably reflect the minimum annual level of Hg◦over the central and North Pacific basins. We note that a stratospheric influence is not evident in the boundary layer over populated mid-latitude continental areas due to active emission/sink processes obscuring the effect. A case in point is in the northeastern US where the UNH AIRMAP ground-based atmospheric mercury monitoring network shows a re-producible seasonality in Hg◦, driven largely by local re-moval processes, with the highest mixing ratios occurring in late March/early April and the lowest levels in late Septem-ber/early October (Mao et al., 2007).
4 Conclusions
Our findings increase the complexity required to simulate at-mospheric mercury with a global chemical transport model. Atmospheric Hg◦ at high latitudes over the north Pacific is impacted by heavy industrial emissions, including coal-combustion. General urban emissions appear to be impor-tant in the Honolulu area, and this may include biomass burning emissions from Southeast Asia. Around Mexico City there appears to be a general influence on Hg◦ from all types of combustion, and perhaps the volcanic emissions from Popocatepetl, although we seemingly did not sample this source directly. Reduced mixing ratios of Hg◦ in the middle troposphere around Mexico City may be related to emissions of anthropogenic halogen species. At all three study sites we observed reduced mercury (<50 ppqv) at low altitude, but could not determine the reason for it. It is likely related to oxidation by halogen species, perhaps ones with a natural source from the ocean, and subsidence of Hg◦
de-pleted air. At high altitude there was a significant impact of reduced Hg◦ mixing ratios from inputs of stratospheric air. Clearly, global atmospheric mercury cycling is multifaceted and very detailed simultaneous measurements of Hg◦, RGM, and HgP are highly desirable to gain increased insight on processes revealed by our dataset and better inform regional and global models.
Acknowledgements. We thank the flight crew of the NASA
DC-8 aircraft for their help with this field deployment and another successful airborne sciences mission. This work was
supported by the NASA Tropospheric Chemistry Program under grant #NNG06GA56G and the NOAA AIRMAP grant
#NA06OAR4600189 to UNH.
Edited by: A. B. Guenther
References
Bartlett, K. B., Sachse, G. W., Slate, T., Harward, C., and Blake, D. R.: Large-scale distribution of CH4in the western North
Pa-cific: Sources and transport from the Asian continent, J. Geo-phys. Res., 108(D20), 8807, doi:10.1029/2002JD003076, 2003. Blake, D. R. and Rowland, F. S.: Urban leakage of liquefied
petroleum gas and its impact on Mexico City air quality, Science, 269, 953–956, 1995.
Blake, N. J., Blake, D. R., Simpson, I. J., Meinardi, S., Swanson, A. L., Lopez, J. P., Katzenstein, A. S., Barletta, B., Shirai, T., Atlas, E., Sachse, G., Avery, M., Vay, S., Fuelberg, H. E., Kiley, C. M., Kita, K., and Rowland, F. S.: NMHCs and halocarbons in Asian continental outflow during the Transport and Chemical Evolution over the Pacific (TRACE-P) Field Campaign: Comparison with PEM-West B, J. Geophys. Res., 108(D20), 8806, 2003. Browell, E. V., Fenn, M. A., Butler, C. F., Grant, W. B., Merrill,
J., Newell, R. E., Bradshaw, J. D., Sandholm, S., Anderson, B., Bandy, A. R., Bachmeier, A. S., Blake, D. R., Davis, D. D., Gregory, G. L. , Heikes, B., Kondo, Y., Liu, S., Rowland, F. S., Sachse, G. W., Singh, H., Talbot, R. W., and Thornton, D. C.: Large-scale air mass characteristics observed over Western Pacific during summertime, J. Geophys. Res., 101(D1), 1691– 1712, 1996.
Browell, E. V., Fenn, M. A., Butler, C. F., Grant, W. B., Ismail, S., Ferrare, R. A., Kooi, S. A., Brackett, V. G., Clayton, M. B., Avery, M. A., Barrick, J. D. W., Fuelberg, H. E., Maloney, J. C., Newell, R. E., Zhu, Y., Mahoney, M. J., Anderson, B. E., Blake, D. R., Brune, W. H., Heikes, B. G., Sachse, G. W., Singh, H. B., and Talbot, R. W.: Large-scale air mass characteristics observed over the remote tropical Pacific Ocean during March-April 1999: Results from PEM-Tropics B field experiment, J. Geophys. Res., 106(D23), 32,481–32,501, 2001.
Browell, E. V., Fenn, M. A., Butler, C. F., Grant, W. B., Brackett, V. G., Hair, J. W., Avery, M. A., Newell, R. E., Hu, Y., Fuelberg, H. E., Jacob, D. J., Anderson, B. E., Atlas, E. L., Blake, D. R., Brune, W. H., Dibb, J. E., Fried, A., Heikes, B. G., Sachse, G. W., Sandholm, S. T., Singh, H. B., Talbot, R. W., Vay, S. A., and Weber, R. J.: Large-scale ozone and aerosol distributions, air mass characteristics, and ozone fluxes over the western Pacific Ocean in late winter/early spring, J. Geophys. Res., 108(D20), 8805, doi:10.1029/2002JD003290, 2003a.
Browell, E. V., Hair, J. W., Butler, C. F., Grant, W. B., DeYoung, R. J., Fenn, M. A., Brackett, V. G., Clayton, M. B., Brasseur, L. A., Harper, D. B., Ridley, B. A., Klonecki, A. A., Hess, P. G., Emmons, L. K., Tie, X., Atlas, E. L., Cantrell, C. A., Wimmers, A. J., Blake, D. R., Coffey, M. T., Hannigan, J. W., Dibb, J. E., Talbot, R. W., Flocke, F., Weinheimer, A. J., Fried, A., Wert, B., Snow, J. A., and Lefer, B. L.: Ozone, aerosol, potential vor-ticity, and trace gas trends observed at high-latitudes over North America from February to May 2000, J. Geophys. Res., 108(D4), 8369, doi:10.1029/2001JD001390, 2003b.
Brunke, E. G., Labyschagne, C., and Slemr, F.: Gaseous mercury emissions from a fire in the Cape Peninsula, South Africa, during January 2000, Geophys. Res. Lett., 28, 1483–1496, 2001. Calvert, J. G. and Lindberg, S. E.: Mechanisms of mercury removal
by O3and OH in the atmosphere, Atmos. Environ., 39,
3355-3367, 2005.
Ebinghaus, R., Kock, H. H., Coggins, A. M., Spain, T. G., Jen-nings, S. G., and Temme C. H.: Long-term measurements of atmospheric mercury at Mace Head, Irish west coast, between 1995 and 2001, Atmos. Environ., 36, 5267–5276, 2002. Ebinghaus, R., Slemr, F., Brenninkmeijer, C. A. M., van Velthoven,
P., Zahn, A., Hermann, M., O’Sullivan, D. A., and Oram, D. E.: Emissions of gaseous mercury from biomass burning in South America in 2005 observed during CARIBIC flights, Geophys. Res. Lett., 34, L08813, doi:10.1029/2006GL028866, 2007. Friedli, H. R., Radke, L. F., and Lu, J. Y.: Mercury in smoke from
biomass fires, Geophys. Res. Lett., 28(17), 3223–3226, 2001. Friedli, H. R., Radke, L. F., Lu, J. Y., Banic, C. M., Leaitch, W.
R., and MacPherson, J. I.: Mercury emissions from burning of biomass from temperate North American forests: laboratory and airborne measurements, Atmos. Environ., 37, 253–267, 2003a. Friedli, H. R., Radke, L. F., Prescott, R., Hobbs, P. V., and Sinha,
P.: Mercury emissions from the August 2001 wildfires in Wash-ington State and an agricultural waste fire in Oregon and atmo-spheric mercury budget estimates, Global Biogeochem. Cycles, 17(2), 1039, doi:10.1029/2002GB001972, 2003b.
Friedli, H. R., Radke, L. F., Prescott, R., Li, P., Woo, J.-H., and Carmichael, G. R.: Mercury in the atmosphere around Japan, Ko-rea, and China as observed during the 2001 ACE-Asia field cam-paign: Measurements, distributions, sources, and implications, J. Geophys. Res., 109, D19S25, doi:10.1029/2003JD004244, 2004.
Hoell, J. M., Davis, D. D., Liu, S. C., Newell, R., Shipham, M., Akimoto, H., McNeal, R. J., Bendura, R. J., and Drewry, J. W.: Pacific Exploratory Mission-West (PEM-West A): September– October 1991, J. Geophys. Res., 101(D1), 1641–1654, 1996. Hoell, J. M., Davis, D. D., Liu, S. C., Newell, R. E., Akimoto,
H., McNeal, R. J., and Bendura, R. J.: The Pacific Exploratory Mission-West Phase B: February-March, 1994, J. Geophys. Res., 102(D23), 28 223–28 240, 1997.
Holmes, C. D., Jacob, D. J., and Yang, X.: Global life-time of elemental mercury against oxidation by atomic bromine in the free troposphere, Geophys. Res. Lett., 33, L20808, doi:10.1029/2006GL027176, 2006.
Holton, J. R., Haynes, P. H., McIntyre, M. E., Douglass, A. R., Rood, R. B., and Pfister, L.: Stratosphere-troposphere exchange, Rev. Geophys., 33, 403–439, 1995.
Jacob, D. J., Crawford, J. H., Kleb, M. M., Connors, V. S., Bendura, R. J., Raper, J. L., Sachse, G. W., Gille, J. C., Emmons, L., and Heald, C. L.: Transport and Chemical Evolution over the Pacific (TRACE-P) aircraft mission: Design, execution, and first results, J. Geophys. Res., 108(D20), 9000, doi:10.1029/2002JD003276, 2003.
Jaffe, D., Prestbo, E., Swartzendruber, P., Weiss-Penzias, P., Kato, S., Takami, A., Hatakeyama, S. and Kajii, Y.: Export of atmo-spheric mercury from Asia, Atmos. Environ., 39, 3029–3038, 2005.
Kim, K.-H., Ebinghaus, R., Schroeder, W. H., Blanchard, P., Kock, H. H., Steffen, A., Froude, F. A., Kim, M.-Y., Hong, S., and
Kim, J.-H.: Atmospheric mercury concentrations from several observatory sites in the northern hemisphere, J. Atmos. Chem., 50, 1–24, 2005.
Lamborg, C. H., Fitzgerald, W. F., Damman, A. W. H., Benoit, J. M., Balcom, P. H., and Engstrom, D. R.: Modern and historic atmospheric mercury fluxes in both hemispheres: Global and re-gional mercury cycling implications, Global Biogeochem. Cy-cles, 16(4), 1104, doi:10.1029/2001GB001847, 2002.
Laurier, F. J. G., Mason, R. P., Whalin, L., and Kato, S.: Reactive gaseous mercury formation in the North Pacific Ocean’s marine boundary layer: A potential role of halogen chemistry, J. Geo-phys. Res., 108(D17), 4529, doi:10.1029/2003JD003625, 2003. Mao, H., and Talbot, R.: Role of meteorological processes in two
New England ozone episodes during summer 2001, J. Geophys. Res., 109, D20305, doi:10.1029/2004JD004850, 2004.
Mao, H., Talbot, R., Sigler, J., Sive, B., and Hegarty, J.: Seasonal and diurnal variations of Hg◦over New England, Atmos. Chem. Phys., 8, 1403–1421, 2008,
http://www.atmos-chem-phys.net/8/1403/2008/.
Mason, R. P., and Sheu, G.-R.: Role of the ocean in the global mercury cycle, Global Bio. Cycles, 16(4), 1093, doi:10.1029/2001GB001440, 2002.
McNeal, R. J., Jacob, D. J., Davis, D. D., and Liu, S. C.: NASA Global Tropospheric Experiment, IGACtivities Newsletter, No. 13, NOAA Pacific Marine Environmental Laboratory, Seattle, Washington. Available at: http://www.igac.noaa.gov/newsletter/ highlights/1998/gte.php, 1998.
Pacyna, E. G. and Pacyna, J. M.: Global emission of mercury from anthropogenic sources in 1995, Water, Air, and Soil Pollution, 137,149–165, 2002.
Radke, L. F., Friedli, H. R., and Heikes,B. G.: Atmospheric mercury over the NE Pacific during spring 2002: Gradi-ents, residence time, upper troposphere lower stratosphere loss, and long-range transport, J. Geophys. Res., 112, D19305, doi:10.1029/2005JD005828, 2007.
Russo, R. S., Talbot, R. W., Dibb, J. E., Scheuer, E., Seid, G., Jor-dan, C. E., Fuelberg, H. E., Sachse, G. W., Avery, M. A., Vay, S. A., Blake, D. R., Blake, N. J., Atlas, E., Fried, A., Sand-holm, S. T., Tan, D., Singh, H. B., Snow, J., and Heikes, B. G.: Chemical composition of Asian continental outflow over the western Pacific: Results from Transport and Chemical Evolution over the Pacific (TRACE-P), J. Geophys. Res., 108(D20), 8804, doi:10.1029/2002JD003184, 2003.
Schroeder, W. H. and Munthe, J.: Atmospheric mercury - an overview, Atmos. Environ., 5, 809–822, 1998.
Seigneur, C., Vijayaraghavan, K., Lohman, K., Karamchandani, P., and Scott, C.: Global source attribution for mercury deposition in the United States, Environ. Sci. Technol. 38, 555–569, 2004. Seigneur, C., Vijayaraghavan, K., and Lohman, K.,:
Atmo-spheric mercury chemistry: Sensitivity of global model simu-lations to chemical reactions, J. Geophys. Res., 111, D22306, doi:10.1029/2005JD006780, 2006.
Selin, N. E., Jacob, D. J., Park, R. J., Yantosca, R. M., Strode, S., Jaegl´e, L., and Jaffe, D.: Chemical cycling and deposition of atmospheric mercury: Global constraints from observations, J. Geophys. Res., 112, D02308, doi:10.1029/2006JD007450, 2007. Seo, K.-H. and Bowman, K. P.: A climatology of isentropic cross-tropopause exchange, J. Geophys. Res., 106, 28 159–28 172, 2001.
Sigler, J. M., and Lee, X.: Gaseous mercury in background for-est soil in the northeastern United States, J. Geophys. Res., 111, G02007, doi:10.1029/2005JG000106, 2006.
Sigler, J. M., Lee, X., and Munger, W.: Emission and long-range transport of gaseous mercury from a large-scale Canadian boreal forest fire, Environ. Sci. Technol., 37, 4343–4347, 2003. Slemr, F., Brunke, E.-G., Ebinghaus, R., Temme, C., Munthe, J.,
W¨angberg, I., Schroeder, W., Steffen, A., and Berg, T.: World-wide trend of atmospheric mercury since 1977, Geophys. Res. Lett., 30(10),1516, doi:10.1029/2003GL016954, 2003. Slemr, F. and Scheel, H. E.: Trends in atmospheric mercury
concen-trations at the summit of the Wank Mountain, Southern Germany, Atmos. Environ., 32(5), 845–853, 1998.
Streets, D. G., Hao, J., Wu, Y., Jiang, J., Chan, M., Tian, H., and Feng, X.: Anthropogenic mercury emissions in China, Atmos. Environ., 39, 7789–7806, 2005.
Streets, D. G., Tsai, N. Y., Akimoto, H., and Oka, K.: Trends in emissions of acidifying species in Asia, 1985– 1997, Water, Air and Soil Pollution, 130, 187–192, doi:10.1023/A:1013883628877, 2001.
Talbot, R. W., Dibb, J. E., Lefer, B. L., Scheuer, E., Bradshaw, J. D., Sandholm, S. T., Smyth, S., Blake, D. R., Blake, N. J., Sachse, G. W., Collins, Jr., J. E., and Gregory, G. L.: Large scale distri-butions of tropospheric nitric, formic, and acetic acids over the western Pacific basin during wintertime, J. Geophys. Res., 102, 28 303–28 313, 1997a.
Talbot, R. W., et al.: Chemical characteristics of continental outflow from Asia to the troposphere over the western Pacific Ocean dur-ing February-March 1994: Results from PEM-West B, J. Geo-phys. Res., 102, 28 255–28 274, 1997b.
Talbot, R. W., Dibb, J. E., Scheuer, E. M., Kondo, Y., Koike, M., Singh, H. B., Salas, L. B., Fukui, Y., Ballentine, J. O., Meads, R. F., Miller, T. M., Hunton, D. E., Viggiano, A. A., Blake, D. R., Blake, N. J., Atlas, E., Flocke, F., Jacob, D. J., and Jaegle, L.: Reactive nitrogen budget during the NASA SONEX mission, Geophys. Res. Lett., 26, 3057–3060, 1999.
Talbot, R., Mao, H., Scheuer, E., Dibb, J., and Avery, M.: Total depletion of Hg◦ in the upper troposphere-lower stratosphere, Geophys. Res. Lett., 34, L23804, doi:10.1029/2007GL031366, 2007.
Weiss-Penzias, P., Jaffe, D. A., Swartzendruber, P., Dennison, J. B., Chand, D., Hafner, W., and Prestbo, E.: Observations of Asian air pollution in the free troposphere at Mount Bachelor Observa-tory during the spring of 2004, J. Geophys. Res., 111, D10304, doi:10.1029/2005JD006522, 2006.
Weiss-Penzias, P., Jaffe, D., Swartzendruber, P., Hafner, W., Chand, D., and Prestbo, E.: Quantifying Asian and biomass burning sources of mercury using the Hg/CO ratio in pollution plumes observed at the Mount Bachelor observatory, Atmos. Environ., 41, 4366–4379, 2007.