Chapter 5
C
HARACTERIZING
A
LTERATIONS IN THE
S
ECONDARY
S
TRUCTURE OF
T
YPICAL
P
ROTEINS UNDER
E
XPOSURE TO
E
LECTROMAGNETIC
F
IELDS
Emanuele Calabrò
1,5,6,*and Salvatore Magazù
1,2,3,41
Department of Mathematical and Informatics Sciences, Physical Sciences and Earth Sciences of Messina University, Messina, Italy
2
Le Studium, Loire Valley Institute for Advanced Studies, Orléans & Tours, France
3
Centre de Biophysique Moleculaire (CBM)-CNRS UPR 4301 du CNRS, Orleans, France; Laboratoire Interfaces, Confinement,
Matériaux et Nanostructures (ICMN) - UMR 7374 CNRS - Université d’Orléans, Orléans, France
4Istituto Nazionale di Alta Matematica “F. Severi” – INDAM -
Gruppo Nazionale per la Fisica Matematica – GNFM, Rome, Italy
5Interuniversity Consortium of Applied Physical Sciences (CISFA),
Messina, Italy
6Industrial Technical Institute “Verona Trento-Majorana-Marconi,”
Messina, Italy
* Corresponding author: e.calabro@yahoo.com.
A
BSTRACTOver the past decades, the growing demand for electric power, electronic devices and radio frequency patterns has induced human beings to use low- and high-frequency electromagnetic fields.
Nevertheless, previous research has shown that exposure to electromagnetic fields can induce health effects in living organisms. In particular, several epidemiological studies have reported a correlation between an increased risk of cancer and exposure to extremely low-frequency electromagnetic fields. Also, in vitro tests have demonstrated that radio frequencies and microwaves emitted by mobile phones and other electronic devices can be carcinogenic and cause DNA damage and chromosome aberrations.
In order to investigate accurately the alterations in living things induced by electromagnetic fields, the effects of exposure of typical proteins to low-frequency electromagnetic fields and to microwaves have been studied. Indeed, proteins are fundamental in the organic metabolism of living creatures and it has been clearly demonstrated that several types of environmental stress agents can alter the secondary structure of proteins.
To this aim, Fourier Transform Infrared (FTIR) Spectroscopy was used to investigate the structure of proteins in a water solution, because it may be considered the most versatile spectroscopic technique for analyzing the secondary structure of a protein in various physiochemical environments. In fact, infrared spectroscopy detects transitions between rotational and vibration energy levels, yielding much more information on molecular structure, in particular on proteins.
FTIR spectroscopy analysis showed that exposure to electromagnetic fields at intensities below the levels recommended by the International Commission on Non-Ionizing Radiation Protection, alters the secondary structure of typical proteins such as hemoglobin, myoglobin, bovine serum albumin and lysozyme. In particular, it was shown that exposure to electromagnetic fields induces the unfolding of proteins represented by transitions from the α-helix to the β-sheet structure, which may be responsible for the aggregation phenomena. Protein aggregation can lead to neurotoxic and neurodegenerative disorders that are the precursors of some pathologies.
1.
I
NTRODUCTIONModern technology uses various energy forms, the most widely of which is electricity. Electric power is produced in power stations and transmitted to urban centers by high voltage transmission lines that generate extremely low-frequency electromagnetic fields (ELF-EMFs).
Transport systems such as trams and electric trains, magnetic resonance imaging, industrial processes such as aluminum production or commonly used devices such as audio speaker components are generated by static magnetic fields (SMFs). Furthermore, radio stations and wireless home devices have considerably increased in the last three decades, producing high frequency electromagnetic fields (HF-EMFs) in the environment, represented by radio frequencies (RFs) and microwaves (MWs).
A large scientific production has shown that exposure of organic systems to EMFs induces harmful effects.
In particular, the World Health Organization (WHO) highlighted the potential health effects of ELF-EMFs and SMFs (WHO, 1984, 1987). The International Agency for Research on Cancer (IARC, 2002) evidenced in its study that ELF-EMF can be carcinogenic to humans.
Furthermore, the large achievement of wireless technology has induced living organisms to be continuously exposed to HF-EMFs, and a correlation between increased cancer risk and exposure to HF-EMFs was evidenced (WHO, 1993). The European Commission Scientific Committee on Emerging and Newly Identified Health Risks (SCENIHR) published an assessment in 2007 in which it was demonstrated that more studies concerning health effects on children are needed (European Commission, 2006).
The amount of these results has induced the International Commission on Non-Ionizing Radiation Protection (ICNIRP) to publish international guidelines in order to establish field strength limits of EMFs that cannot be exceeded. In particular, ICNIRP recommends an exposure limit to ELF-EMF of 1 mT (ICNIRP, 2010) and exposure limit to SMF of 400 mT (ICNIRP, 2009) for occupational exposure and general public exposure,
respectively. The ICNIRP published guidelines regarding exposure to HF-EMFs that were reported (ICNIRP, 1998). For instance, the reference level of power density for general public exposure to HF-EMF in the range from 400 to 2000 MHz can be obtained by the expression P = f / 200 (W/m2)
(ICNIRP, 1998). Considering the frequencies of 900 and 1800 MHz generally used by GSM system for mobile phones, we obtained the exposure limits of 4.5 W/m2 and 9 W/m2, respectively.
Nevertheless, recent studies carried out using Fourier Transform Infrared (FTIR) Spectroscopy have demonstrated that significant alterations in simple organic systems occurred after exposure to EMFs even below the limits recommended by ICNIRP. FTIR spectroscopy can provide accurate information above all on organic compounds and in particular on the secondary structure of proteins, such as it was largely demonstrated in literature up until now (Byler and Susi, 1986; Surewicz and Mantsch, 1988; Jung, 2000).
Indeed, proteins generally exhibit α-helical and β-sheet components in the Amide I and II regions in the spectral range from 1700 to 1500 cm-1.In
biophysics the interest regarding α-helix and β-sheet structures is related to several studies that have highlighted that transitions from α-helix to a β-sheet component may be related to aggregation processes that can lead to neurotoxicity and neurodegenerative disorders. In this regard, FTIR spectroscopy can be successfully applied in biomedicine for detecting changes of molecular compositions and structures that can produce a transformation from a normal to damaged cell state. FTIR spectroscopy has given proof to be a powerful tool for studying tissues, biological fluids, cells and proteins, detecting changes in the chemical composition of organic systems (Rigas et al., 1990; Cohenford and Rigas, 1998; Diem et al., 1999). In particular, IR spectroscopy can provide information on the secondary structure of proteins, such as it was demonstrated in previous literature (Elliot and Ambrose, 1950; Ambrose and Elliot, 1951; Elliot, 1954).
In this chapter, the effects of typical protein exposure to EMFs have been accurately determined.
2.
M
ATERIALS ANDM
ETHODS2.1. Hemoglobin Samples
Hemoglobin (HB) was obtained from human blood samples by venipuncture from healthy human subjects (ages 18–30) living in southern Italy. Blood samples were treated by means of techniques accurately described in (Magazù et al., 2010) in order to obtain pure hemoglobin solutions separated by insoluble stroma. For each sample, four HB solutions were prepared at 150mg/ml concentration in bidistilled water.
2.2. Bovine Serum Albumin, Myoglobin and Lysozime Samples
Lyophilized bovine serum albumin (BSA), myoglobin (MB), and lysozime (LYS) were purchased from Sigma Chemical (St. Louis, MO). Prior to infrared spectroscopy, each protein was dissolved in D2O at 20°Cat the concentration of 100 mg/ml, obtained by means of gentle agitation. After these treatments, proteins solutions were placed in sterile microcentrifuge tubes, polypropylene, 1.5 ml capacity (BR780400, Sigma– Aldrich, Milan, Italy) and submitted to the following assays.
2.3. Experimental Design
The exposure system used to obtain a uniform 50 Hz magnetic field consisted of a couple of Helmholtz coils, with pole pieces of round parallel polar faces, to produce a uniform magnetic field at the center of the coils distance.
This device was used to generate time-varying electromagnetic fields at the frequency of 50 Hz by means of a AC voltage regulating up to 230 volt, which enabled us to change the magnetic flux density up to 1 mT between the polar faces of the coils. Samples were placed at the center of a
uniform field area between the coils. The magnetic field was continuously monitored by a magnetic field probe (GM07 Gaussmeter of HIRST-Magnetic Instruments Ltd - UK).
The exposure system used to generate MWs radiation consisted of an operational mobile phone, model Samsung GT-E1270. Signal provider was Vodafone and the microcell was placed close to the Department of Mathematical and Informatics Sciences, Physical Sciences and Earth Sciences of Messina University (Italy).
Samples of 200 ml of each protein solution were placed at 4 cm from the mobile phone, and were exposed for 4 h to GSM signal at 1765 MHz.
The EMF was monitored by a SRM-3000 instrument of Narda Safety Test Solutions. The device was linked through a cable to a Narda three axis antenna covering the frequency range 75MHz–3 GHz. Spectrum Analysis mode was chosen as preliminary analysis to detect MWs frequency value impinging the three axis antenna, transmitted by the local base station. Intensities of electromagnetic components of MWs were continuously monitored by Time Analysis mode. This operating mode allowed timer-controlled measurements at a defined frequency, monitoring EMF level during exposure.
2.4. Infrared Spectroscopy
FTIR absorption spectra were recorded at room temperature by a spectrometer Vertex 80v of Bruker Optics.
HB, MB, BSA, and LYS solutions samples of 200 μL, were placed between a pair of CaF2 windows separated with a 25 mm Teflon spacer.
For each spectrum 128 interferograms were collected with a spectral resolution of 4 cm-1 in the mid-infrared range. Infrared (IR) spectra of the
used solution were subtracted from spectra of each protein at the corresponding temperature. Smoothing correction for atmospheric water background was performed. In addition, IR spectra were baseline corrected and area normalized for exposed proteins solutions and control samples. In
particular, vector normalization was used, calculating average value of spectrum and subtracting from the spectrum decreasing the mid-spectrum.
Automatic baseline scattering correction function was used to subtract baselines from spectra. In addition, interactive baseline rubber band correction was used. This method uses a rubber band stretched from one spectrum end to the other, and the band is pressed onto the spectrum from the bottom up with varying intensity. This method performs iteratively, depending on the number of iterations. Result spectrum will be the original spectrum less baselines points manually set and a subsequent concave rubber band correction.
Fourier self-deconvolution (FSD) analysis was also used to highlight features of the acquired spectra. This method is based on the assumption that a spectrum of single narrow bands is broadened in liquid or solid state and cannot be distinguished in the amide envelope. A curve fitting procedure can be applied to estimate quantitatively the area of each component representing a type of secondary structure. The aim of the curve-fitting approach to secondary structure analysis is to decompose the Amide I band into the various component bands that can then be assigned to different types of secondary structure. Hence, the Amide I band was deconvoluted with a Lorentzian line shape function and deconvoluted spectrum was fitted with Gaussian band shapes by an iterative curve fitting procedure. Finally, derivative techniques were used. In the second-derivative spectrum, the intrinsic shape of an IR absorbance is approximated by a Lorentzian function (Surewicz and Mantsch, 1988), and the peak frequency is practically identical to the original peak frequency, but the half-bandwidth is reduced. The height of a second-derivative peak is proportional to the original peak height with an opposite sign, and the half-bandwidth of the second-derivative peak is proportional to the original half-bandwidth (Susi and Byler, 1986). The derivative analysis calculates the first to fifth derivative of a spectrum, using the Savitzky–Golay algorithm.
3.
P
ROTEINSU
NFOLDINGI
NDUCED BYE
XPOSURE TOEMF
SFTIR spectroscopy analysis of typical proteins in H2O or in deuterated
form evidenced α-helical components in the Amide I and Amide II regions in the spectral ranges from 1648 to 1657 cm-1 and from 1545 to 1555 cm-1,
respectively. Otherwise, proteins with a predominantly β-sheet structure can exhibit similar absorptions in the ranges 1628 – 1635 cm-1 and 1520 –
1530 cm-1 (Ismail et al., 1992; Lefevre and Subirade, 2000).
The α-helix component is characterized by a structure in which the polypeptide main chain is tightly coiled and forms the inner part of the rod. Hydrogen bonds between NH and CO groups of the main chain stabilize the α-helix. In contrast, the β-sheet feature is almost fully extended rather than being tightly coiled as in the α-helix. Also the β-sheet structure is stabilized by hydrogen bonds between NH and CO groups in different polypeptides chains, whereas in proteins α-helices the hydrogen bonds are formed between NH and CO groups in the same polypeptide chain. The interest regarding proteins α-helix and β-sheet structures is mainly related to some research that evidenced that the transition from α-helix to β-sheet can be related to aggregation processes that can be correlated to neurotoxicity and neurodegenerative disorders (Bauer et al., 2000).
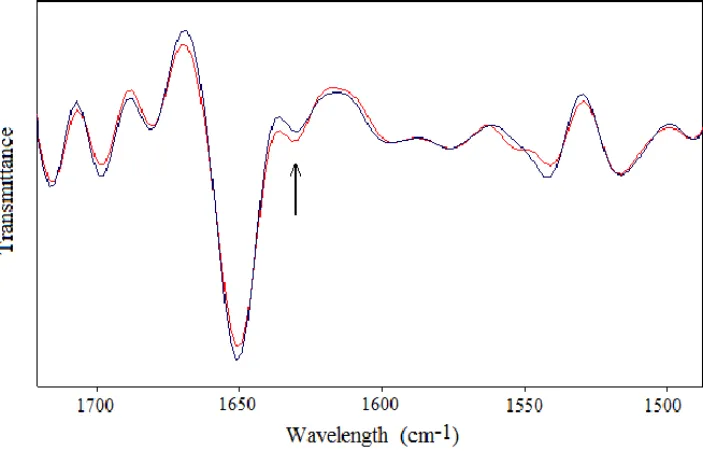
Previous studies reported in (Calabrò et al., 2013) evidenced significant transitions from proteins α-helix component to β-sheet features and a shift to lower frequencies of the Amide I vibration, occurred in neuronal-like cells exposed to a SMF around 2 mT, such as represented in Figure 1, suggesting that aggregation mechanisms occurred after exposure. Transitions from α-helix component to β-sheet features were also observed in HB (see Figure 2), in BSA and in neuronal-like cells after 3 h exposure to ELF-EMF at 1 mT (Magazù, Calabrò and Campo, 2010; Magazù and Calabrò, 2011).
Figure 1. Second-derivative spectral analysis in the region of Amide I and Amide II vibrationsafter 15 hours of exposure of neuronal-like cells to a SMF at the intensity of 2,2 mT (the clear line represents the exposed sample spectrum). The relative increase of the β-sheet content at 1635 cm-1 with respect to the α-helix component was
evidenced by an arrow (Calabrò et al., 2013).
Figure 2. Second-derivative spectra of Amide I and Amide II of hemoglobin in bidistilled water aqueous solutions after 3 h of exposure (the clear line represents the spectrum of exposed sample). The relative increase in β-sheet content at 1635 cm-1
(indicated by an arrow) as to the α-helix component can be observed (Magazù et al., 2010).
These findings confirmed that unfolding and aggregation occurs in proteins after exposure to EMFs at intensities below the limits recommended by ICNIRP (2009, 2010).
Also exposure to HF-EMFs, at the intensity around 1 W/m2 (that is,
below the limit recommended by ICNIRP for exposure to HF-EMF (ICNIRP, 1998), induced proteins unfolding and aggregation. In particular, this result was observed in typical proteins in aqueous solution, exposed for 3-6 h to mobile phone MWs at 900 or 1800 MHz (Calabrò and Magazù, 2010; Calabrò, Magazù and Campo, 2012; Calabrò and Magazù, 2013; Calabrò and Magazù, 2015a; Calabrò and Magazù, 2015b; Calabrò and Magazù, 2016; Calabrò and Magazù, 2017c). Typical exposed and unexposed second-derivative spectra of BSA are represented in Figure 3.
Figure 3. Second-derivative spectra of Amide I and Amide II of bovine serum albumin after exposure to MWs at 900 MHz at the intensity of 1 mT (the clear line represents exposed sample spectrum). The relative increase in intensity of the β-sheet content at 1635 cm-1 as to the α-helix component is indicated by an arrow. (Calabrò and Magazù,
This result suggested the hypothesis that exposure to HF-EMFs can be a cofactor for some diseases in humans. Indeed, in previous literature it was suggested that neurological disorders such as Alzheirmer, Parkinson and Huntington can be related to proteins aggregation in the fibrillar form (named ‘amyloid’) that can be associated with signs of neurodegeneration (Mattson, 1994; Offen, 2000; Dobson, 2001; Brzyska et al., 2001; Squier, 2001; Pogocki, 2003). Also, some forms of anemia can be related to the formation of aggregated (Pauling et al., 1949; Pintado and Maldonado, 1976; Chen et al., 2004; Tripette et al., 2009). In particular, aggregation can be found in cancer diseases and in childhood cancer (Neale et al., 2013).
4.
I
NCREASING OFH
YDROGENB
ONDING INP
ROTEINSI
NDUCED BY50
H
ZE
LECTROMAGNETICF
IELDSFTIR spectroscopy was used to study structural changes of vibration bands in the secondary structure of HB and BSA, induced by 3 h exposure to 50 Hz EMF at 1 mT. To this aim, samples of 200 mL of HB and BSA in bidistilled water solution were exposed to ELF-EMF and unexposed samples were used as the control. The intensity of the magnetic flux density at 1 mT corresponds to the reference level recommended by the ICNIRP for occupational exposure (ICNIRP, 2010).
Furthermore, exposure up to 3 h was carried out. Indeed, exposure longer than 3 or 4 hours cannot provide reliable results due to the relatively low surface tension of the investigated system (Jannelli et al., 1994; Magazù, 2000).
Exposed and unexposed spectra exhibited mainly the Amide A band, centered at 3293 cm-1, an intense Amide I vibration, centered at 1654 cm-1,
that is due to C=O stretching vibration and N-H bending mode in the α-helix structure, and the Amide II vibration band at 1545 cm-1, that is due to
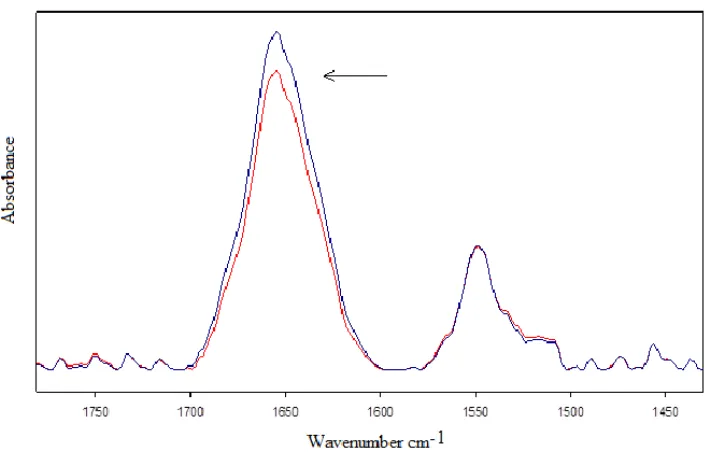
Typical exposed and unexposed spectra of HB and BSA in bidistilled water solution, obtained using Fourier Self-Deconvolution (FSD) analysis, were represented in Figure 4 and Figure 5, respectively.
Figure 4. Fourier self-deconvolution analysis of hemoglobin in bidistilled water solution after 3 h of exposure to 50 Hz electromagnetic field at 1 mT (the clear line refers to exposed sample). The increasing in intensity of the absorbance signal of the Amide II band and of the β-sheet component (indicated by arrows) occurred after exposure (Calabrò and Magazù, 2017a).
The FSD analysis of HB in water solution highlighted three bands in the Amide I region centered at 1654.7, 1633, and 1682.5 cm-1 that can be
attributed to the α-helix, parallel β-sheet and β-turn structures, respectively (Ismail et al., 1992; Huang et al., 1995; Lefevre and Subirade, 2000). Moreover, the Amide II band was evidenced around 1545 cm-1. This
analysis revealed an increase in intensity of the absorbance signal of the Amide II band with respect to the Amide I mode and a significant up-shift of 1.7 cm-1 of the Amide II (p < 0.05) comparing the spectra of exposed
Figure 5. Fourier self-deconvolution analysis of bovine serum albumin in bidistilled water solution after 3 h of exposure to 50 Hz electromagnetic field at 1 mT (the clear line refers to exposed sample). The decrease in intensity of the absorbance signal of the Amide I band occurred after exposure (Calabrò and Magazù, 2015a).
These results can be explained as follows. The application of the EMF induces an electronic density redistribution which produces an increasing in the oxygen and nitrogen negative charge and in the positive charge in the amide hydrogen, producing the Amide II frequency upshift.
The structure of the amide bond is stabilized by the hydrogen bonding, inducing an increasing in the C–N bond and the C=O bond decreasing, to which C–N bond length decreasing and C=O bond length increasing should be related, respectively. In fact, hydrogen bond increasing should weaken the C=O bond because the decrease in the electron density of the bond. Otherwise, we know that the spectral contribution of the C=O hydrogen bonding in the Amide I band is much larger than is N–H hydrogen bonding. Nevertheless, the spectral contribution of N–H hydrogen bonding in the Amide II vibration is considerably larger than is C=O hydrogen bonding (Calabrò and Magazù, 2017a).
As a result, the Amide I band frequency and its absorbance signal should decrease, whilst the Amide II band frequency and absorbance signal
are expected to increase with increasing of hydrogen bonding (Milner-White, 1997; Mikhonin et al., 2004; Mikhonin et al., 2006).
The increase of β-sheet content at 1635 cm-1 in the Amide I region of
HB exposed spectrum, which can be observed in Figure 4, evidenced a mechanism of unfolding after exposure. Indeed, it was already shown that the increasing of hydrogen bonding can induce the stabilization of β-sheet structure and the regulation of protein unfolding (Fitzpatrick, 2011; Calabrò, 2016; Calabrò and Magazù, 2017a).
Furthermore, the increase of hydrogen bonding can be related to a reduction of distances in proteins, because the shorter the distance the stronger the hydrogen bond. Hence, the increasing of hydrogen bonding significantly increases the packing density in proteins, inducing the reduction of the volumes occupied by the hydrogen bonded backbone groups (Schell et al., 2006; Moosavi and Gholizadeh, 2014). A reduction in volume in membrane proteins due to the increasing of hydrogen bonding after exposure to EMF should induce an enlargement of membrane channels. As a result, increasing of ion transport across cellular membrane should be induced by increasing of hydrogen bonding, changing the cellular functions in living things (Calabrò, 2016).
5.
O
RIENTATION OFP
ROTEINSα-H
ELIXS
TRUCTURE UNDERE
XPOSURE TOM
ICROWAVER
ADIATIONFTIR spectroscopy analysis was also used to study alterations in the secondary structure of HB, MB, BSA and LYS in bidistilled water solutions under exposure to MWs in the range 900-1800 MHz (i.e., the MWs range of GSM mobile phone working), focusing the attention on the orientation of the Amide I and Amide II bands.
To this aim, samples of 200 ml of HB, MB, BSA and LYS in bidistilled water solution were exposed for 3 h to HF-EMFs at 1750 MHz at the average intensity of 1 W/m2. Interactive baseline rubber-band
overlapping of water band shape in the Amide I region, as described in the section “Materials and Methods”
Representative exposed and unexposed absorption spectra in the IR region from 1700 to 1500 cm-1 of HB, MB, BSA and LYS in bidistilled
water solutions are represented in Figure 6-A,B,C,D, respectively, where the spectra of exposed samples are represented by clear line.
Figure 6. Representative exposed and unexposed spectra of HB (A), MB (B), BSA (C) and LYS (D) samples in bidistilled water solutions in the range 1700-1500 cm-1 after 3
h of exposure to 1750 MHz microwaves at the average power density of 1 W/m2 (clear
lines refer to exposed samples). Significant increasing in intensity of the Amide I vibration band (p < 0.05), indicated by arrows, was observed in each protein in bidistilled water solution after exposure to microwaves (Calabrò and Magazù, 2017c).
Two intense vibration bands can be observed in Figure 6-A,B,C,D at 1654 cm-1 and 1545 cm-1. The first band corresponds to the Amide I band,
whereas the second vibration corresponds to the Amide II mode (Surewicz et al., 1993). An increasing in intensity of the Amide I band can be observed for each protein after exposure.
Student’s T-test analysis applied to the integrated areas of exposed and unexposed samples was carried out, comparing two groups of 18 exposed
and unexposed spectra, calculating the integrated areas of Amide I and Amide II bands in the ranges 1690-1610 and 1590-1510 cm-1, respectively.
The first result is represented by a significant increasing in intensity of the Amide I mode, whereas the intensity of the Amide II band did not increase significantly. This finding can be explained considering the dipole moment of each ligand in the α-helix structure. Indeed, the C=O stretch has a large dipole moment which gives rise mainly to the Amide I and is oriented along the α-helix axis. In contrast, C−N stretching and N−H bending vibrations, that make up the Amide II band, are perpendicular to the α-helix axis (Parker, 1971; Stuart, 1997).
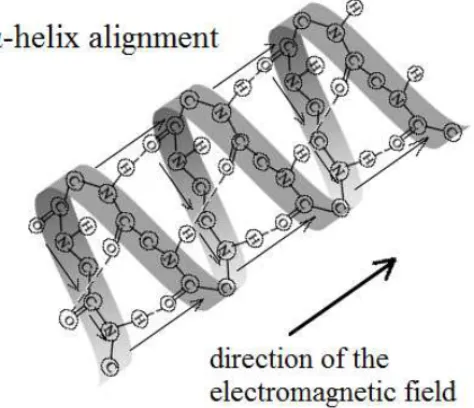
These dipoles give rise to a net dipole moment from one end of the helix to the other. As a result, the observed significant increasing in intensity of the Amide I band can be easily explained assuming that the α-helix axis aligns to the direction of the field, giving rise to the alignment of C=O stretching and N-H bending linkages. The dipole moment of this peptide unit, near-parallel to the α-helix axis, produces a large net dipole moment from one end of the helix to the other, that contributes to the total amount of dipole moment of the protein (Wada, 1976; Hol et al., 1981).
Hence, the HF-EMF produces a torque on the proteins, induced by proteins α-helices dipole moment. The α-helix of each protein represents a macrodipole which aligns itself with the direction of the applied field by a rotation. Nevertheless, the high-frequency of the EMF and the inertia of molecules cause that the dipole cannot follow the oscillation of the field, so that the α-helices will place at an average position close to the direction of the field, inducing an increase in intensity of the Amide I band due to the increasing of total amount of dipole moment. This mechanism was schematized in Figure 7.
This result is in agreement with previous studies that showed that biological particles in liquid media exposed to EMFs align themselves towards the applied EMF forming the so-called “pearl chains” (Hu and Barnes, 1975). Pearl chain formation is a phenomenon which has been largely studied up to now, represented by the experimental observation that living or non-living particles can form “pearl chains” in the direction of an
applied magnetic field (Sher, 1968; Schwan and Sher, 1969; Griffin and Ferris, 1970; Takashima and Schwan, 1985; Calabrò and Magazù, 2017b).
Figure 7. Scheme of the alignment of protein’s α-helix structure in bidistilled water solution under an applied electromagnetic field.
As proteins α-helices are present in all types of biological membranes channels (Becker et al., 2005; Villinger et al., 2010; Szabo and Zoratti, 2014), the rotation of α-helices towards the direction of an applied EMF should induce an enlargement of membrane channels and an increase of ion transport across cells channels. This effect was previously suggested in (Calabrò, 2016).
C
ONCLUSIONThe effects of EMFs in typical proteins have been studied by means of FTIR Spectroscopy. The results that were found can be summarized as follows:
Exposure of proteins in bidistilled H2O or D2O solution to low- or
transitions from the α-helix to the β-sheet structure that can be responsible for the aggregation phenomena, leading to neurotoxic and neurodegenerative disorders. Furthermore, an increasing of hydrogen bonding in typical proteins exposed to 50 Hz EMF was observed. Finally, an important effect of exposure of proteins in a bidistilled water solution to microwaves was represented by the α-helix alignment to the direction of the applied HF-EMF. In particular, this is a relevant result because the orientation of proteins that α-helices within the cell channels can produce a change in the movement of ions across cell membranes, inducing a significant alteration of the organic functions of living things.
In conclusion, the results exposed in this chapter showed that alterations in secondary protein structures are induced by exposure to EMFs, even at levels below the limits recommended by ICNIRP.
R
EFERENCESAmbrose, E. J., Elliot, A. 1951. Infrared spectroscopic studies of globular protein structure. Proc R Soc London 208, 75-90.
Bauer, R., Carrotta, R., Rischel, C., Ogendal, L. 2000. Characterization and isolation of intermediates in β-lactoglobulin heat aggregation at high pH. Biophys. J. 79:1030–1038.
Beasond, R. C., Semm, P. 2002. Responses of neurons to an amplitude modulated microwave stimulus. Neuroscience Letters 333:175-178. Becker, L., Bannwarth, M., Meisinger, C., Hill, K., Model, K., Krimmer,
T., Casadio, R., Truscott, K. N., Schulz, G. E., Pfanner, N., et al. 2005. Preprotein translocase of the outer mitochondrial membrane: Reconstituted Tom 40 forms a characteristic TOM pore. J Mol Biol 353:1011–1020.
Brzyska, M., Bacia, A., Elbaum, D. 2001. Oxidative and hydrolytic properties of beta-amyloid. Eur. J. Biochem. 268:3443–3454.
Byler, D. M., Susi, H. 1986. Examination of the secondary structure of proteins by deconvolved FTIR spectra. Biopolymer 25:469–487.
Calabrò, E., Magazù, S. 2010. Inspections of Mobile Phone Microwaves Effects on Proteins Secondary Structure by means of Fourier Transform Infrared Spectroscopy, Journal of Electromagnetic Analysis
& Applications 2(11):607-617.
Calabrò, E., Magazù, S., Campo, S. 2012. Microwave-induced increase of amide I and amide II vibration bands and modulating functions of sodium-chloride, sucrose and trehalose aqueous solutions: The case study of Haemoglobin, Res. J. Chem. Env. 16 (4):59-67.
Calabrò, E., Condello, S., Currò, M., Ferlazzo, N., Caccamo, D., Magazù, S., Ientile, R. 2013. Effects of Low Intensity Static Magnetic Field on FTIR spectra and ROS production in SH-SY5Y neuronal-like cells.
Bioelectromagnetics 34:618-629.
Calabrò, E., Magazù, S. 2013. Unfolding and Aggregation of Myoglobin can be Induced by Three Hours Exposure to Mobile Phone Microwaves: a FTIR spectroscopy study. Spectroscopy Letters: Int. J.
Rap. Comm. 46(8):583-589.
Calabrò, E., Magazù, S. 2015a. Fourier –Self –Deconvolution Analysis of β-sheet Contents in the Amide I Region of Haemoglobin Aqueous Solutions under Exposure to 900 MHz Microwaves and bioprotective effectiveness of sugars and salt solutions. Spectroscopy Letters: Int. J.
Rap. Comm. 48(10):741-747.
Calabrò, E., Magazù, S. 2015b. Transition from α-helix to β-sheet structures occurs in myoglobin in deuterium oxide solution under exposure to microwaves (PD 044), in 29th Annual Symposium of the
Protein Society, July 22-25, 2015, Barcelona, Spain.
Calabrò, E. 2016. Competition between Hydrogen Bonding and Protein Aggregation in Neuronal-Like Cells under Exposure to 50 Hz Magnetic Field. International Journal of Radiation Biology 92(7):395-403.
Calabrò, E., Magazù, S. 2016. Parallel β-sheet Vibration Band Increases with Proteins Dipole Moment under Exposure to 1765 MHz Microwaves. Bioelectromagnetics 37(2):99-107.
Calabrò, E., Magazù, S. 2017a. Response of Hydrogen Bonding to Low Intensity 50 Hz Electromagnetic Field in Typical Proteins in Bidistilled
Water Solution, Spectroscopy Letters: An International Journal for
Rapid Communication 50(6):330-335.
Calabrò, E., Magazù, S. 2017b. Induced-Orientation of Nitrogen Monoxide and Azide Ion Vibrations in Human Hemoglobin in Bidistilled Water Solution under a Static Magnetic Field. Bioelectromagnetics, published online 28 Apr 2017. DOI:10.1002/bem.22056.
Calabrò, E., Magazù, S. 2017c. The α-Helix Alignment of Proteins in Water Solution towards a High Frequency Electromagnetic Field: a FTIR Spectroscopy Study. Electromagnetic Biology and Medicine, published online 20 Jun 2017. DOI:10.1080/15368378.2017.1328691, ID: 1328691.
Chen, K., Ballas, S. K., Hantgan, R. R., Kim-Shapiro, D. B. 2004. Aggregation of Normal and Sickle Hemoglobin in High Concentration Phosphate Buffer. Biophysical Journal 87:4113–4121.
Cohenford, M. A., Rigas, B. 1998. Cytologically normal cells from neoplastic cervical samples display extensive structural abnormalities on IR spectroscopy: implications for tumor biology. Proc Natl Acad
Sci USA. 95:15327–15332.
Diem, M., Boydston-White, S., Chiriboga, L. 1999. Infrared spectroscopy of cells and tissues: shining light onto a novel subject. Appl. Spectrosc. 53:148-161.
Diem, E., Schwarz, C., Adlkofer, F., Jahn, O., Rudiger, H. 2005. Non-thermal DNA breakage by mobile-phone radiation (1800MHz) in human fibroblasts and in transformed GFSH-R17 rat granulosa cells in vitro. Mutat. Res. 583:178–183.
Dobson, C. M. 2001. The structural basis of protein folding and its links with human disease. Philos. Trans. R. Soc. Lond. B Biol. Sci. 356:133– 145.
Elliot, A., Ambrose, E. J. 1950. Structure of synthetic polypeptides. Nature 165:921-922.
Elliot, A. 1954. Infrared spectra of polypeptides with small side chains.
Proc R SOC London Ser A 226:408-421.
European Commission. 2006. Possible effects of electromagnetic fields (EMF) on human health, Scientific Committee on Emerging and
Newly Identified Health Risks on Human Health. Brussels, Belgium:
European Commission. pp 1–58.
Fitzpatrick, A. W., Knowles, T. P. J., Waudby, C. A., Vendruscolo, M., Dobson, C. M. 2011. Inversion of the balance between hydrophobic and hydrogen bonding interactions in protein folding and aggregation.
PLoS Comput Biol. 7, e1002169.
Griffin, J. L., Ferris, C. D. 1970. Pearl Chain Formation across Radio Frequency Fields. Nature 226:152-154.
Hol, W. G. J., Halie, L. M., Sander, C. 1981. Dipoles of the α-helix and β-sheet: their role in protein folding. Nature 294:532-536.
Hu, C. J., Barnes, F. S. 1975. A simplified theory of pearl chain effects.
Radiat Environ Biophys 12(1):71-76.
Huang, P.; Dong, A.; Caughey, W. S. 1995. Effects of dimethyl sulfoxide, glycerol and ethylene glycol on secondary structures of cytochrome c and lysozyme as observed by infrared spectroscopy. Journal of Pharmaceutical Sciences 84(4):387–392.
IARC. 2002. Working Group on the Evaluation of Carcinogenic Risks to Humans. Non-ionizing radiation, Part 1: Static and extremely low-frequency (ELF) electric and magnetic fields; Monographs on the
Evaluation of Carcinogenic Risks to Humans 80, Lyon.
ICNIRP. 1998. For limiting exposure to time-varying electric, magnetic, and electromagnetic fields (up to 300 GHz). Health Physics 74 (4):494-522.
ICNIRP. 2009. On limits of exposure to static magnetic fields. Health
Physics 96(4):504-514.
ICNIRP. 2010. For limiting exposure to time-varying electric and magnetic fields (1 Hz − 100 kHz). Health Physics 99(6):818-836.
Ismail, A. A., Mantch, H. H., Wong, P. T. T. 1992. Aggregation of chymotrypsinogen: portrait by infrared spectroscopy. Biochim.
Biophys. Acta 1121:183–188.
Jannelli, M. P., Magazù, S., Maisano, G., Majolino, D., Migliardo, P. 1994. Hydration phenomena and cooperative diffusion in polymer-water solutions. Phys. Scr. 50(2):215–217.
Jung, C. 2000. Insight into protein structure and protein-ligand recognition by Fourier transform infrared spectroscopy. J. Mol. Recognit. 13:325– 351.
Lefevre, T., Subirade, M. 2000. Molecular differences in the formation and structure of fine-stranded and particulate-lactoglobulin gels.
Biopolymers 54:578–586.
Magazù, S. 2000. NMR static and dynamic light and neutron scattering investigations on polymeric aqueous solutions. J. Mol. Struct. 523:47– 59.
Magazù, S., Calabrò, E., Campo, S. 2010. FTIR Spectroscopy Studies on the Bioprotective Effectiveness of Trehalose on Human Hemoglobin Aqueous Solutions under 50 Hz Electromagnetic Field Exposure. The
Journal of Physical Chemistry B 114:12144–12149.
Magazù, S., Calabrò, E. 2011. Studying the Electromagnetic-induced changes of the Secondary Structure of Bovine Serum Albumin and the Bioprotective Effectiveness of Trehalose by FTIR Spectroscopy. The
Journal of Physical Chemistry B 115(21):6818–6826.
Magazù, S., Calabrò, E., Campo, S., Interdonato, S. 2012. New Insights into Bioprotective Effectiveness of Disaccharides: a FTIR Study of Human Haemoglobin Aqueous Solutions exposed to Static Magnetic Fields. Journal of Biological Physics 38(1):61-74.
Mattson, M. P. 1994. Calcium and neuronal injury in Alzheimer’s disease: Contributions of beta-amyloid precursor protein mismetabolism, free radicals, and metabolic compromise. Ann. N. Y. Acad. Sci. 747:50–76. Milner-White, E. J. 1997. The partial charge of the nitrogen atom in
peptide bonds. Protein Sci. 6: 2477–2482.
Mikhonin, A. V., Ahmed, Z., Ianoul, A., Asher, S. A. 2004. Assignments and conformational dependencies of the amide III peptide backbone UV resonance Raman bands. J Phys Chem B 108: 19020–19028. Mikhonin, A. V., Bykov, S. V., Myshakina, N. S., Asher, S. A. 2006.
Peptide secondary structure folding reaction coordinate: correlation between UV Raman amide III frequency, Psi Ramachandran angle, and hydrogen bonding. J Phys Chem B 110:1928–1943.
Moosavi, F., Gholizadeh, M. 2014. Magnetic effects on the solvent properties investigated by molecular dynamics simulation. J. Magnet.
Magnetic. Mat. 354: 239–247.
Neale, R. E., Stiller, C. A., Bunch, K. J. et al. 2013. Familial aggregation of childhood and adult cancer in the Utah genealogy. International
Journal of Cancer 133:2953–2960.
Offen, D., Elkon, H., Melamed, E. 2000. Apoptosis as a general cell death pathway in neurodegenerative diseases. J. Neural Transm. Suppl. 58:153–166.
Pauling, L., Itano, H. A., Singer, S. J., Wells, I. C. 1949. Sickle Cell Anemia, a Molecular Disease. Science 110:543-548.
Pintado, T., Maldonado, J. E. 1976. Ultrastructure of platelet aggregation in refractory anemia and myelomonocytic leukemia. I. Ultrastructure of aggregation in normal controls and general defects in refractory anemia and myelomonocytic leukemia. Mayo Clin Proc. 51(6):379-92. Pogocki, D. 2003. Alzheimer’s β-amyloid peptide as a source of
neurotoxic free radicals: the role of structural effects. Acta Neurobiol.
Exp. (Wars.) 63:131–145.
Rigas, B., Morgello, S., Goldman, I. S., Wong, P. T. T. 1990. Human colorectal cancers display abnormal Fourier-transform IR spectra.
Proceedings of the National Academy of Sciences of the USA
87(20):8140-8144.
Salford, L. G., Brun, A. E., Eberhardt, J. L., Malmgren, L., Persson, B. R. 2003. Nerve cell damage in mammalian brain after exposure to microwaves from GSM mobile phones, Environ. Health Perspectives 111:881–883.
Schell, D., Tsai, J., Scholtz, J. M., Pace, C. N. 2006. Hydrogen bonding increases packing density in the protein interior. Proteins 63:278–282. Schwan, H. P., Sher, L. D. 1969. Alternating−current field−induced forces
and their biological implications. J Electrochem Soc 116:22C.
Sher, L. D. 1968. Dielectrophoresis in Lossy Dielectric Media. Nature 220:695-696.
Squier, T. C. 2001. Oxidative stress and protein aggregation during biological aging. Exp. Gerontol. 36:1539–1550.
Surewicz, W. K., Mantsch, H. H. 1988. New insight into protein secondary structure from resolution-enhanced infrared spectra. Biochim. Biophys. Acta 952:115–130.
Surewicz, W. K., Mantsch, H. H., Chapman, D. 1993. Determination of protein secondary structure by Fourier transform infrared spectroscopy: a critical assessment. Biochem 32:389-394.
Susi, H., Byler, D. M. 1986. Resolution-enhanced Fourier transform infrared spectroscopy of enzymes. Methods Enzymol 130:290–311. Szabo, I., Zoratti, M. 2014. Mitochondrial channels: ion fluxes and more.
Physiol Rev 94:519–608.
Takashima, S., Schwan, H. P. 1985. Alignment of Microscopic Particles in Electric Fields and its Biological Implications. Biophys J 47:513-518. Tice, R. R., Hook, G. G., Donner, M., McRee, D. I., Guy, A. W. 2002.
Genotoxicity of radiofrequency signals. Investigation of DNA damage and micronuclei induction in cultured human blood cells.
Bioelectromagnetics 23:113–126.
Tripette, J., Alexy, T., Hardy-Dessources, M. D., et al. 2009. Red blood cell aggregation, aggregate strength and oxygen transport potential of blood are abnormal in both homozygous sickle cell anemia and sickle-hemoglobin C disease. Haematologica 94:1060-1065.
Villinger, S., Briones, R., Giller, K., Zachariae, U., Lange, A., de Groot, B. L., Griesinger, C., Becker, S., Zweckstetter, M. 2010. Functional dynamics in the voltage dependent anion channel. Proc Natl Acad Sci
USA. 107:22546–22551.
Wada, A. 1976. The alpha-helix as an electric macro-dipole. Adv Biophys 9:l-63.
WHO (World Health Organization). 1984. Extremely low frequency (ELF) fields. Environmental Health Criteria; World Health Organization: Geneva, Vol. 35. ISBN 92-4-154095-8.
WHO (World Health Organization). 1987. Magnetic fields. Environmental Health Criteria; World Health Organization: Geneva, Vol. 69. ISBN 92-4-154269-1.
WHO (World Health Organization). 1993. Electromagnetic fields (300 Hz to 300 GHz). Environmental Health Criteria; World Health
Organization: Geneva, Vol.137. ISBN 92-4-157137-3.
WHO (World Health Organization). 2006. Framework for Developing Health-Based EMF Standards. World Health Organization, Geneva, Switzerland. ISBN 92-4-159433-0.