HAL Id: hal-00304121
https://hal.archives-ouvertes.fr/hal-00304121
Submitted on 21 Apr 2008HAL is a multi-disciplinary open access
archive for the deposit and dissemination of sci-entific research documents, whether they are pub-lished or not. The documents may come from teaching and research institutions in France or abroad, or from public or private research centers.
L’archive ouverte pluridisciplinaire HAL, est destinée au dépôt et à la diffusion de documents scientifiques de niveau recherche, publiés ou non, émanant des établissements d’enseignement et de recherche français ou étrangers, des laboratoires publics ou privés.
Sources of organic carbon in PM1 in Helsinki urban air
S. Saarikoski, H. Timonen, K. Saarnio, M. Aurela, L. Järvi, P. Keronen, V.-M.
Kerminen, R. Hillamo
To cite this version:
S. Saarikoski, H. Timonen, K. Saarnio, M. Aurela, L. Järvi, et al.. Sources of organic carbon in PM1 in Helsinki urban air. Atmospheric Chemistry and Physics Discussions, European Geosciences Union, 2008, 8 (2), pp.7805-7846. �hal-00304121�
ACPD
8, 7805–7846, 2008 Sources of organic carbon in Helsinki, Finland S. Saarikoski et al. Title Page Abstract Introduction Conclusions References Tables Figures ◭ ◮ ◭ ◮ Back CloseFull Screen / Esc
Printer-friendly Version Interactive Discussion Atmos. Chem. Phys. Discuss., 8, 7805–7846, 2008
www.atmos-chem-phys-discuss.net/8/7805/2008/ © Author(s) 2008. This work is distributed under the Creative Commons Attribution 3.0 License.
Atmospheric Chemistry and Physics Discussions
Sources of organic carbon in PM
1
in
Helsinki urban air
S. Saarikoski1, H. Timonen1, K. Saarnio1, M. Aurela1, L. J ¨arvi2, P. Keronen2, V.-M. Kerminen1, and R. Hillamo1
1
Finnish Meteorological Institute, Air Quality, P.O. Box 503, 00101 Helsinki, Finland
2
University of Helsinki, Department of Physics, P.O. Box 64, 00014 Helsinki, Finland Received: 11 January 2008 – Accepted: 25 February 2008 – Published: 21 April 2008 Correspondence to: S. Saarikoski ([email protected])
ACPD
8, 7805–7846, 2008 Sources of organic carbon in Helsinki, Finland S. Saarikoski et al. Title Page Abstract Introduction Conclusions References Tables Figures ◭ ◮ ◭ ◮ Back CloseFull Screen / Esc
Printer-friendly Version Interactive Discussion
Abstract
A major fraction of fine particle matter consists of organic carbon (OC) but its origin is still inadequately known. In this study the sources of OC were investigated in the northern European urban environment in Helsinki, Finland. Measurements were car-ried out over one year and they included both filter (PM1) and online methods. From
5
the filter samples OC, elemental carbon (EC), water-soluble OC (WSOC), levoglucosan and major ions were analyzed. Filter data together with the concentrations of inorganic gases were analyzed by Positive matrix factorization (PMF) method in order to find the sources of OC (and WSOC) on an annual as well as on a seasonal basis. In order to study the diurnal variation of sources, OC and EC were measured by a
semicontinu-10
ous OC/EC analyzer and major ions were determined by a Particle-into-Liquid Sampler coupled to ion chromatographs. According to PMF, OC concentrations were impacted by four sources: biomass combustion, traffic, long-range transport and secondary pro-duction. On an annual basis the OC concentration was dominated by secondary or-ganic aerosol (SOA). Its contribution to OC was as high as 64% in summer, which may
15
result besides anthropogenic sources also from the large biogenic VOC emissions in the boreal region. In winter biomass combustion constituted the largest fraction in OC due to domestic wood combustion for heating purposes. Traffic contributed to OC from 15 to 27%. Regarding the diurnal variation, the contribution of traffic was higher from 08:00 to 18:00 on weekdays than on weekends. The contribution of long-range
20
transport to OC was 24% on average. All four sources influenced also on the WSOC concentrations, however, the contribution of SOA was significantly larger to WSOC than to OC.
1 Introduction
Urban aerosol is a complex mixture of primary particulate emissions from industry,
25
ac-ACPD
8, 7805–7846, 2008 Sources of organic carbon in Helsinki, Finland S. Saarikoski et al. Title Page Abstract Introduction Conclusions References Tables Figures ◭ ◮ ◭ ◮ Back CloseFull Screen / Esc
Printer-friendly Version Interactive Discussion tion, sea spray), and of secondary material formed by gas-to-particle conversion
mech-anisms. A substantial fraction (20–80%) of the atmospheric fine particulate matter (PM) in an urban environment consists of carbonaceous material (Rogge et al., 1993; Nunes and Pio, 1993; Sillanp ¨a ¨a et al., 2005), but still it is one of the least understood compo-nents of aerosols. Carbonaceous material is usually divided in two fractions, elemental
5
carbon (EC, sometimes referred to as black carbon or graphitic carbon) and organic carbon (OC). EC is a primary pollutant formed in combustion processes whereas OC is a complex mixture of many groups of compounds originating from primary sources and secondary formation processes (Seinfeld and Pandis, 1998).
Major anthropogenic emission sources are biomass and fossil fuel combustion.
An-10
thropogenic biomass combustion includes both the agricultural combustion such as burning of biomass for land clearing or new kinds of land use, and the combustion for heat production, e.g. in domestic boilers, wood stoves and fireplaces. The adverse impact of domestic biomass combustion on local ambient air quality is pronounced, be-cause such emissions are mostly unregulated, and the combustion in domestic
heat-15
ing appliances is incomplete (Fine et al., 2002; Glasius et al., 2006). Moreover, the release height of the emissions is typically low, and emissions are highest during the winter when the air mixing can be poor, which both amplify the local air quality impact and increase the risk of adverse health effects in populated areas (Lighty et al., 2000; Naeher et al., 2007). It has been shown that in northern Europe wood combustion
20
can result in local PM2.5 levels comparable to heavily trafficked streets (Glasius et al., 2006). Even though the health effects of traffic related particles have been found to be severe (Kunzli et al., 2000; Solomon and Balmes, 2003) there is no reason to assume that health effects of wood combustion are smaller than the health effects of other types of ambient particles on the mass basis (Boman et al., 2003).
25
In addition to being emitted from motor vehicles and biomass combustion, a large fraction of organic aerosol is formed in the atmosphere from low-volatility compounds produced by the oxidation of gas-phase anthropogenic and biogenic precursors. This secondary organic aerosol (SOA) has been found to contribute to OC from 80% in
ACPD
8, 7805–7846, 2008 Sources of organic carbon in Helsinki, Finland S. Saarikoski et al. Title Page Abstract Introduction Conclusions References Tables Figures ◭ ◮ ◭ ◮ Back CloseFull Screen / Esc
Printer-friendly Version Interactive Discussion summer in Japan (Kondo et al., 2007) to near zero in Pittsburgh, Pennsylvania in winter
(Cabada et al., 2002). Recently, it has been stated that there may be a consistent background for SOA in the regional air mass but also in case of primary OC 70% is found to originate from regional transport instead of local sources (Subramanian et al., 2007).
5
Concerning the sources of OC, the Helsinki Metropolitan Area is quite special. It is a northern European urban environment located in boreal region. According to studies (Lindfors et al., 2000) biogenic volatile organic carbon (VOC) emissions, and accord-ingly biogenic secondary organic aerosol concentrations are outstandaccord-ingly large in a boreal region (Tunved et al., 2006). Additionally, long-range transport (LRT) has a
sig-10
nificant impact on the PM levels in Helsinki, since the mass concentrations due to fine particles from local or regional sources are typically low compared with, e.g., those in Central Europe (Sillanp ¨a ¨a et al., 2005). On average 50–75% of PM2.5 in Finland has been estimated to be long-range transported (Pakkanen et al., 2001; Karppinen et al., 2004) but in case of OC the influence of LRT is still uncertain. However, it has been
15
shown that during the episodes of long-range transported wild fire emission plumes, the OC concentration increased considerably (Saarikoski et al., 2007).
The aim of this study was to investigate the sources of organic carbon in fine par-ticulate matter in Helsinki, Finland. In a previous study conducted in Helsinki the con-centration of OC in fine (PM2.5) and coarse (PM2.5−10) particles has been explored on
20
annual basis (Viidanoja et al., 2002). In addition, the sources of OC in Helsinki, to-gether with five other European cities, have been discussed qualitatively by Sillanp ¨a ¨a et al. (2005). However, latter results were limited to a single six-week measurement campaign conducted in Helsinki in springtime. In this study three different approaches were applied in order to investigate the origin of OC. This study together with the
pa-25
per of the size distributions of water-soluble organic carbon (Timonen et al., 2008) completes significantly the knowledge available until now of the sources and seasonal behaviour of organic aerosol in northern European urban areas.
ACPD
8, 7805–7846, 2008 Sources of organic carbon in Helsinki, Finland S. Saarikoski et al. Title Page Abstract Introduction Conclusions References Tables Figures ◭ ◮ ◭ ◮ Back CloseFull Screen / Esc
Printer-friendly Version Interactive Discussion
2 Experimental
2.1 Measurement site
The measurement site of this study was the urban background station SMEAR III (60◦20′N, 24◦97′E, 26 m above sea level) that belongs to the SMEAR network (http://www.atm.helsinki.fi/SMEAR/). The site is situated in the heart of the Helsinki
5
Metropolitan Area, a fairly flat coastal area of the Baltic Sea in Southern Finland. In the city of Helsinki there are 0.5 million inhabitants while the population of the whole area is approximately 1.0 million. The station is located in the campus area of the University of Helsinki at a distance of about 5 km northeast from the downtown of Helsinki. It is surrounded by the university buildings in the northeastern side, and by mainly forested
10
area, with some buildings in the west. At a distance of less than 200 m to the east, there is a densely trafficked major road (60 000 cars/day). The area between this road and the measurement site is forested.
2.2 PM1filter sampling and analysis
2.2.1 Sampling system
15
Ambient particulate matter samples were collected using two quartz fiber filters (What-man Q-MA 47 mm) placed in series in a filter cassette system (Gel(What-man Sciences). In order to collect the submicrometer particle size fraction of PM only (aerodynamic par-ticle diameter <1 µm, PM1), the four upper stages (8–11) of the Berner low pressure impactor (BLPI; Berner and L ¨urzer, 1980) were installed prior to the filter to remove
20
supermicrometer particles. The cut-size of the preimpactor (D50) is determined by the lowest stage, the others are used to divide the PM loading to several stages and to ensure removal of particles well above the lowest cut-size. The nominal D50 value for stage 8 is 2 µm with a flow rate of 24.5 L min−1, but since the flow rate of the BLPI was increased to 80 L min−1, the D
50 value for the stage 8 decreased to 1 µm. Calculation
ACPD
8, 7805–7846, 2008 Sources of organic carbon in Helsinki, Finland S. Saarikoski et al. Title Page Abstract Introduction Conclusions References Tables Figures ◭ ◮ ◭ ◮ Back CloseFull Screen / Esc
Printer-friendly Version Interactive Discussion was based on the theory presented by Rader and Marple (1985) assuming that the flow
is incompressible and the Stokes number is 0.24. PM1 filter samples were collected from the beginning of March 2006 to the end of February 2007. The sampling duration was 24 h on working days and 72 h over weekends. The measurement height was 5 m from the ground surface.
5
2.2.2 Chemical analyses
Pieces with an area of 1 cm2were punched from the PM1quartz filters and analyzed for OC, EC, WSOC, levoglucosan and water-soluble ions. Detailed descriptions of the an-alytical methods have been given by Saarikoski et al. (2007) and Timonen et al. (2008). Shortly, OC and EC were determined with a thermal-optical carbon analyzer (Sunset
10
Laboratory Inc., Portland, OR; Birch and Cary, 1996). The temperature program had four steps with the temperatures of 310 (90 s), 475 (90 s), 615 (90 s) and 800◦C (90 s). In the helium-oxygen phase (2% oxygen) there were six temperature steps: 550 (45 s), 625 (45 s), 700 (45 s), 775 (45 s), 850 (45 s) and 890◦C (120 s).
WSOC was analyzed using a Total Carbon Analyzer equipped with a high-sensitive
15
catalyst (TOC-VCPH, Shimadzu). Samples were extracted by shaking the filter piece with 15 mL of deionized water (Milli-Q, Gradient, Millipore) for 15 min. The method used was the Non-Purgeable Organic Carbon method, which measured non-volatile OC present in the sample. By acidifying the sample with 1% acid, inorganic car-bon (carcar-bonates, hydrogen carcar-bonates and dissolved carcar-bon dioxide) was eliminated.
20
Water-insoluble organic carbon (WINSOC) was calculated by subtracting the amount of WSOC from that of OC.
Levoglucosan was analyzed with a liquid-chromatograph coupled with an ion trap mass spectrometer (LC-MS; Agilent Technologies, SL). Samples were extracted by using a 2 mL mixture of tetrahydrofuran and water (1:1) in an ultrasonic bath for 30 min.
25
The LC-MS method was similar to that presented by Dye and Yttri (2005).
Ions were analyzed from the PM1 filter samples using Dionex DX500 or ICS-3000 ion chromatographs (ICs). Prior to analysis samples were extracted with 5 ml of Milli-Q
ACPD
8, 7805–7846, 2008 Sources of organic carbon in Helsinki, Finland S. Saarikoski et al. Title Page Abstract Introduction Conclusions References Tables Figures ◭ ◮ ◭ ◮ Back CloseFull Screen / Esc
Printer-friendly Version Interactive Discussion water, shaken for 10 min and filtered with IC Acrodisc syringe filters (0.45 µm, PALL
Gelman Laboratory). DX500 had AG11/CG12A guard columns, AS11/CS12A analyt-ical columns, 500 µl/300 µl loops, ASRS/CSRS ultra II suppressors and NaOH/MSA eluent for anions and cations, respectively. The ICS-3000 setup was similar except to anion column (AS17) and the anion eluent (KOH). Nitrate, sulfate, oxalate, ammonium
5
and potassium were obtained from the PM1samples, whereas other ions usually an-alyzed by the IC (methanesulfonate, chloride, sodium, magnesium and calcium) could not be determined, either because of the high blanks in quartz filters or because the concentrations were below their detection limits.
Concentrations measured for the back-up filters were subtracted from those of the
10
front filters by assuming that they were only adsorbed gas-phase components of the sample air (positive artifacts) and the adsorption was equal in the front and back-up filters. The results of nitrate are not presented, because the average nitrate concen-tration on the back-up filter was 45% of that on the front filter, indicating significant evaporation of nitrate from the front filter. For EC, levoglucosan, oxalate, potassium,
15
sulfate and ammonium the concentration on the back-up filter was in the range of 0– 4% of the concentration on the front filter, on average, whereas the corresponding percentages were 12% and 28% for OC and WSOC, respectively.
2.3 Online measurements
2.3.1 Semicontinuous OC/EC analyzer
20
Organic and elemental carbon concentrations were measured using the semi-continuous OC/EC Carbon Aerosol Analyzer (Sunset Laboratory Inc., Portland, OR). Three-hour measurement periods were used to ensure that the concentrations are well above the detection limit also during low concentration events. Measurements started every day at 00:00, 03:17, 06:00, 09:00, 12:00, 15:00, 18:00 and 21:00 local time.
25
The instrument collected particles for 164 min (147 min for the measurement started at 03:17) after which the sample was analyzed with the thermal-optical method. At
ACPD
8, 7805–7846, 2008 Sources of organic carbon in Helsinki, Finland S. Saarikoski et al. Title Page Abstract Introduction Conclusions References Tables Figures ◭ ◮ ◭ ◮ Back CloseFull Screen / Esc
Printer-friendly Version Interactive Discussion 03:00 a two-minute blank sample (instrumental blank) was collected and analyzed.
The measurement period for semicontinuous OC/EC analyzer covered one year, from September 2006 to August 2007.
Similar to the OC/EC analyzer intended to be used in the laboratory (Birch and Cary, 1996), the thermal method of semicontinuous OC/EC consisted of a helium phase in
5
which OC was determined, and a helium-oxygen phase (2% oxygen) in which EC was determined. The helium phase had two temperature steps: 600◦C (80 s) and 840◦C (90 s), and the helium-oxygen phase had three steps: 550◦C (30 s), 650◦C (45 s) and 850◦C (90 s). Charring of OC was corrected using the data obtained from the tuned diode laser (red 660 nm), which enabled the separation of pyrolyzed OC from EC. The
10
detector in the semicontinuous OC/EC was a non-dispersive infrared detector.
In addition to thermally determined OC and EC described above, the semicontinuous OC/EC instrument measured optical EC with the laser light transmission (660 nm). The time resolution for optical EC was three minutes, but the instrument calculated also an average for the selected sampling time. By subtracting optical EC from total
15
carbon (TC; thermal OC + thermal EC) the concentration of so called “optical OC” was obtained. Since the concentrations were low most of the time in Helsinki during this study, the measurements of TC and optical EC were estimated to be more reliable than those of thermal EC and thermal OC. Therefore only the results of optical EC and “optical-OC” are presented in this paper.
20
A parallel plate carbon filter denuder (Sunset Laboratory Inc., Portland, OR) was used to remove organic gaseous components from the sample air. The efficiency of the denuder was tested by adding a polytetrafluoroethylene (PTFE) filter to the sam-pling line prior to the denuder and measuring OC and EC concentrations for 24 h using a similar procedure to the non-blank measurements. A value of 0.52±0.10 µgC m−3
25
was measured for the denuder break-through. Since the instrumental blank (3 min sample at 03:00) was equal to 0.36±0.12 µgC sample−1, which corresponds to 0.24±0.079 µgC m−3 for three-hour sample, a value of 0.76 µgC m−3 was subtracted from the TC results. That value was 31±17% of the measured TC, on average.
ACPD
8, 7805–7846, 2008 Sources of organic carbon in Helsinki, Finland S. Saarikoski et al. Title Page Abstract Introduction Conclusions References Tables Figures ◭ ◮ ◭ ◮ Back CloseFull Screen / Esc
Printer-friendly Version Interactive Discussion The sample flow rate of the semicontinuous OC/EC instrument was originally
5 L min−1, but it was raised to 9.2 L min−1 in order to increase the sensitivity of the measurements. Also the original cyclone (cut-off at 2.5 µm) was changed to a cyclone with a cut-off at 1 µm in order to allow the comparison with the other instruments. The performance of semicontinuous OC/EC analyzer and especially the sampling artifacts
5
have been studied in detail by Arhami et al. (2006). 2.3.2 PILS-IC
The ionic composition of fine particles was measured using the Particle-into-Liquid Sampler (PILS; Metrohm Peak Inc; Orsini et al., 2003) coupled with two ion chro-matographs. Prior to the PILS and ICs, a virtual impactor (VI; Loo and Cork, 1988) was
10
used to select an appropriate particle size range. The major flow of the VI (15 l min−1) with the fine fraction of aerosols was fed into the PILS system. A VI with a cut-off size of 1.3 µm was used. Annular denuders (URG-2000, 30×242 mm, Chapel Hill, NC) in a series upstream of the PILS were used to remove acidic gases and ammonia from the sample air. Two denuders were coated with a KOH (1%) solution and one denuder was
15
coated with a H3PO4(3%) solution. The samples were analyzed simultaneously using two Dionex ICS-2000 ion chromatographs (Dionex, Sunnyvale, USA). Time resolution of the PILS-IC system was 15 min. The PILS-IC system is described more detailed in Kuokka et al. (2007).
2.4 Gas-phase components and meteorology
20
Ozone (O3) was measured using TEI 49 analyser (Thermo Environmental, Franklin, MA, USA), nitrogen oxides (NOx) using TEI 42S analyzer (Thermo Environmental, Franklin, MA, USA) with molybdenum thermal converter and nitrogen monoxide (NO) using TEI 42S analyzer. Carbon monoxide (CO) was measured using Horiba APMA 370 analyser (Horiba, Kyoto, Japan), but it operated at SMEAR III only in 2007. Time
25
calcu-ACPD
8, 7805–7846, 2008 Sources of organic carbon in Helsinki, Finland S. Saarikoski et al. Title Page Abstract Introduction Conclusions References Tables Figures ◭ ◮ ◭ ◮ Back CloseFull Screen / Esc
Printer-friendly Version Interactive Discussion lated by subtracting the NO concentration from that of NOx. Local meteorological
pa-rameters were obtained from the automatic weather station (Vaisala Milos 500, Vaisala Oyj, Vantaa, Finland) that operated next to the measurement site.
2.5 Data analysis
In order to study the sources of organic carbon, a Positive matrix factorization (PMF)
5
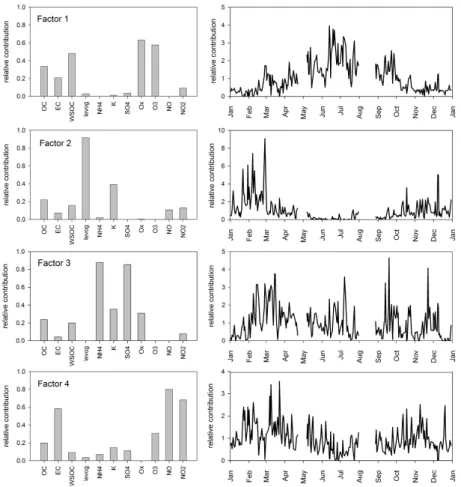
method was used. PMF is a least-squares-based factor analysis model that has been used in various studies to identify the sources of particles (e.g., Song et al., 2006; Huang et al., 2006). The PMF method has been described in detail by Paatero (1997, 1999). The episodic samples (two major biomass burning episodes) were excluded from the data set after which the data consisted of 230 samples and 11 variables.
10
PMF was run with the factor numbers of 3–6 giving the best fit for four factors. The factor solution explained 88–100% of the variation of each component, with the lowest percentage obtained for ozone. The uncertainties used for the PMF analysis were in range 5–15%, the lowest percentage being estimated for sulfate and the largest for WSOC and levoglucosan.
15
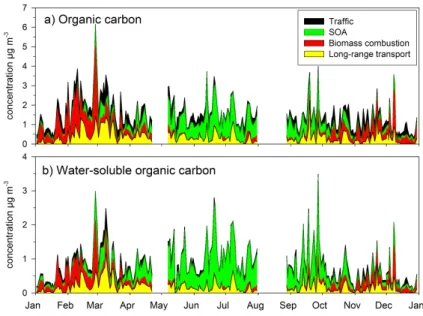
For OC and WSOC the concentrations associated with each source (factor) were calculated by multiplying the concentration of OC by the relative contribution of each source (0–1) and by the fraction of OC (0–1) attributed to each source.
3 Results and discussion
3.1 PM1filter measurements
20
3.1.1 Annual concentrations
The PM1 filter measurements were carried out from March 2006 to February 2007. During that time there were two major episodes of biomass burning smokes. The first episode in April–May 2006 was long-range transported and during that episode the
ACPD
8, 7805–7846, 2008 Sources of organic carbon in Helsinki, Finland S. Saarikoski et al. Title Page Abstract Introduction Conclusions References Tables Figures ◭ ◮ ◭ ◮ Back CloseFull Screen / Esc
Printer-friendly Version Interactive Discussion concentrations were continuously elevated over 12 days (Saarikoski et al., 2007). The
second episode in August 2006 was a series of short-term concentration peaks of which most originated from forest fires that were in Russia only 150–200 km from the measurement site.
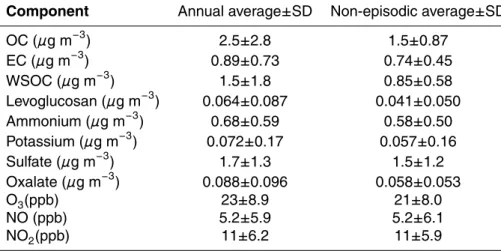
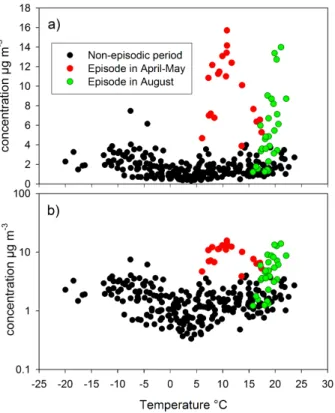
The annual-average concentration of OC was equal to 2.5 µg m−3(Table 1). As it can
5
be seen from Fig. 1, the OC concentration elevated significantly during the biomass burning episodes, which raised the annual-average. By excluding the biomass burning episodes, the average OC concentration became equal to 1.5 µg m−3. It was clearly lower than the annual-average OC measured by Viidanoja et al. (2002) between July 2000 and July 2001 in Helsinki (3.0 µg m−3), but also the average for EC was higher
10
in their study (1.2 µg m−3) than in this paper (Table 1). In addition to the apparent year-to-year variation, the difference was probably caused by the different location of the measurement sites. Viidanoja et al. (2002) measured very close to a road (14 m), whereas in this study the site was not directly influenced by the traffic. Additionally, the site used in this study was located on top of a small hill, which enabled higher wind
15
speeds and therefore more efficient dilution of local emissions. Also the measured size fractions were slightly different. In the work of Viidanoja et al. (2002) the collected size fraction was PM2.5and in this work it was PM1.
The annual-average contribution of WSOC to OC was 56%. By taking into account the large variability of this contribution during the year, the split between WSOC and
20
WINSOC during the biomass burning episodes was not different from that during other times of the year (Fig. 1). Of water-soluble ions the largest concentration was mea-sured for sulfate with no clear difference between the annual and non-episodic aver-age concentrations (Table 1). Also for ammonium the non-episodic averaver-age was only slightly smaller than the annual average including the episodes.
25
3.1.2 Seasonal variation
OC concentrations had a slight dependence on ambient temperature. The OC con-centration decreased with the increasing temperature up to about 4◦C, whereas above
ACPD
8, 7805–7846, 2008 Sources of organic carbon in Helsinki, Finland S. Saarikoski et al. Title Page Abstract Introduction Conclusions References Tables Figures ◭ ◮ ◭ ◮ Back CloseFull Screen / Esc
Printer-friendly Version Interactive Discussion 4◦C the OC concentration increased with the increasing temperature (Fig. 2). Since
the biomass burning (wildfire) episodes clearly deviated from the seasonal trend, they are shown separately. The WSOC concentration showed a pattern similar to that of OC when plotted against the ambient temperature, which is expected since WSOC correlated strongly with OC (Pearson correlation coefficient, R, 0.84). However, there
5
seems to be a seasonal trend for the fraction of WSOC in OC, since the WSOC/OC ra-tio dropped in the beginning of October 2006 and stayed at a lower level until the end of the measurement period (Fig. 1). The decrease in fall agrees with the previous studies conducted in Europe (Decesari et al., 2001; Jaffrezo et al., 2005; Viana et al., 2007), in which a slightly larger WSOC fraction has been measured in summer than in winter.
10
The seasonal variation of WSOC fraction indicates that the sources, or source contri-butions, are different for WSOC and OC. Some evidences for this will be presented in Sect. 3.1.3. The temperature is a good parameter for examining the seasonal cycles of PM in Finland where there are four clear seasons with different temperature profiles. Nevertheless, the temperature is not independent of other variables such as the global
15
radiation.
The temperature dependence of OC (and WSOC) can be explained by two major sources that depend on the season. First, by using levoglucosan, which is a tracer for biomass combustion (Simoneit et al., 1999), it is possible to track wood combustion in the residential heating. The annual-average levoglucosan concentration was 0.064 µg
20
m−3 (Table 1) with a large temporal variability and clearly higher concentrations mea-sured in winter than in summer. The same trend was found when the carbon content of levoglucosan was compared to OC (Fig. 3a). The fraction was quite stable at tem-peratures below 5◦C but decreased steeply with increasing temperature above 5◦C. This indicates that the domestic wood combustion is a significant source of OC at low
25
temperatures (in winter), but it may also imply that levoglucosan is not stable in the atmosphere in summer. This topic will be discussed in more detail in Sect. 3.1.4.
Oxalate has several sources, including engine exhaust emissions, fuel oil combus-tion, biomass burning and biogenic sources (Chebbi and Carlier, 1996). Most of these
ACPD
8, 7805–7846, 2008 Sources of organic carbon in Helsinki, Finland S. Saarikoski et al. Title Page Abstract Introduction Conclusions References Tables Figures ◭ ◮ ◭ ◮ Back CloseFull Screen / Esc
Printer-friendly Version Interactive Discussion sources are secondary. The fraction of oxalate in OC is plotted against temperature in
Fig. 3b. The observed pattern for oxalate was opposite to for levoglucosan, showing an increasing fraction with the increasing ambient temperature. However, for temper-atures below 0◦C the fraction of oxalate in OC was steady. This finding agrees with the observation made in the French Alps (Jaffrezo et al., 2005), in which the fraction
5
of dicarboxylic acids in WSOC increased with increasing temperature. However, the threshold temperature was different between the two sites in the Alps (7 and 4◦C) and this study (approx. 0◦C). Jaffrezo et al. (2005) suggested that there are two regimes for the formation of WSOC: at warmer temperatures the formation is related closely to oxidation processes producing dicarboxylic acids, whereas at lower temperatures
10
the formation of WSOC is more loosely dependent upon the formation of dicarboxylic acids.
3.1.3 Sources of OC by PMF
In addition to studying the sources of OC by means of seasonal variation, they were investigated by using the PMF method. PMF yielded four factors (Fig. 4), of which two
15
were similar to those found in the previous section. The first factor had a large con-tribution from oxalate (63%) and ozone (58%), suggesting that this factor represents secondary organic aerosol. The second factor was identified as biomass combustion because nearly all levoglucosan (92%) was loaded into this factor. Also a large fraction (39%) of potassium, another tracer for biomass combustion, was associated with the
20
second factor, whereas almost an equal contribution (35%) of potassium was loaded into the third factor. Due to high loadings of sulfate (88%) and ammonium (85%) the third factor was identified as long-range transport. The large contribution of potassium associated with this factor suggests that in addition to secondary inorganic ions, the LRT aerosol was also composed of biomass combustion emissions. The fourth factor
25
was influenced by traffic-related components EC, NO and NO2 with the percentages equal to 58, 80, 68%, respectively, associated with this factor. Biomass combustion and traffic can be assumed to be primary sources for OC, whereas LRT was a mixture of
ACPD
8, 7805–7846, 2008 Sources of organic carbon in Helsinki, Finland S. Saarikoski et al. Title Page Abstract Introduction Conclusions References Tables Figures ◭ ◮ ◭ ◮ Back CloseFull Screen / Esc
Printer-friendly Version Interactive Discussion components originating from primary and secondary sources. Other primary sources
of OC, like cooking emissions, coke production, vegetative detritus and cigarette smoke (Subramanian et al., 2007), could not be extracted from the data because the molec-ular markers for those sources were not analyzed. However, the contribution of those sources can be assumed to be small in Helsinki.
5
The seasonal variation of the four resolved factors is shown in Fig. 4 (right panel). Prior to PMF the biomass burning episodes were removed from the data set, since the source profiles during the episodes are likely to be different from those during the non-episodic period, and since the focus of this study was on the sources generally influencing Helsinki. That resulted in two gaps in time-series, one in April-May and the
10
second in August.
On an annual-basis OC was associated mostly with secondary organic aerosol (34%), whereas the rest of OC was distributed equally among the three other factors. Regarding water-soluble OC even a larger fraction was attributed to secondary organic aerosol (48%). That agrees with the earlier results obtained in Tokyo, in which most
15
of WSOC was found to originate from secondary organic aerosol formation (Kondo et al., 2007). The impact of LRT and biomass combustion was slightly smaller on WSOC than on OC, whereas the influence of traffic was significantly larger on OC than on WSOC. Although vehicle emissions are found to be linked to WSOC (Sullivan et al., 2006) the contribution of traffic to WSOC was only 9.5%.
20
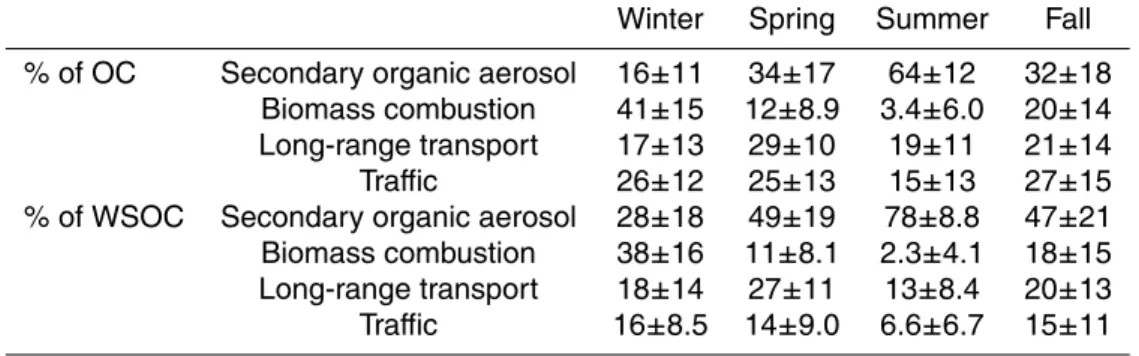
The OC concentrations attributed to four sources are presented in Fig. 5a. As ex-pected, in winter months most of OC was associated with biomass combustion (41%, Table 2). Although there were day-to-day variations in the concentration of OC in win-ter, the contribution of biomass combustion was quite stable, indicating continuous biomass combustion for residential heating in winter in Helsinki. The contribution of
25
biomass combustion in Helsinki was close to that measured in Zurich, Switzerland, (41%; Szidat et al., 2006) and that observed in Ghent, Belgium, (35%; Zdrahal et al., 2002) in winter. In Zurich and Ghent, however, the studied size fraction was PM10. In Pittsburgh, Pennsylvania, the impact of biomass combustion on OC (PM2.5) was
ACPD
8, 7805–7846, 2008 Sources of organic carbon in Helsinki, Finland S. Saarikoski et al. Title Page Abstract Introduction Conclusions References Tables Figures ◭ ◮ ◭ ◮ Back CloseFull Screen / Esc
Printer-friendly Version Interactive Discussion significantly smaller, only 10% in winter (Robinson et al., 2006b).
A significant seasonal variation was also found for the contribution of secondary organic aerosol. The contribution of SOA to OC increased from spring to summer and decreased from summer to fall and winter (Fig. 5a). Excluding winter, SOA was a major fraction of OC with the seasonal-average contribution ranging from 32% in fall to 64%
5
in summer (Table 2). The contribution of SOA was lower in Helsinki in summer than that measured in Tokyo, Japan, where 81% of organic aerosol was found to be from SOA in summer (Kondo et al., 2007), but much higher than that measured in Pittsburgh where the 38% of OC was calculated to be SOA in summer (Polidori et al., 2006). In Zurich, 60% of OC (PM10) in summer and 27% in winter were attributed to biogenic
10
emissions, of which the majority was stated to be SOA (Szidat et al., 2006).
The contribution of traffic to OC varied notably from day to day, but the seasonal-average contributions were quite stable ranging from 25 to 27% (Table 2), except in summer. In summer the traffic-related OC was only 15% (Table 2) probably because of low traffic volume during summer holidays. The contribution of traffic to OC was slightly
15
larger in Helsinki than in Toronto, Canada, where 10–20% of OC was due to primary particulate OC emissions from motor vehicles with the lack of seasonal pattern (Brook et al., 2007). In Pittsburg vehicular contribution to OC was found to be between 13 and 20% in winter (Subramanian et al., 2006).
The contribution of long-range transport to OC was highest in spring (29%) and
20
somewhat lower (∼20%) during the other seasons (Table 2). However, in addition to spring also in summer and in fall most of the OC concentration peaks were due to the high contribution of LRT (Fig. 5a). In winter all high OC concentrations were caused by the large contribution of biomass combustion.
Regarding the source contributions of WSOC, the seasonal variation was similar to
25
that found for OC, except that the fraction of SOA was more pronounced throughout the year (Fig. 5b). The seasonal variation of SOA explains the drop in the WSOC/OC ratio observed in October 2006 (Fig. 1). Since most of WSOC is attributed to SOA, the decrease in SOA formation in October lowered the WSOC concentrations. For
ACPD
8, 7805–7846, 2008 Sources of organic carbon in Helsinki, Finland S. Saarikoski et al. Title Page Abstract Introduction Conclusions References Tables Figures ◭ ◮ ◭ ◮ Back CloseFull Screen / Esc
Printer-friendly Version Interactive Discussion OC concentration there was no significant change in October because the contribution
of biomass combustion OC increases concurrently with the decreasing contribution of SOA (Fig. 5a). The influence of biomass combustion was smaller on WSOC than on OC. However, in Shenzhen (China) biomass burning has been found to be the major source of WSOC both in winter and summer (Huang et al., 2006), the contributions
5
(76% in winter and 58% in summer) being much higher than those measured in Helsinki in this study (Table 2).
3.1.4 Characterization of sources
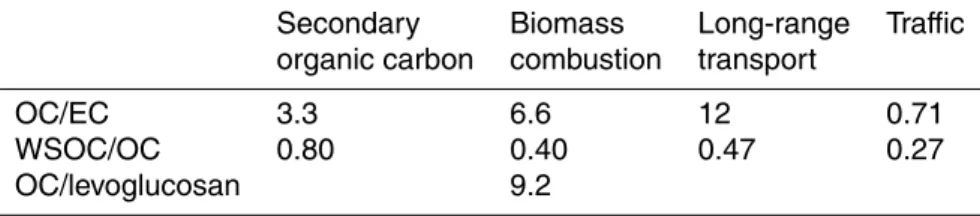
The OC/EC and WSOC/OC ratios calculated for the four sources are shown in Table 3. Of these sources, the OC/EC ratio was smallest for traffic. For traffic the ratio obtained
10
in this study (0.71) was smaller than those given for light duty gasoline vehicles (2.2) and for heavy-duty diesel vehicles (0.8) by Na et al. (2004). The fraction of WSOC in OC was only 27% for traffic but it is still twice the percentage measured close to high traffic road in Paris, France (12.5%, Ruellan and Cachier, 2001).
Traffic seemed to be a source of SOA as well, indicated by relatively small OC/EC
15
ratio obtained for SOA (Table 3). In addition to traffic also biogenic production is sup-posed to be a major source for SOA because in the boreal region biogenic secondary organic aerosol concentrations are high (Tunved et al., 2006). Although the measure-ments discussed in this paper were made in an urban background area, biogenic SOA is likely to be important because it has been suggested that there is a consistent
back-20
ground for SOA in the regional air (Subramanian et al., 2007), and that anthropogenic species play a role in SOA formation from biogenic VOCs (Weber et al., 2007). Also for the urban environment of Zurich, it has been estimated that biogenic SOA exceeds an-thropogenic SOA in summer (Szidat et al., 2006). The contribution of biogenic SOA is not limited to summertime, since in Zurich biogenic emissions were found to be
signifi-25
cant source of OC even in winter. However, in Helsinki the biogenic VOC emissions can be assumed to be smaller than in Zurich in winter since the growing season is much shorter in Helsinki than in Zurich. Nearly all (80%) secondary organic aerosol was
ACPD
8, 7805–7846, 2008 Sources of organic carbon in Helsinki, Finland S. Saarikoski et al. Title Page Abstract Introduction Conclusions References Tables Figures ◭ ◮ ◭ ◮ Back CloseFull Screen / Esc
Printer-friendly Version Interactive Discussion water-soluble, which is in line with the statement that WSOC is the major constituent
of secondary organic aerosol (Saxena and Hildemann, 1996).
The largest OC/EC ratio (12, Table 3) was obtained for the long-range transport. It is clearly larger than the corresponding ratio measured in Amsterdam, Barcelona and Ghent (4.4–8.9) during the periods when aerosols were of regional or long-range
5
continental origin (Viana et al., 2007). The WSOC/OC ratio was 0.47 for LRT, which was lower than expected since transport allows for more photochemical processing of aerosol leading to more oxidized and therefore more water-soluble OC. However, the WSOC/OC ratio was larger for LRT than for the fresh emission sources, traffic (0.27) and biomass combustion (0.40). The WSOC/OC ratio for LRT was also larger than
10
that measured by Viana et al. (2007) in Amsterdam (0.34) and Barcelona (0.36) when aerosols had regional or long-range continental European origin.
For biomass combustion the OC/EC ratio was equal to 6.6. This ratio is higher than that obtained by Frey et al. (2006) for smoldering (2.4) and normal combustion (0.93) in laboratory tests carried out in Finland. Frey et al. (2006) burned only one wood
15
species, birch, which is the most common wood in small-scale residential heating. For another wood species used in Finland, spruce and pine, OC/EC ratios from 1.7 to 2.5 have been measured (Iinuma et al., 2007). In contrast, the OC/EC ratio obtained in this study is much lower than the average OC/EC ratio Fine et al. (2001, 2002, 2004) measured for 22 wood species (26). 40% of OC attributed to biomass combustion
20
was water-soluble (Table 3). Compared to laboratory studies of Frey et al. (2006), the percentage was two times that measured for normal and smoldering combustion (22% and 18%, respectively) but it was only slightly higher than that obtained by Iinuma et al. (2007) (29 to 38%). It is obvious that a large portion of water-insoluble OC emissions from biomass combustion transform into water-soluble OC through oxidation in the
25
atmosphere. However, that process must be quite fast since the particulate matter from the biomass combustion measured in this study is assumed to be regional or to a certain extent even local.
ACPD
8, 7805–7846, 2008 Sources of organic carbon in Helsinki, Finland S. Saarikoski et al. Title Page Abstract Introduction Conclusions References Tables Figures ◭ ◮ ◭ ◮ Back CloseFull Screen / Esc
Printer-friendly Version Interactive Discussion of biomass combustion related OC to total OC measured from the ambient air
(e.g. Zdr ´ahal et al., 2002). According to PMF results the OC/levoglucosan ratio was 9.2 for biomass combustion (Table 3). It is slightly smaller than the ratio measured by Frey et al. (2006) for normal combustion (9.8) but in case of smoldering the ratio was significantly higher being equal to 24.6. In the studies of Fine et al. (2001; 2002;
5
2004) the average OC/levoglucosan ratio was 14.2 but the variation between the wood species was substantial ranging from 3.0 to 100. A rather small OC/levoglucosan ratio has been measured for pine (2.1–3.5) and spruce (2.1) by Iinuma et al. (2007).
The suitability of levoglucosan for quantitatively tracking the biomass combustion emissions can be questioned, since its emission fraction is highly dependent on
com-10
bustion conditions (Hedberg et al., 2006). Congruent with this, also the ambient ratios of different biomass smoke markers have been found to vary significantly from day to day, indicating that the composition of the biomass smoke is variant (Robinson et al., 2006b). Also the sampling methods as well as the correction methods for the sampling artifacts (negative and positive) affect the OC/levoglucosan ratios measured either for
15
the biomass combustion aerosol or for the ambient aerosol samples.
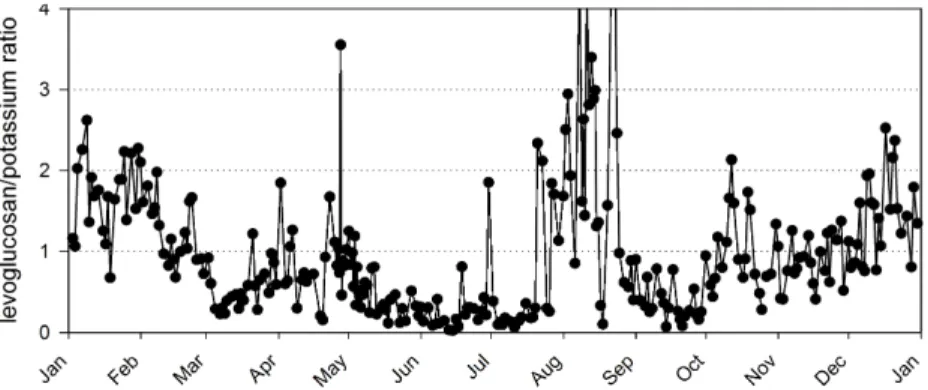
Laboratory tests have shown that levoglucosan is stable over a period of 10 days (Fraser and Lakshmanan, 2000). However, Gao et al. (2003) speculated that levoglu-cosan may be chemically converted into diacids during an upward transport. In this study also evidence of the depletion of levoglucosan was found. By comparing
lev-20
oglucosan to potassium, the concentration of levoglucosan decreased more sharply than that of potassium from winter to summer, as illustrated by the time trend for the levoglucosan/potassium ratio (Fig. 6). Since potassium is known to be stable in the atmosphere, it must be levoglucosan that had disappeared from the particles. A clear seasonal trend for the levoglucosan/potassium ratio suggested that in summer
levoglu-25
cosan may have been photochemically oxidized. This kind of atmospheric process is in accordance with the study of Robinson et al. (2006a), in which photochemical oxida-tion was found to cause severe depleoxida-tion of hopanes, the molecular markers for motor vehicle emissions, in summer.
ACPD
8, 7805–7846, 2008 Sources of organic carbon in Helsinki, Finland S. Saarikoski et al. Title Page Abstract Introduction Conclusions References Tables Figures ◭ ◮ ◭ ◮ Back CloseFull Screen / Esc
Printer-friendly Version Interactive Discussion Instead of photochemical oxidation in summer, the results from PMF suggested,
however, that the loss of levoglucosan was related to transport. As mentioned before (and shown in Fig. 4), fine LRT particles contained considerable amounts of potassium, an evidence that biomass combustion emissions contributed to LRT. On the other hand, there was no levoglucosan in LRT. The absence of levoglucosan in LRT explains the
5
seasonal variation of the levoglucosan/potassium ratio (Fig. 6). There can be a sea-sonal trend also for the biomass combustion particles in LRT, but that could not be resolved although PMF was run for summer and winter data separately (not shown).
3.2 Online measurements 3.2.1 Diurnal variation of OC
10
In addition to the PM1filter samples, OC concentration was measured by the semicon-tinuous OC/EC analyzer with a time-resolution of three hours. In the case of filter sam-ples the aim was to study the sources of OC on a daily basis, whereas the data from the semicontinuous OC/EC instrument was used to investigate the diurnal variation of the sources. Similar to the filter measurements, semicontinuous OC measurements
15
covered one year period, from September 2006 to August 2007, but the measure-ment periods overlapped only for six months. In order to compare the semicontinuous OC/EC to PM1filters, the 3-h data were averaged to correspond with the 24-h PM1 fil-ter samples collected simultaneously (September 2006–February 2007; 102 samples). On average, the semicontinuous OC/EC gave 4% larger concentrations for OC than
20
PM1filters (R20.90). A similar difference was obtained for EC, with 5% higher concen-trations obtained from the semicontinuous OC/EC than from the filter measurements (R20.90).
The diurnal variation of the OC concentration was small compared with its day-to-day variability. Even though the OC data was divided into four seasons (fall: Sep–Nov,
win-25
ter: Dec–Feb, spring: Mar–May, summer: Jun–Aug) the diurnal variation was still small. However, there were some typical daily patterns observed in winter and in summer. In
ACPD
8, 7805–7846, 2008 Sources of organic carbon in Helsinki, Finland S. Saarikoski et al. Title Page Abstract Introduction Conclusions References Tables Figures ◭ ◮ ◭ ◮ Back CloseFull Screen / Esc
Printer-friendly Version Interactive Discussion winter OC was at its highest in the evening. That can be explained by low boundary
layer height and weak mixing in the evening due to stable atmosphere. Concerning the emissions of wood combustion, it is most likely that the emissions are highest in the evening when people return to their houses after the work. OC concentrations were especially high in Saturday evenings in wintertime. Besides fireplaces and wood
5
stoves, these high OC concentrations were obviously related to saunas heated typi-cally in Saturday evenings. One example of this kind of local biomass combustion will be shown in Sect. 3.2.3. In Denmark residential wood combustion in the evening has been observed as peak concentrations of EC (Glasius et al., 2006) but that was not observed in Helsinki.
10
In summer the concentration of OC was slightly lower in the afternoon and in the evening than in other times of the day. Again, this was probably related to the local meteorology resulting from more efficient mixing of afternoon pollutants with increasing temperature in daytime. Semi-volatile organic compounds might also have an effect on the observed trend because the volatilization of these compounds from particles
15
increases with the increasing temperature. In several earlier studies OC has been found to peak in daytime due to SOA formation (e.g. Takegawa et al., 2006; Polidori et al., 2006; Plaza et al., 2006). Even though SOA was found to be a major source for OC in Helsinki in summer (Table 2) the formation of SOA could not be seen from the semicontinuous OC data. That indicates the major part of SOA being regional as
20
suggested by Subramanian et al. (2007).
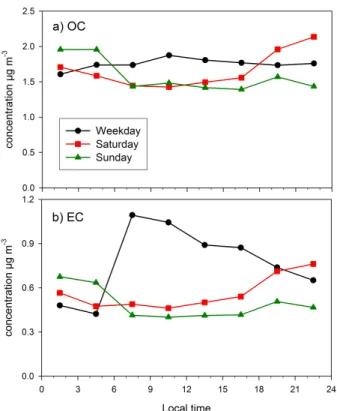
The difference between weekdays and weekends was small for the OC concentra-tions (Fig. 7a). On average, the OC concentration was quite stable throughout the day on weekdays, in contrast to clear diurnal variation observed on Saturdays and Sundays. On Saturdays, OC was lower in daytime than at night, but the highest OC
25
concentrations were measured at nights between Saturday and Sunday. In addition to domestic biomass combustion in Saturday evenings the high concentrations were prob-ably caused by traffic. Overall, the OC concentrations were higher on weekdays than on weekends only from 06:00 to 18:00, the difference being in the range 0.30–0.42 µg m−3.
ACPD
8, 7805–7846, 2008 Sources of organic carbon in Helsinki, Finland S. Saarikoski et al. Title Page Abstract Introduction Conclusions References Tables Figures ◭ ◮ ◭ ◮ Back CloseFull Screen / Esc
Printer-friendly Version Interactive Discussion For EC the diurnal variation was close to that of OC on Saturdays and Sundays but on
weekday EC was clearly elevated in daytime because of traffic (Fig. 7b).
3.3 Contribution of traffic to OC
Because of low number of chemical components measured online (OC, EC, gases), PMF was not used for the semicontinuous OC/EC data. Instead, the impact of traffic
5
on OC was estimated by using the OC/EC ratio obtained for traffic by PMF (0.71, Table 2). This approach assumes that all EC originated from traffic and that the OC/EC ratio for traffic does not depend on the season. On average, this “fixed OC/EC ratio” method gave larger contribution of traffic to OC (34%) than PMF (20%, Table 2) which was expected since only 58% of EC was attributed to traffic by PMF. Also, it should be
10
noted that only half of the measurement period of semicontinuous OC/EC overlapped the period of PM1 filter samples used for PMF. However, the difference between two methods is reasonable since the main purpose of using this “fixed OC/EC ratio” method was to study the diurnal variation of traffic related OC.
By using the OC/EC ratio of 0.71 the contribution of traffic to OC was 36% at
week-15
days and 24 and 25% on Saturdays and Sundays, respectively (Fig. 8). The contri-bution of traffic was at its highest at weekdays during morning rush hour, from 06:00 to 09:00, being equal to 57%. After that the contribution decreased having the low-est value from 03:00 to 06:00 (18%). At weekends the contribution of traffic to OC ranged from 19 to 30%. On Saturdays the contribution increased slightly in the
morn-20
ing, whereas on Sunday the highest contribution was measured in the evening (18:00– 21:00) caused obviously by people returning home from their summer cabins. Similarly to the weekdays the lowest contribution at weekends was measured at 03:00–06:00. The contribution of traffic to OC was higher in Helsinki than that measured in Toronto, in May and in June (Brook et al., 2007). In Toronto the contribution of motor vehicles to
25
primary OC was 18% at weekdays and 7.0% at weekends. The daytime contribution was 1.5 times that measured during the night in Toronto.
ACPD
8, 7805–7846, 2008 Sources of organic carbon in Helsinki, Finland S. Saarikoski et al. Title Page Abstract Introduction Conclusions References Tables Figures ◭ ◮ ◭ ◮ Back CloseFull Screen / Esc
Printer-friendly Version Interactive Discussion 3.3.1 The influence of biomass combustion (Case study)
Since neither of the tracers, levoglucosan or potassium, were measured online con-tinuously, the diurnal variation for the contribution of biomass combustion could not be calculated. However, the PILS-IC system operated at SMEAR III in January and February 2007 enabled studying of the biomass combustion qualitatively. One case of
5
the local biomass combustion is shown in Fig. 9.
On Saturday, 10 February, the OC concentration increased significantly at about 18:00 and remained elevated until 06:00 on Sunday, 11 February. This concentration peak was probably caused by a decreased boundary layer height accompanied by a decreasing temperature and low wind speed (Fig. 9e). In addition to the meteorological
10
situation, favoring poor dilution of emissions, there were two major sources for OC at that weekend. The highest OC concentration was measured on Saturday evening at 18:00–21:00 concurrently with the peak concentration of potassium (Fig. 9a). In addition to extensive biomass combustion for domestic heating because of low ambient temperature, the saunas are traditionally heated in Finland on Saturday evening but
15
also the use of fireplace for pleasure is most common on Saturday evening. In the PILS-IC data chloride concentration followed closely that of potassium (Fig. 9b). Since the concentration of sodium was steady on that weekend (Fig. 9b) the increase of chloride was likely to be associated with biomass combustion (Andreae et al., 1998) but it should be noted chloride can also be attributed to coal combustion (Song et al.,
20
2006). In Helsinki the domestic coal combustion can be assumed to be extremely small, and since the coal-fired power plants have high release height they are not likely to affect the chloride concentrations observed near ground level.
Besides biomass combustion the OC concentration was influenced by traffic. That can be seen from the elevated EC concentrations, especially on Sunday, (Fig. 9a)
25
as well as from NO, NO2 and CO concentrations (Fig. 9d). Independent of NO and NO2, there was a peak in the CO concentration on the Saturday evening (at 19:00– 20:00), demonstrating that CO was attributed to both traffic emissions and local wood
ACPD
8, 7805–7846, 2008 Sources of organic carbon in Helsinki, Finland S. Saarikoski et al. Title Page Abstract Introduction Conclusions References Tables Figures ◭ ◮ ◭ ◮ Back CloseFull Screen / Esc
Printer-friendly Version Interactive Discussion combustion as has been observed also by Glasius et al. (2006). Other ions analyzed
by the PILS-IC, sulfate, ammonium and nitrate (Fig. 9c), were not influenced by the temperature inversion indicating that they did not originate from the local sources like biomass combustion or traffic.
4 Summary and conclusions
5
The origin of organic carbon in fine particulate matter in Helsinki, Finland, was as-sessed by measuring the chemical composition of particles with three different time-resolutions. First, the PM1filter samples were collected on a daily basis for a year and subsequently analyzed for major chemical components and some tracers. The data were analyzed by using PMF which resolved the factors affecting the concentrations.
10
Secondly, the OC and EC concentrations were measured with a time-resolution of three hours by the semicontinuous OC/EC instrument in order to study the diurnal trends of the sources. Finally, one example of the local pollution situation occurring typically in winter was shown. During that case, the PILS-IC determined the concentrations of major ions with the time-resolution of 15 minutes.
15
PM1 filter samples were collected from March 2006 to February 2007. The period was quite special since in spring and summer 2006 large quantities of biomass smokes were transported to Helsinki mostly from Russia. During these episodes the OC con-centrations elevated significantly, but the impact of episodes was important also on annual basis. By taking into account the episodes an annual average for OC was
20
2.5 µg m−3 but it decreased to 1.5 µg m−3 when the episodes were excluded. How-ever, since the aim of this study was to evaluate the sources of OC ordinarily affecting Helsinki, the episodes were removed from the data set prior to PMF.
The OC concentrations were found to be influenced by four major sources: biomass combustion, traffic, long-range transport and secondary aerosol production. On an
25
annual basis the OC concentrations were dominated by secondary organic aerosol (34%). The contribution of SOA was surprisingly high both in winter (16%) and summer
ACPD
8, 7805–7846, 2008 Sources of organic carbon in Helsinki, Finland S. Saarikoski et al. Title Page Abstract Introduction Conclusions References Tables Figures ◭ ◮ ◭ ◮ Back CloseFull Screen / Esc
Printer-friendly Version Interactive Discussion (64%) when taking into account the low photochemical activity at high latitudes.
How-ever, the large SOA fraction can be explained by significant biogenic VOC emissions in the boreal region, serving as precursors for the SOA formation. Biomass combustion constituted the largest fraction of OC in winter (41%), indicating extensive domestic biomass combustion for heating purposes. For traffic the contribution to OC was equal
5
between the fall, winter and spring (25–27%), but lower in summer (15%). On average 24% of OC was from long-range transportin Helsinki. That fraction included probably also long-range transported biomass combustion emissions. Levoglucosan, the tracer used for tracking biomass combustion, may have depleted during the transport.
Traffic influenced OC concentrations throughout the day. By comparing weekdays
10
with weekends, the contribution of traffic was larger between 06:00 and 18:00 on week-days than on weekends. Biomass combustion was observed as elevated OC concen-trations in the evening in winter, especially on Saturday evenings. Besides wood com-bustion for domestic heating this finding was related to fireplaces used for pleasure and saunas, both heated traditionally on Saturday evening.
15
On annual basis 56% of OC was water-soluble. All of the four identified sources affected WSOC concentrations but with different contributions than in case of OC. The contribution of SOA was much larger to WSOC than to OC, whereas the influence of traffic was smaller on WSOC than on OC.
Acknowledgements. S. Saarikoski thanks the Maj and Tor Nessling Foundation for the
finan-20
cial support. The financial support from the Graduate School in Physics, Chemistry, Biology and Meteorology of Atmospheric Composition and Climate Change (University of Helsinki) and European Union (EUCAARI, Contract No: 036833) is also gratefully acknowledged.
References
Andreae, M. O., Andreae, T. W., Annegarn, H., Beer, J., Cachier, H., le Canut, P., Elbert, W.,
25
emis-ACPD
8, 7805–7846, 2008 Sources of organic carbon in Helsinki, Finland S. Saarikoski et al. Title Page Abstract Introduction Conclusions References Tables Figures ◭ ◮ ◭ ◮ Back CloseFull Screen / Esc
Printer-friendly Version Interactive Discussion sions from savanna fires in southern Africa: 2. Aerosol chemical composition, J. Geophys.
Res. Lett., 103, 32,119–32,128, 1998.
Arhami, K., Kuhn, T., Fine, P. M., Delfino, R. J., and Sioutas, C.: Effects of sampling artifacts and operating parameters on the performance of a semicontinuous particulate elemental carbon/organic carbon monitor, Environ. Sci. Technol., 40, 945–954, 2006.
5
Berner, A. and L ¨urzer, C.: Mass size distributions of traffic aerosols at Vienna, J. Phys. Chem., 84, 2079–2083, 1980.
Birch, M. E. and Cary, R. A.: Elemental carbon-based method for monitoring occupational exposures to particulate diesel exhaust, Aerosol Sci. Tech., 25, 221–241, 1996.
Boman, B. C., Forsberg, A. B., and J ¨arvholm, B. G.: Adverse health effects from ambient air
10
pollution in relation to residential wood combustion in modern society, Scand. J. Work Env. Hea., 29, 251–260, 2003.
Brook, J. R., Graham, L., Charland, J. P., Cheng, Y., Fan, X., Lu, G., Li, S. M., Lillyman, C., MacDonald, P., Caravaggio, G., and MacPhee, J. A.: Investigation of the motor vehicle exhaust contribution to primary fine particle organic carbon in urban air, Atmos. Environ., 41,
15
119–135, 2007.
Cabada, J. C., Pandis, S., N., and Robinson, A. L.: Sources of atmospheric carbonaceous particulate matter in Pittsburgh, Pennsylvania, J. Air Waste Manage. Assoc., 52, 732–741, 2002.
Chebbi, A. and Carlier, P.: Carboxylic acids in the troposphere, occurrence, sources, and sinks:
20
a review, Atmos Environ., 24, 4233–4249, 1996.
Decesari, S., Facchini, M. C., Matta E., Lettini, F., Mircea, M., Fuzzi, S., Tagliavini, E., and Putaud, J.-P.: Chemical features and seasonal variation of fine aerosol water-soluble organic compounds in the Po Valley, Italy, Atmos Environ., 35, 3691–3699, 2001.
Dye, C. and Yttri, K. E.: Determination of monosaccharide anhydrides in atmospheric aerosols
25
by use of high-performance liquid chromatography combined with high-resolution mass spec-trometry, Anal. Chem., 77, 1853–1858, 2005.
Fine, P. M., Cass, G. R., and Simoneit, B. R. T.: Chemical characterization of fine particle emissions from fireplace combustion of woods grown in the Northeastern United States, Environ. Sci. Technol., 35, 2665–2675, 2001.
30
Fine, P. M., Cass, G. R., and Simoneit, B. R. T.: Chemical characterization of fine particle emissions from fireplace combustion of woods grown in the Southern United States, Environ. Sci. Technol., 36, 1442–1451, 2002.
ACPD
8, 7805–7846, 2008 Sources of organic carbon in Helsinki, Finland S. Saarikoski et al. Title Page Abstract Introduction Conclusions References Tables Figures ◭ ◮ ◭ ◮ Back CloseFull Screen / Esc
Printer-friendly Version Interactive Discussion Fine, P. M., Cass, G. R., and Simoneit, B. R. T.: Chemical characterization of fine particle
emissions from the fireplace combustion of wood types grown in the Midwestern and Western United States, Environ. Eng. Sci., 21, 387–409, 2004.
Fraser, M. P. and Lakshmanan, K.: Using levoglucosan as a molecular marker for the long-range transport of biomass combustion aerosols, Environ. Sci. Technol., 34, 4560–4564,
5
2000.
Frey, A., Virkkula, A., Saarnio, K., Timonen, H., Tolonen-Kivim ¨aki, O., Aurela, M., Hillamo, R., Tissari, J., Hyt ¨onen, K., Willman, P., Jokiniemi, J., Mannila, R., Saari, H., and N ¨akki, I.: Aerosol composition in fireplace emissions, Report Series in Aerosol Science, 83, 325–329, 2006.
10
Gao, S., Hegg, D. A., Hobbs, P. V., Kirchstetter, T. W., Magi, B. I., and Sadilek, M.: Water-soluble organic components in aerosols associated with savanna fires I south-ern Africa: Identification, evolution and distribution, J. Geophys. Res., 108, D13, 8491, doi:10.1029/2002JD002324, 2003.
Glasius, M., Ketzel., M., W ˚ahlin, P., Jensen, B., Mønster, J., Berkowicz, R., and Palmgren,
15
F.: Impact of wood combustion on particle levels in a residential area in Denmark, Atmos. Environ., 40, 7115–7124, 2006.
Hedberg, E., Johansson, C., Johansson, L., Swietlicki, E., and Brorstr ¨om-Lund ´en, E.: Is lev-oglucosan a suitable quantitative tracer for wood burning? Comparison with receptor mod-eling on trace elements in Lycksele, Sweden, J. Air Waste Manage. Assoc., 56, 1669–78,
20
2006.
Huang, X.-F., Yu, J. Z., He, L.-Y., and Yuan, Z.: Water-soluble organic carbon and oxalate in aerosols at a coastal urban site in China: Size distribution characteristics, sources and formation mechanisms, J. Geophys. Res., 111, D22212, doi:10.1029/2006JD007408, 2006. Iinuma, Y., Br ¨ugemann, E., Gnauk, T., M ¨uller, K., Andreae, M. O., Helas, G., Parmar, R.,
25
and Herrmann, H.: Source characterization of biomass burning particles: the combustion of selected European conifers, African hardwood, savanna grass, and German and Indonesian peat, J. Geophys. Res., 112, D08209, doi:10.1029/2006JD007120, 2007.
Jaffrezo, J.-L., Aymoz, G., Delaval, C., and Cozic J.: Seasonal variation of the water soluble organic carbon mass fraction of aerosol in two valleys of the French Alps, Atmos. Chem.
30
Phys., 5, 2809–2821, 2005,
http://www.atmos-chem-phys.net/5/2809/2005/.
ACPD
8, 7805–7846, 2008 Sources of organic carbon in Helsinki, Finland S. Saarikoski et al. Title Page Abstract Introduction Conclusions References Tables Figures ◭ ◮ ◭ ◮ Back CloseFull Screen / Esc
Printer-friendly Version Interactive Discussion for assessing the portion of fine particulate matter transported regionally and long range to
urban air, Scand. J. Work Env. Hea., 30 suppl. 2, 47–53, 2004.
Kondo, Y., Miyazaki, Y., Takegawa, N., Miyakawa, T., Weber, R. J., Jimenez, J. L., Zhang, Q., and Worsnop, D. R.: Oxygenated and water-soluble organic aerosols in Tokyo, J. Geophys. Res., 112, D01203, doi:10.1029/2006JD007056, 2007.
5
Kunzli, N., Kaiser, R., Medina, S., Studnicka, M., Chanel, O., Filiger, P., Herry, M., Horak, F., Puybonnieuax-Texier, V., Qu ´enel, P., Schneider, J., Seethaler, R., Vergnaud, J.-C., and Sommer, H.: Public-health impact of outdoor and traffic-related air pollution: a European assessment, The Lancet, 356, 795–801, 2000.
Kuokka, S., Teinil ¨a, K., Saarnio, K., Aurela, M., Sillanp ¨a ¨a, M., Hillamo, R., Kerminen, V.-M.,
10
Pyy, K., Vartiainen, E., Kulmala, M., Skorokhod, A. I., Elansky, N. F., and Belikov, I. B.: Using a moving measurement platform for determining the chemical composition of atmospheric aerosols between Moscow and Vladivostok, Atmos. Chem. Phys., 7, 4793–4805, 2007,
http://www.atmos-chem-phys.net/7/4793/2007/.
Lighty, J. S., Veranth, J. M., and Sarofim, A. F.: Combustion aerosols: factors governing their
15
size and composition and implications to human health, J. Air Waste Manage. Assoc., 50, 1565–1618, 2000.
Lindfors, V., Laurila, T., Hakola, H., Steinbrecher, R., and Rinne, J.: Modeling speciated ter-penoid emissions from the European boreal forest, Atmos. Environ., 34, 4983–4996, 2000. Loo, B. W. and Cork, C. P.: Development of high efficiency virtual impactor, Aerosol Sci. Tech.,
20
9, 167–170, 1988.
Na, K., Sawant, A. A., Song, C., and Cocker III, D. R.: Primary and secondary carbonaceous species in the atmosphere of Western Riverside County, California, Atmos. Environ., 38, 1345–1355, 2004.
Naeher, L. P., Brauer, M., Lipsett, M., Zelikoff, J. T., Simpson, C. D., Koenig, J. Q., and Smith,
25
K. R.: Woodsmoke health effects: a review, Inhal. Toxicol., 19, 67–106, 2007.
Nunes, T. V. and Pio, C. A.: Carbonaceous aerosols in industrial and coastal atmospheres, Atmos. Environ., 27A, 1339–1346, 1993.
Orsini, D. A., Ma, Y., Sullivan, A., Sierau, B., Baumann, K., and Weber, R. J.: Refinements to the particle-into-liquid sampler (PILS) for ground and airborne measurements of water
30
soluble aerosol composition, Atmos. Environ., 37, 1243–1259, 2003.
Paatero, P.: Least squares formulation of robust non-negative factor analysis, Chemometr. Intell. Lab., 37, 23–35, 1997.
ACPD
8, 7805–7846, 2008 Sources of organic carbon in Helsinki, Finland S. Saarikoski et al. Title Page Abstract Introduction Conclusions References Tables Figures ◭ ◮ ◭ ◮ Back CloseFull Screen / Esc
Printer-friendly Version Interactive Discussion Paatero P.: The multilinear engine – a table-driven, least squares program for solving multilinear
problems, including the n-way parallel factor analysis model, J. Comput. Graph. Stat., 1, 854–888, 1999.
Pakkanen, T. A., Loukkola, K., Korhonen, C. H., Aurela, M., M ¨akel ¨a, T., Hillamo, R., Aarnio, P., Koskentalo, T., Kousa, A., and Maenhaut, W.: Sources and chemical composition of
5
atmospheric fine and coarse particles in the Helsinki area, Atmos. Environ., 35, 5381–5391, 2001.
Plaza, J., G ´omez-Moreno, F. J., N ´u ˜nez, L., Pujadas, M., and Art´ı˜nano, B.: Estimation of sec-ondary organic aerosol formation from semi-continuous OC-EC measurements in a Madrid suburban area, Atmos. Environ., 40, 1134–1147, 2006.
10
Polidori, A., Turoin, B. J., Lim, H.-J., Cabada, J. C., Subramanian, R., Pandis, S., and Robinson, A.: Local and regional secondary organic aerosol: insights from a year of semi-continuous carbon measurements at Pittsburgh, Aerosol Sci. Technol., 40, 861–872, 2006.
Rader D. J. And Marple, V. A.: Effect of ultra-Stokesian drag and particle interception on im-paction characteristics, Aerosol Sci. Technol., 4, 141–156, 1985.
15
Robinson, A. L., Donahue, N. M., and Rogge, W. F.: Photochemical oxidation and changes in molecular composition of organic aerosol in the regional context, J. Geophys. Res., 111, D03302, doi:10.1029/2005JD006265, 2006a.
Robinson, A. L., Subramanian, R., Donahue, N. M., Bernardo-Bricker, A., and Rogge, W. F.: Source apportionment of molecular markers and organic aerosol. 2. Biomass smoke,
Envi-20
ron. Sci. Technol., 40, 7811–7819, 2006b.
Rogge, W. F., Mazurek, M. A., Hildemann, L. M., Cass, G. R., and Simoneit, B. R. T.: Quantifi-cation of urban organic aerosols at molecular level: identifiQuantifi-cation, abundance and seasonal variation, Atmos. Environ., 27A, 1309–1330, 1993.
Ruellan, S. and Cachier, H.: Characterization of fresh particulate vehicular exhausts near a
25
Paris high flow road, Atmos. Environ., 35, 453–468, 2001.
Saarikoski, S., Sillanp ¨a ¨a, M., Sofiev, M., Timonen, H., Saarnio, K., Teinil ¨a, K., Karppinen, A., Kukkonen, J., and Hillamo, R.: Chemical composition of aerosols during a major biomass burning episode over northern Europe in spring 2006: Experimental and modeling assess-ments, Atmos. Environ., 41, 3577–3589, 2007.
30
Saxena, P., and Hildemann, L. M.: Water-soluble organics in atmospheric particles: a critical review of the literature and application of thermodynamics to identify candidate compounds, J. Atmos. Chem., 24, 57–109, 1996.


![[PDF] Apprendre la programmation Android avec base de données - Free PDF Download](data:image/gif;base64,R0lGODlhAQABAIAAAP///wAAACH5BAEAAAAALAAAAAABAAEAAAICRAEAOw==)