Demand Forecasting Accuracy in Airline Revenue Management: Analysis of Practical Issues with Forecast Error Reduction
by
Adeem Syed Usman
B.E., College of Aeronautical Engineering, Pakistan Air Force Academy, Risalpur (1996) MBA, Imperial College of Science, Technology and Medicine, London (2001)
Submitted to the Department of Aeronautics and Astronautics in Partial Fulfilment of the Requirement for the Degree of Master of Science in Aeronautics and Astronautics
at the
Massachusetts Institute of Technology September 2003
@ 2003 Massachusetts Institute of Technology All rights reserved
Signature of Author...
International Centre for Air Transportation Department of Aeronautics and Astronautics August 21, 2003 Certified by... AccepteU Dy... MASSACHUSElT MASSACHUSETT OFTECHNC
NOV 0
5
... ---....Peter Paul Belobaba Principal Research Scientist Department of Aeronautics and Astronautics Thesis Supervisor
---'' Edward M. Greitzer
H.N. Slater Professor of Aeronautics and Astronautics
Chair, Committee on Graduate Students
S INSTITUTE
LOGY
Demand Forecasting Accuracy in Airline Revenue Management
Demand Forecasting Accuracy in Airline Revenue Management: Analysis of Practical Issues with Forecast Error Reduction
by
Adeem Syed Usman
Submitted to the Department of Aeronautics and Astronautics on August 21, 2003 in Partial Fulfilment of the Requirement for the Degree of Master of Science in Aeronautics and Astronautics
Abstract
In any business, conventional wisdom dictates that lower forecast errors lead to better revenue performance. However, in airline revenue management, traditional methods of measuring forecast error show no clear relationship with revenues. This can be attributed to the deficiency in the basic forecasting assumption of independence of demand in a particular fare class on a flight from other fare classes/flights. In real life, passengers sell-up to higher fare classes and travel on other flights in the same or higher fare class. This leads to a situation where determination of actual realised demand becomes dependent on the state of the entire network at a particular time i.e., which fare classes are available for booking on the flight in question as well as other flights in the market, both of the airline and its competitors. Traditional measures of forecast accuracy that rely on estimated values of actual demand thus are of little use in evaluating forecasting performance in airline revenue management.
This thesis initially identifies and discusses these practical issues in determination of "actual" demand. It then attempts to gain an insight into the forecasting fundamentals by first
analysing forecast accuracy in a simple monopoly network. A controlled case is set up to replicate the basic assumptions of reservations forecasting and set up a base comparison of forecasting methods. The analysis is then extended to include a competitive network. The results show that there is no clear relationship between forecast error and revenues as the realised demand under every network configuration is state-dependent.
Throughout the analysis, arbitrary forecast inflation leads to higher revenues under the leg-based forecasting and optimisation scheme. This arbitrary inflation of demand forecasts
appears to compensate for the failure of leg-based optimisation to dynamically account for the arrival pattern of demand and the inability of leg-based forecasting to correctly estimate demand in multi-leg markets. Thus, this arbitrary forecast inflation leads to higher revenues despite being "less accurate" when analysed under the traditional forecast-error metrics. The analysis shows that use of path-based forecasting, to avoid partial detruncation problems on multi-leg paths and a future protect algorithm to dynamically adjust to the arrival pattern of demand results in much improved revenues that are comparable to those obtained through forecast inflation.
Thesis Advisor: Dr. Peter Paul Belobaba
Demand Forecasting Accuracy in Airline Revenue Management
"In the name ofAllah the most beneficent and most merciful"
Acknowledgements
First and foremost, I would like to thank my thesis and research advisor Dr. Peter Paul Belobaba for his tremendous help, guidance, perseverance and support throughout my
stay at the Massachusetts Institute of Technology. He was always there to help me understand the various aspects of Revenue Management and guide my research efforts. He painstakingly reviewed the thesis a number of times and is instrumental in making this thesis possible.
I would like to thank all the members of the PODS Consortium (Continental Airlines,
Delta Airlines, KLM, Lufthansa, Northwest Airlines, SAS and Swiss Airlines) for their support and guidance in the research directions and their input and comments.
I would like to thank Craig Hopperstad for reviewing the initial research proposal and his
enormous help in formalising the research direction. He was always only a phone call away to explain various aspects of PODS and rectify any issues.
I would also like to thank all my PODS colleagues, especially Thomas Gorin, Andrew
Cusano, Emmanuel Carrier and Alex Lee. They were always on hand to help me out with any research-related issue as well as being highly supportive throughout my stay.
Last but surely not the least; I would like to thank my family; my parents, Mr. Usman Ali and Mrs. Sultana Sayyeda, for helping me make it to MIT and being always there for me; they are the best parents one can have; my sister Shazia for her encouragement and my brother Arshad for his support.
Demand Forecasting Accuracy in Airline Revenue Management
Table of Contents
ABSTRA C T ... 2
A C K N O W LED G EM EN TS ... 3
TA BLE O F C O N TEN TS... 4
LIST O F FIG UR ES... 6
CHAPTER 1: INTRODUCTION DEMAND FORECASTING ACCURACY IN AIRLINE REVENUE MANAGEMENT:... 8
M OTIVATION ... 8
O BJECTIVES... 11
CHAPTER 2: THEORY FORECAST ACCURACY: ISSUE DEFINITION AND LITERATURE REVIEW ... 13
REVENUE M ANAGEMENT BASICS... 13
The Seat Inventory Control Process ... 13
Need for Forecasts ... 15
Need for Accurate Forecasts... 15
REVIEW OF FORECAST ACCURACY STUDIES... 17
Revenue M anagem ent Forecasting M odels ... 17
Categorisation of Revenue M anagement Forecasting M odels ... 18
Historical Bookings M odels ... 18
Advance Bookings M odels ... 20
Combined Historical and Advance Bookings ... 21
Review of Comparative Assessment Studies ... 22
FORECAST A CCURACY AS A CONCEPT... 25
Forecasting Assumptions in Airline Revenue M anagement... 25
Contrast with Real W orld Passenger Behaviour ... 28
Issues of Inherent Bias due to Choice of Base ... 30
Definition of Inherent Bias... 30
Is Zero Forecast Error Possible or D esirable? ... 32
D ETRUNCATION... 33
The Need for D etruncation ... 33
Entwined Nature of D etruncation and Forecasting... 34
Review of Previous Forecast Accuracy Studies in context of Detruncation ... 34
SUM MARY ... 35
CHAPTER 3: SIMULATION RESULTS PO D S SIM U LATIO N R ESULTS ANALY SIS ... 36
POD S: A BRIEF INTRODUCTION... 36
P O D S M o d e l... 3 6 W orking of a Simulation... 38
N e tw o rk D ... 3 9 Revenue M anagement M ethods ... 40
Fare Class Revenue M anagement Algorithms ... 40
Demand Forecasting Accuracy in Airline Revenue Management
Origin-Destination Algorithms ... 41
Displacement Adjusted Virtual Nesting (DAVN)... 42
Heuristic Bid Price (HBP) ... 42
Prorated Bid Price (ProBP)... 43
Forecasting M ethods ... 43
P ick up F o recastin g ... 4 3 R eg ression F orecastin g ... 44
D etruncation M ethods ... 45
Booking Curve Detruncation ... 45
P rojection D etrun catio n ... 4 5 POD S FORECAST A CCURACY M EASURES ... 46
RESEARCH M ETHODOLOGY ... 47
Part 1: Forecast Accuracy vs. Revenue Relationship ... 49
S im u latio n S etu p ... 4 9 M onopoly Network Description ... 49
Revenue Optimiser M ethods... 49
D etrun cation S ch em es ... 4 9 F o re c a ste rs ... 5 0 F o recast M u ltip lication ... 5 0 S im u latio n an d R esu lts... 5 1 Single Path per M arket, First Choice Only Choice, M onopoly Network Analysis ... 51
Single Path per M arket, M onopoly Network Analysis with Sellup ... 63
Multiple Paths per Market, First Choice Only Choice, Monopoly Network Analysis... 74
M ultiple Paths per M arket, M onopoly Network Analysis ... 80
Part 2: Use of Path-based Forecast and Future Protect ... 88
F u tu re P ro tect... 8 9 S im u latio n S etu p ... 9 0 Single Path per Market, First Choice Only Choice, Monopoly Network Configuration... 90
Single Path per M arket M onopoly Network Configuration with Sellup ... 92
Multiple Path per Market, First Choice Only Choice, Monopoly Network Configuration ... 94
Multiple Path per Market, Monopoly Network Configuration with Sellup and Recapture ... 96
M ultiple Path per M arket, Competitive Network Configuration... 98
SUM M ARY ... 101
CHAPTER 4: CONCLUSION PRIN CIPA L FIN DIN G S O F ANALY SIS: ... 102
SYNOPSIS OF THESIS O BJECTIVES... 102
SUM M ARY OF PRINCIPAL FINDINGS... 103
FUTURE RESEARCH D IRECTIONS ... 105
Demand Forecasting Accuracy in Airline Revenue Management
List of Figures
FIGURE 1: SEAT INVENTORY CONTROL PROCESS... 14
FIGURE 2: FORECAST ERROR-REVENUE RELATIONSHIP ... 16
FIGURE 3: MARKET DEMAND SEGMENTATION MODEL ... 29
FIGURE 4: INHERENT BIASES IN MEASUREMENT OF FORECAST ERROR... 30
FIGURE 5: PODS ARCHITECTURE, SOURCE: HOPPERSTAD, THE BOEING COMPANY ... 37
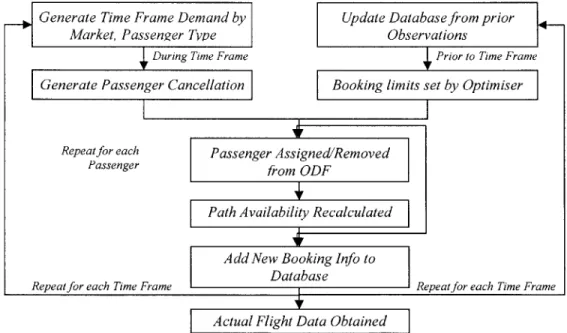
FIGURE 6: PODS FLOW CHART, SOURCE: ZICKUS, JEFFREYS. (1998) ... 38
FIGURE 7: FLOW D IAGRAM FOR N ETWORK D ... 39
FIGURE 8: GEOGRAPHICAL ARRANGEMENT OF NETWORK D... 39
FIGURE 9: PROJECTION D ETRUNCATION... 46
FIGURE 10: REVENUE GAINS UNDER FCYM-FIRST CHOICE ONLY CHOICE, SINGLE PATH/MARKET, M O N O PO L Y ... 5 3 FIGURE 11: REVENUE GAINS BY FARE CLASS UNDER FCYM ... 54
FIGURE 12: Y-CLASS MEAN FORECAST PER LEG -FCYM ... 55
FIGURE 13: Y-CLASS MEAN ABSOLUTE DEVIATION - FCYM ... 56
FIGURE 14: Y -C LASS M EAN B IAS -FCYM ... 57
FIGURE 15: REVENUE GAINS UNDER DAVN-FIRST CHOICE ONLY CHOICE, SINGLE PATH/MARKET, M O N O PO L Y ... 5 8 FIGURE 16: REVENUE GAINS BY FARE CLASS UNDER DAVN ... 59
FIGURE 17: Y-CLASS MEAN FORECAST PER PATH -DAVN... 60
FIGURE 18: Y-CLASS MEAN ABSOLUTE DEVIATION PER PATH -DAVN ... 61
FIGURE 19: Y -CLASS M EAN BIAS PER PATH -DAVN ... 62
FIGURE 20: REVENUE GAINS UNDER FCYM -SINGLE PATH/MARKET, MONOPOLY WITH SELLUP ALLOWED 64 FIGURE 21: REVENUE GAINS BY CATEGORY UNDER FCYM ... 65
FIGURE 22: REVENUE BY FARE CLASS UNDER FCYM ... 66
FIGURE 23: FARE CLASS PROFILE OF FIRST CHOICE REVENUE UNDER FCYM... 67
FIGURE 24: M EAN FORECAST PER LEG -FCYM ... 67
FIGURE 25: MEAN ABSOLUTE DEVIATION UNDER FYCM... 68
FIGURE 26: M EAN BIAS UNDER FCYM ... 68
FIGURE 27: REVENUE CHANGE W.R.T. PUBC BASE UNDER DAVN ... 70
FIGURE 28: REVENUE BREAKDOWN BY CATEGORY UNDER DAVN ... 70
FIGURE 29: FARE CLASS PROFILE UNDER DAVN ... 71
FIGURE 30: Y-CLASS MEAN FORECAST PER PATH UNDER DAVN... 72
FIGURE 31: Y-CLASS MEAN ABSOLUTE DEVIATION UNDER DAVN... 73
FIGURE 32: Y-CLASS M EAN BIAS UNDER DAVN ... 73
FIGURE 33: REVENUE GAIN OVER PUBC UNDER FCYM ... 75
FIGURE 34: FARE CLASS PROFILE UNDER FCYM ... 76
FIGURE 35: Y-CLASS MEAN FORECAST PER LEG UNDER FCYM ... 77
FIGURE 36: Y-CLASS MEAN ABSOLUTE DEVIATION UNDER FCYM ... 78
FIGURE 37: Y-CLASS M EAN BIAS UNDER FCYM ... 78
FIGURE 38: REVENUE GAIN OVER PUBC UNDER DAVN ... 79
FIGURE 39: Y-CLASS MEAN ABSOLUTE DEVIATION UNDER DAVN... 80
FIGURE 40: REVENUE GAIN OVER PUBC UNDER FCYM... 81
FIGURE 41: REVENUE BREAKDOWN BY CATEGORY UNDER FCYM ... 82
FIGURE 42: Y-CLASS MEAN FORECAST PER LEG UNDER FCYM ... 83
FIGURE 43: Y-CLASS MEAN ABSOLUTE DEVIATION UNDER FCYM... 83
FIGURE 44: Y-CLASS M EAN BIAS UNDER FCYM ... 84
FIGURE 45: REVENUE GAIN OVER PUBC UNDER DAVN ... 85
Demand Forecasting Accuracy in Airline Revenue Management
FIGURE 47: FIRST CHOICE REVENUE FARE PROFILE UNDER DAVN ... 87
FIGURE 48: Y-CLASS MEAN ABSOLUTE DEVIATION UNDER DAVN... 87
FIGURE 49: PATH-BASED FORECAST RESULTS COMPARED WITH PUBC+LEG-BASED FORECAST ... 91
FIGURE 50: LEG-BASED FUTURE PROTECT MULTIPLIER RESULTS COMPARED WITH PUBC+LEG-BASED
F O R E C A ST ... 9 1 FIGURE 51: PATH-BASED FUTURE PROTECT MULTIPLIER RESULTS COMPARED WITH PUBC+LEG-BASED
F O R E C A ST ... 9 2 FIGURE 52: PATH-BASED FORECAST RESULTS COMPARED WITH PUBC+LEG-BASED FORECAST ... 93
FIGURE 53: LEG-BASED FUTURE PROTECT MULTIPLIER RESULTS COMPARED WITH PUBC+LEG-BASED F O R E C A ST ... 9 3 FIGURE 54: PATH-BASED FUTURE PROTECT MULTIPLIER RESULTS COMPARED WITH PUBC+LEG-BASED
F O R E C A ST ... 9 4
FIGURE 55: PATH-BASED FORECAST RESULTS COMPARED WITH PUBC+LEG-BASED FORECAST ... 95 FIGURE 56: LEG-BASED FUTURE PROTECT MULTIPLIER RESULTS COMPARED WITH PUBC+LEG-BASED
F O R E C A ST ... 9 5
FIGURE 57: PATH-BASED FUTURE PROTECT MULTIPLIER RESULTS COMPARED WITH PUBC+LEG-BASED F O R E C A ST ... 9 6
FIGURE 58: PATH-BASED FORECAST RESULTS COMPARED WITH PUBC+LEG-BASED FORECAST ... 96 FIGURE 59: LEG-BASED FUTURE PROTECT MULTIPLIER RESULTS COMPARED WITH PUBC+LEG-BASED
F O R E C A ST ... 9 7 FIGURE 60: PATH-BASED FUTURE PROTECT MULTIPLIER RESULTS COMPARED WITH PUBC+LEG-BASED
F O R E C A ST ... 9 7
FIGURE 61: REVENUE SOURCE COMPARISON OF PATH-BASED FUTURE PROTECT WITH FORECAST
M U LT IPLIC A T IO N ... 9 8 FIGURE 62: COMPETITIVE NETWORK D WITH BASIC COMPETITOR-AIRLINE A REVENUE RESULTS... 99 FIGURE 63: COMPETITIVE NETWORK D WITH SMART COMPETITOR-AIRLINE A REVENUE RESULTS ... 100
Demand Forecasting Accuracy in Airline Revenue Management
Chapter 1: Introduction
Demand Forecasting Accuracy in Airline
Revenue Management:
Analysis of Practical Issues with Forecast Error Reduction
Motivation
Airline Revenue Management strives to sell seats to passenger at a fare that approximates their maximum willingness to pay. This is the same economic principle of price
differentiation which refers to some theoretical maximum possible revenue derived by charging a different price to every consumer according to the value of product/service to them or alternatively charging passengers their maximum willingness to pay (WTP). In practice however such price differentiation is impossible to achieve and therefore airlines offer a stratified fare structure and group their seats under these different fares.
The revenue management problem thus essentially becomes one of correctly defining these different fares, the pricing part, and accurately allocating seats under these different fares, the seat inventory control part. In the real world, even though the fares are regularly updated however they are comparably static and it is the seat inventory control that gets the limelight in revenue management systems. The revenue management thus essentially becomes allocation of seats to a specific fare class with its associated restrictions - which for profit maximisation becomes protection of reasonable number of seats for higher-fare classes that traditionally book closer to departure at the same time ensuring the aircraft is adequately full by selling otherwise empty seats at lower-fares.
Since the higher-fare paying passengers traditionally book closer to departure date, airlines have to estimate the number of seats to reserve for them as well as figure out how
Demand Forecasting Accuracy in Airline Revenue Management
many seats to offer to lower-fare, early-booking passengers. If the airline reserves too few seats for higher-fare classes, it will tend to turn away that demand when it arrives closer to departure date and thus lose revenue. On the other hand if it reserves too many seats, it runs the risk of flying empty seats since it will already have turned away the early-booking, lower-fare paying passengers. It is in this context that reservation forecasting assumes a highly important role.
As is apparent from the nature of the problem, the revenue management problem is a juggling act between trying to minimise lost revenue through turning away late demand as well as minimising "spoilage" by flying substantially empty aircraft. This very nature dictates that in theory there is a maximum revenue figure that can be achieved with accurate forecasts, and inaccurate forecasts result in negative deviations from this maximum attainable revenue. Thus minimising and even eliminating forecasting errors has become a subject of prime import in revenue management.
In principle, measuring forecast accuracy is a simple enough concept. It requires comparing the forecasted figures against actual figures. There are various traditional measures of forecasting accuracy from the basic forecast bias that directly compares
forecast with actual to mean squared percentage error that is based on proportional errors. Each of these measures is geared toward a particular type of relationship between
forecast error and its corresponding opportunity cost.
Historically, the efforts at determining the airline reservation forecasting accuracy have focused on these traditional measures. Initially the booking data available through airline's historical database was directly compared with the forecasts. This process however ignores detruncation, a fact arising out of the inherent inability of the databases
to capture demand (as opposed to bookings). The airline databases only record the number of bookings made for the flight in question, ignoring the number of passengers who were denied bookings in the class of their first choice as it reached its determined booking limit. These passengers then either did not travel or travelled subsequently in a higher fare class, on another flight, or went to competitors. Thus airline booking data is under representative of the market demand and requires unconstraining or detruncation to
Demand Forecasting Accuracy in Airline Revenue Management
reflect the higher existent demand. This is required as the forecasting is done for unconstrained demand. Later studies have tried to redress this issue by either unconstraining the recorded bookings before comparison or using data that does not include any constrained bookings.
However, the issue in measurement of airline reservation forecasting error is much more fundamental than these problems with comparison of like quantities. It is the
impossibility of determination of actual demand data to enable comparison. As
highlighted above the booking data in any airline's database is not the representative of true demand. The actual bookings that are recorded by the airline are a product of numerous factors that include the booking limits imposed by the revenue management system, the status of booking in not only requested class but other fare classes not only on the same flight but on other flights in airlines network and even competitor flights in the same market.
The added complication is due to the iterative nature of the airline reservation process. The booking data from one iteration for a particular time interval before the departure is used in forecasting demand for the remaining time intervals. Thus a forecast in airline revenue management is state dependent, which simply implies that it is dependent on the state of the system at the moment. Another issue arises from one of the basic assumption of demand forecasting i.e. leg-class/ path-class independence. This basically means that airlines forecast demand for a particular fare class on a particular flight leg or a path and assume this to be independent of other fare classes. In actuality the closure of lower fare classes results in some passengers paying higher fare on the same leg/ path (sell-up) and some passengers drifting to other airlines (spill). Thus this independence assumption does not hold true in reality. Airlines in practice can not even determine what the actual total market demands is, a far simpler proposition compared to the detailed fare class demand on a single leg or path required by the revenue management system.
It is this limiting factor that makes the traditional quest for zero forecast error a dubious undertaking. Employing traditional measures of forecast accuracy in consort with some arbitrary measure of actual does not respect the conventional belief of error-revenue
Demand Forecasting Accuracy in Airline Revenue Management
relationship. This makes the study of issues surrounding forecasting accuracy a subject of utmost importance and impact. It is entirely possible that "inaccurate" forecasting
methods might give better revenue performance than so-called "accurate" methods. It is also possible to manipulate forecast generated by traditional methods to encourage better revenue performance which translates into erosion of accuracy performance.
Objectives
In light of the issues discussed, the primary approach of this thesis is to measure forecast accuracy using traditional measures under different forecasting/detruncation combination in a simulated airline network under PODS - the Passenger Origin-Destination Simulator.
A combination of different seat allocation optimization algorithms will also be used to
observe accuracy under different conditions. These measures will be compared vis-ai-vis the corresponding revenue performance of these combinations. This comparison will be used to highlight the fact that the conventional belief of accuracy-revenue relationship does not hold true in practice. In fact it is entirely plausible for highly inaccurate forecasting/detruncation combinations to outperform their more accurate counterparts. Thus the primary goal of this thesis is to establish the fact that the term "forecast accuracy" has an entirely different connotation in the context of airline revenue management; distinct from other forms of business. It is impossible to measure actual
demand for use as basis for comparison. To further reinforce this result, some arbitrary forecast manipulation techniques will be used on top of the traditional forecasting methods. A similar comparison will highlight the fact that higher "inaccuracy" does not
translate into worse revenue performance rather these inaccurate forecasts result in higher revenues.
To gain insight in to the revenue-accuracy relationship, similar analysis will be conducted in a monopoly network to validate the above results. These results will show that even in absence of competitive effects the traditional accuracy-revenue relationship does not hold and inaccurate forecast methods continue to do better.
Demand Forecasting Accuracy in Airline Revenue Management
As a secondary objective, the superior revenue performance of these arbitrary forecast manipulation methods will be analysed in detail. These methods have shown revenue potential under leg-based revenue management method. The analysis will focus on the difference between leg-based and path-based revenue management methods to ascertain the underlying reasons for this revenue potential, thereby suggesting more methodical ways to improve revenue performance.
Demand Forecasting Accuracy in Airline Revenue Management
Chapter 2: Theory
Forecast Accuracy: Issue Definition and
Literature Review
Defining Issues Related to Concept of Accuracy in Historical Context
Revenue Management Basics
Revenue management represents the concentrated effort by airlines to maximise their revenues and has been the subject of research for past few decades.
The revenue management problem is essentially addressed by two means, a) by offering several fare products on a single flight, each with different set of restrictions targeted to match its intended passenger base (pricing) and b) by using a seat optimization algorithm that appropriately limits the seats available to lower-fare classes (inventory control). Today, revenue management mainly revolves around optimizing the seat allocation process, which has led to new forecasting techniques as well as a number of seat allocation algorithms.
The Seat Inventory Control Process
The revenue management process is an iterative process made up of various steps. It can be illustrated through a simplified flowchart, from Skwarek (1997) as shown in Figure 1.
Demand Forecasting Accuracy in Airline Revenue Management
Figure 1: Seat Inventory Control Process
Construction of a fare structure and changes to existing fare structure are performed less often than the seat inventory control process and therefore emphasis is on the latter process.
The historical database (HDB) contains the data from all previous departures of interest. This data is used to estimate the forecasting parameters as employed in the forecasting process.
Forecasting by fare class is the next important step. The pertinent data in historical database is first selected. The selection process might involve exclusion of previous flights that can constitute outliers in the data set and show unusual demand behaviour. This data prior to being used in forecasting is detruncated if it has been constrained by booking limits, since seat-optimisation algorithms require detruncated demand forecasts. This data then goes into forecaster. There are various forecasting methods that will be explained in later sections.
The resultant forecast is input to the seat optimization algorithms which also take as input fare values by class and come up with booking limits on each fare class that maximise expected revenues. The information about No Shows, Denied Bookings, output of seat optimizers and airline's opportunity cost calculations are used by an overbooking model to set booking limits by fare class.
Demand Forecasting Accuracy in Airline Revenue Management
Once the adjusted booking limits for fare class are made available, the passenger booking process starts where reservations and cancellations from passengers are considered. These steps are repeated over booking intervals and continue till the flight departure day. On departure day the information about No Shows and Denied Boarding and final loads is recorded in the Historical Database and the whole process repeats itself.
Need for Forecasts
A forecast is defined as "a quantitative estimate (or a set of estimated) about the
likelihood of future events which is developed on the basis of past and current
information".1 As highlighted above, forecasting forms the backbone of the entire seat inventory control process and is thus integral to revenue management. The revenue management problem boils down to being able to predict in advance how many seats to protect for late-booking, higher-fare paying passengers, while at the same time selling
enough seats to early-booking, lower-fare paying passengers to ensure minimum spoilage and healthy load factors.
The seat optimisation algorithms require forecast by fare class for every iteration of inventory control process in order to determine how many seats to protect for each fare class. Thus the forecasting of passenger demands by flight, date and fare class, also known as micro-level forecasting, is a basic requirement. This demand can be forecasted at many different levels, for example on a flight leg level, on a fare class level, or on an Origin-Destination Fare level.
Need for Accurate Forecasts
Intuitively we would expect forecasts to have a very strong bearing on revenues, as "better" or "accurate" forecasts seem to suggest that they would lead to higher revenues. Curry2, in his technical brief showed the results of forecasting impact on revenue using Monte Carlo Simulations. Under each set of different conditions, the percent revenue achieved was computed; defined as the revenue achieved with forecast error divided by
'Pindyck, Robert S. & Rubenfeld, D. (1998)
Demand Forecasting Accuracy in Airline Revenue Management
the revenue that could have been achieved with full knowledge of demand3. This resulted
in the following asymmetric curves, shown in 4Figure 2.
C) Pa) 100 90 80 -20 -15 -10 -5 0 Forecast Error 5 10 15 High Demand Low Demand
Figure 2: Forecast Error-Revenue Relationship
This appears to follow our intuition. At lower demands, forecast errors have less impact on revenue as there are fewer inventory restrictions, regardless of the forecast. However at higher demand levels, forecast errors can have significant impact on revenues
achieved.
Too high a forecast leads to increased revenue loss with overprotection, as too many seats would be protected for higher-fare paying passengers that will ultimately go empty
(spoilage). In contrast, under-protection will see the seats filled up by more lower-fare
paying passengers at the cost of denying seats to higher-fare paying passengers.
20
3 Wickham, Robert R. (1995)
Demand Forecasting Accuracy in Airline Revenue Management
Lee5 in his thesis also made a similar analysis of revenue impact of forecast errors and his
results also followed the general parabolic shape depicted above.
It should be noted that the above results are strongly dependent on the assumption that fare class demands are independent from each other. In reality a passenger denied a seat in lower fare class might sell-up to a higher fare class. Also in a networked environment with other airlines present, there is always a possibility of passenger spill-ins from other carriers. These considerations will lead to an asymmetric shape of the revenue-error parabolic curve.
Review of Forecast Accuracy Studies
This section will focus on reviewing salient works among the literature available on airline forecasting techniques and the comparative studies undertaken between various forecasting models.
Revenue Management Forecasting Models
The forecasting models can be grouped according to the data employed.6
* Historical Bookings Model: These models are based on booking data available in
historical data base (HDB). This data is used as input to predict the increase in bookings on the current flight in the period from forecast interval to flight departure. These models are based on the assumptions that booking patterns for future flight departures are similar to the historical flights in the database.
* Advance Bookings Model: In these models, Bookings-in-hand (BIH) data from the
future flight is used as input to predict the bookings to come from forecast interval to flight departure.
5Lee, Anthony 0. (1990)
Demand Forecasting Accuracy in Airline Revenue Management
* Combined Bookings Model: These models employ both data from HDB and BIH
data of current flight to predict the bookings to come on the current flight for the period from forecast interval to flight departure.
Note that only the data used as input to predict the bookings increase is the basis for this grouping of models.
Categorisation of Revenue Management Forecasting Models
Historical Bookings Models
Scandinavian Airlines in 19787, proposed a basic model that employed arithmetic mean of historical bookings at the end of booking process, calculated over selected departures in the HDB. The same paper also highlights the amount of data necessary for "accurate" forecasting and how to remove outlier data points.
In a closely related work, Ducanson suggested exponential smoothing to weight the most recent departures more in calculating the average, since it realistically represented the current trend.
Wickham9, in his 1995 thesis, offered a formal version of the above mentioned models. His versions were based on fare classes. They are represented by the following equations:
Simple:AI Sml:BIH (0), = -. I BIH (0),
-fM -t , -fM
f-t a
f-Exponential: BIH (0)f = .BIH(0)j.s.t. Zcax =1,afM <...< aj_,
i=f- M -t i=f-M
where BIH (O)f is final bookings on day 0 of the flightf being forecast
M is the number of flights considered in the forecast plus the
number of flights leaving beforef but not yet departed
7 SAS (1978) 8 Ducanson (1974)
Demand Forecasting Accuracy in Airline Revenue Management
t is the number of booking interval from which the prediction is
being made
Sa in 199710 proposed another historical bookings model using Box-Jenkins ARIMA (Auto-Regressive, Integrated Moving Average) model. This he calibrated for a single fare-class on a particular flight. However since his results showed high standard errors due to variability of data, he subsequently changed his approach.
Another variation of Historical Booking Models is the "pickup" or "historical moving average" method models. These are based on estimation of average increase in bookings from subject interval to flight departure using selected flights from HDB. Another variation, the "advanced pickup" model, developed by L'Heureux" of Canadian Pacific Airlines, uses more recent information from soon to depart flights that have as yet incomplete booking histories. This was done to increase response to variation in demand much more quickly.
The classical pickup models have the following equations 12
Equal Weighting: BIH ( f. fM-t 1 I (BIH (O), - BIH (t),) + BIH (t )f
i=f-M
Exponential Weighting:
f-t a f-t
BIH (O)f = I .(BIH(O), -BIH(t),)+ BIH(t)f .s.t. J ai =1,af- <...< a
i=f-M M -t i=f-AM
The advanced pickup model has the following equation":
f-t f-t+1
AJBIH (0), -BIH (1),)+ J (BIH (1),- BIH (2), )+...
BIH (0) = + BIH (t)
... + J (BIH (t -1) -BIH (t)i) i=f -M+t
10 Sa, Joao (1987)
" L'Heureux, Ed (1986)
12 Skwarek, Daniel K. (1997) " Ed L'Heureux (1986)
Demand Forecasting Accuracy in Airline Revenue Management
Advance Bookings Models
Early work on advanced booking models was taken up by Harris and Marucci of Alitalia. They developed a simple model that provided aggregate booking forecasts for groups of selected flights. The method employed using two data sets, one a snapshot at different intervals of time for the subject flights and the second included total booking on all flights for a 45 day period. This aggregation level limited the usefulness of this model to the forecasting problem under study since specificity and sensitivity to variation in individual flights is lost.
Lee provided a modified regression model that was based on three groups of terms. First group included terms for bookings-in-hand for the subject flight, second group included terms to cater for external causal factors and the third group accounted for random error. However this model was neither calibrated nor external factors specified. Wickham proposed a reduced version of Lee's model, using only Bookings-in-hand data at departure and at time interval of interest from HDB flights and then using the equation with current booking history of subject flight to predict final loads. This non-causal regression model is given by the following equation:
BIH (O)= > i x BIH(i)f + g x W(f,i) + v(f,i)
i-N
where 9, are the coefficients on BIH in previous time periods
g is a vector of coefficients on exogenous factors
W is a vector of exogenous factors v is a random error term
Lee1 6 also proposed another advance bookings model that regarded booking process as a
Poisson process, distributed with certain probability of booking request/cancellation in a specified period. He thus developed a censored Poisson model incorporating detruncation as well. This model assumes a constant probability for booking request, cancellation as well as constant booking limits within the forecasting interval. This was a very complex
14 Lee, Anthony 0. (1990)
"5 Wickham, Robert R. (1995)
Demand Forecasting Accuracy in Airline Revenue Management
model limited by its practical application. The first issue was that the model was very computationally intensive requiring Maximum Likelihood estimation of two variables for every flight, between every interval. It is not possible to decrease the number of intervals as the assumption of constant request and cancellation probabilities and constant booking limit will not hold. The second issue was that the assumption about arrival, cancellation rates and booking limit was unrealistic. Since Lee adopts three intervals, he assumes booking curve and cumulative cancellation probability to be linear with kinks at the intervals. Lee has defined booking limit as 'maximum bookings in a fare class" which does not remain constant within an interval due to nested nature of fare classes. In order to fulfil the Poisson requirement of this number being constant, intervals will need to be reduced further increasing computing requirements.
Combined Historical and Advance Bookings
Sa", in his same paper, used calibrated causal regression models that employed both HDB data as well BIH data from the subject flight. This effort was more successful than his ARIMA approach.
Ben Akiva 1 8 also suggested a forecasting model by flight and fare class. This model
combined a non-causative regression model with a time-series model. The regression model employed advance bookings data and time-series model employed HDB information. The analysis was done on a monthly basis and no validation tests were carried out to check forecasting ability on individual future flights.
Lee, also suggest a non-causal, "full-information" model that combined appropriately weighted final bookings information from HDB flights, BIH for current time interval from flights yet to depart and BIH information from the subject flight. This gives weight to recent flight data that reflects recent changes in demand. This model also combined detruncation and forecasting in a recursive substitution method. However his treatment makes this approach computationally intensive.
"7 Sa, Joao (1987)
Demand Forecasting Accuracy in Airline Revenue Management
An alternative computationally "efficient" forecaster has been proposed by Hopperstad19 which uses all available booking information but does not utilise the computationally intensive maximum likelihood estimation. This is similar to Lee's approach as it
combines the forecaster and detruncator in a single model and L'Heureux's work in using all available booking information.
Review of Comparative Assessment Studies
This section deals with the review of various studies undertaken to compare forecasting performance of various methods against each other. The various models have usually been compared on basis of forecasting "accuracy" employing traditional measures of forecast error.
20
Sa2, in his thesis, compared ARIMA time-series models versus regression models. These models were employed for short-term forecasting and the comparison was based on goodness-of-fit tests. The bookings data was taken from ten markets. He dismissed ARIMA models on basis of their poor performance in one fare class on one of these ten markets. Regression models were also estimated for all of these markets and they differed in overall model fit and statistical significance of coefficients. No tests were done by forecasting using a different data set. Also no information was provided about time-series fit on the remaining nine markets. This comparative testing was very data specific and thus has limited applicability in terms of deciding the relative performance of models that were tested.
Ben-Akiva2 1 used a combined model with an ARIMA time-series component and a
regression component, as mentioned earlier. The correlation coefficients between the predicted and actual observations declined when the two components were run separately. In relative terms, regression model fit the data better than time-series. There were no tests done using a different data set. The data used was monthly. Also no consideration was given to effect of booking limits on demand. The fare classes were aggregated as well.
19 Hopperstad, Craig (1991)
2 Sa, Joao (1987)
Demand Forecasting Accuracy in Airline Revenue Management
These limitations translate into limited applicability of this analysis where forecasting accuracy for RM systems is concerned.
Wickham's2 was the first study to comprehensively employ the traditional measures of forecast error. He used a historical database with booking history by fare class and day of week. He employed various models including classical and advanced pickup, time-series (both with and without weights) and regression models. He performed these
measurements over various HDB sizes and forecasting periods. He also utilised a simple detruncation method. Based on these tests, he concluded that the Pickup forecasting model outperformed both regression and time-series models. He also showed that increasing the forecasting period improved the performance of advanced pickup model and that advanced pickup was more susceptible to sudden demand shifts. All models invariably over forecasted demand compared to actual booking data detruncated by Wickham's own unconstraining algorithm. This algorithm employed multiplication of constrained data at every time frame by a corresponding fixed unconstraining percentage developed from unconstrained data. This resulted in an under-estimate of "actual
demand", causing forecasts to appear too high. Increasing HDB size was not a significant factor affecting forecasting performance.
Even though Wickham's study is the first complete evaluation based on traditional forecasting measures, there are some considerations. He selected two fare classes from the HDB without considering how this choice will affect the performance of forecasting models. He also aggregated data over 24 markets without consideration of difference in characteristics in terms of stage-length or passenger type.
Lee compared his own censored-Poisson and full-information models with regression and pickup models. He employed a single-market data set with forecasting horizon of two months and the database consisted of nine months of data. The models used three
forecasting intervals generating class-specific forecasts. The models were compared using three measures of accuracy. His results ordered the models in terms of decreasing performance as full-information, censored-Poisson, regression and pickup. Even in 22 Wickham, Robert R. (1995)
Demand Forecasting Accuracy in Airline Revenue Management
expanded tests taking into account several markets and fare-classes showed that these results hold though the differences in performance were small. However his study does not offer answer to the question that use of a computationally intensive, more accurate forecaster for fewer times during the booking process is preferable to more frequent use of less accurate yet less computationally intensive method. The latter method will rapidly take into account the changes during the booking process. No revenue performance comparison was carried out in this regard.
Skwarek was the very first study that discussed the issues surrounding measurement of forecasting performance through traditional measures of accuracy. He correctly identified various factors that make the accuracy measurement an impossibility vis-i-vis airline reservation forecasting. He was the first one to advocate abandoning the use of traditional measures of forecast accuracy in airline forecasting. Instead he argued that revenue performance should be used as the primary platform for comparison among various forecasting methods as zero forecast error is impossible to achieve. He was also the first one to utilise initial Passenger Origin Destination Simulator (PODS)25 versions to simulate single market conditions.
His principal findings indicated that pickup forecasting usually performs at least as well as regression forecasting and significantly better under certain conditions like high demand variability). However under high system-wide demand variability, regression came out superior. His qualified ranking was pickup forecasting first, regression second and efficient forecaster third. He also tested various detruncation methods and concluded that under high variability of demand booking curve detruncation with moderate or
extreme scaling and projection detruncation perform better.
Zickus's26 thesis deals with interaction between forecasting and detruncation methods and seat-optimization algorithms. The thesis expands previous PODS-related research to a network scenario and analyses the effects of different forecasting and detruncation
algorithms in the yield management context. These results are compared with earlier
24 Skwarek, Daniel K. (1997)
25 Hopperstad, C. (1996) 26 Zickus, Jeffrey S. (1998)
Demand Forecasting Accuracy in Airline Revenue Management
revenue management simulations in order to determine the sources of gains from yield management system improvement. It also simulates a realistic competitive scenario with each airline able to vary its choice of seat optimization, forecasting and detruncation method. His thesis highlights the differences among various combinations of forecaster, detruncator and seat optimiser while giving insights into the reasons for performance differences. It also tests the robustness of different RM algorithms.
Zickus's thesis deals only with the relative revenue merits of different forecasting methods namely pickup and regression forecasting. It does not deal with the relative accuracy of these methods. This work, though, provides a good base case as it deals with the effects on system revenue under different forecasting methods in a variety of
competitive scenarios. Furthermore, it explores the compatibility of these forecasting methods with each of the different seat optimizers. It does however raise some very relevant questions especially regarding actual demands.
Forecast Accuracy as a Concept
Forecast Accuracy in general, insofar as achievement of lower errors is considered, is a very valid goal for any revenue management application. However, in the specific field of airline revenue management, accuracy as a concept and reduction of forecast errors as a management goal do not hold similar weight. In order to understand this we need to delve deeper into the basic assumptions of airline reservation forecasting and contrast that with real world passenger behaviour. Also we need to look at the traditional measures of forecasting accuracy and how they are incompatible with the airline revenue management since the choice of base dataset, inherent to all traditional measures, plays a significant role by introducing bias.
Forecasting Assumptions in Airline Revenue Management
In airline seat inventory management, forecasts are generated for demand by fare class level for a given flight. The forecasting methods assume certain properties for this level
Demand Forecasting Accuracy in Airline Revenue Management
of aggregated demand which is also applicable to the historical dataset from which the forecast are made.
The forecasting assumptions for the fare-class level are as follows:
1. Demands are segregated by fare class and are independent from each other
This is the fundamental assumption of forecasting at this level however it does not reflect the real world passenger behaviour. The unrealistic nature of assuming demand segregation by fare class is discussed in further detail in the following section. The assumption of independence among these demands is also fairly naive given the opportunities for sell-up and recapture in an airline's network. Sell-up refers to the opportunity whereby a passenger denied reservation in a particular fare class trades up to higher fare-class on the same flight which is still open to booking. Recapture opportunities a rise due to multiple p ath opportunities b etween the s ame origin-destination cities in a network. Horizontal recapture occurs when the same passenger decides to book a seat in the same fare-class on another flight in the airline's network. Vertical recapture represents the situation where the same passenger books in a higher-fare class on another flight in the network.
With a competitive network with multiple carriers, opportunities for in and spill-out arise whereby the same passenger decides to travel on another carrier, either in the same or higher-fare class and vice versa situation where passengers from other carriers who are denied their first choice, book with the subject airline. All these situations effectively invalidate to the mutual independence assumption of fare-class demand.
2. Demands by fare class are not constrained by the booking limits
Forecasting is distinct from detruncation and this assumption is pivotal to unbiasedness of any forecaster. The forecaster, in general, assumes that the input data is unconstrained in order to output an unbiased forecast for use by optimizer.
The forecaster employs dataset containing observations from both previous flights (courtesy of Historical DataBase) and current flight's booking. If the data from HDB is constrained, it will invariably lead to lower forecasts. The lower forecasts will
Demand Forecasting Accuracy in Airline Revenue Management
cause 1 ower b ooking limits o n h igher f are classes, m aking m ore s eats a vailable t o lower-value, early-booking passengers, ultimately resulting in lower revenues.
The assumption that demand by fare class is not constrained by booking limit is also valid for the current flight's booking data. This assumption does not introduce any distortion as the seat optimizer determines the number of seats to offer to a particular fare class. In situations where a fare class is being constrained, it will lower the booking limit for low-value fare classes.
3. Demands are normally distributed
In order to detruncate (unconstrain) and forecast, it is necessary to assume a distribution for passenger demand. The detruncators use this distribution to extrapolate demand from constrained data set and forecasters utilise parameters estimated from the same assumed distribution. However, this distribution is censored at the booking limit, and at the same time is truncated at zero (for there are no negative bookings). Empirical reservation pattern analysis2 7 shows that normal
demand distribution pattern holds for moderate demand level. Positive skewness is associated with low-demand levels and a 'spike' at capacity level associated with high-demand levels. Thus this assumption seems to be conveniently reasonable for medium demand and is followed in all seat inventory control processes. A subsequent, yet small, empirical study 28hints at presence of natural skewness in the underlying demand, suggesting a lognormal distribution instead of normal. Lee in his thesis29 argues for Poisson distribution. American Airlines' analysis suggests a gamma distribution for underlying demand. There are trade-offs involved, however, between these distribution assumptions. Normal distribution is computationally simple in situations with moderate censoring and truncation and is most commonly used.
4. Cancellation rates are similar between Historical Database and forecast flights A forecaster employs gross measures of booking from HDB (which include
reservations that are later cancelled) to predict final bookings-in-hand which is a net
27 Belobaba, Peter P. (1985) 28 Brummer, Mark et. al. (1988) 29 Lee, Anthony 0. (1990)
Demand Forecasting Accuracy in Airline Revenue Management
measure (since cancellations can not occur after close of booking period). The distortion in forecast is avoided by assuming same gross/net relationship, in terms of cancellations, occurs on the predicted flightf as on the flights in HDB. The forecaster thus predicts a certain proportion of cancellations for the forecast flight on the basis of prior demand. Prediction of higher cancellation than actual causes less final bookings and vice versa.
Contrast with Real World Passenger Behaviour
An airline's pricing structure is composed of fare products employing elements of both differential and discriminatory pricing. The aim is to distribute demand into several fare classes. However the fare products result in imperfect segmentation with the result that each fare class is not composed of homogenous type of passengers. Rather these passengers opting for a particular fare product will switch to other fare classes if their first choice fare is not available.
Thus demand for a fare class is not independent of demand in other fare classes. It is defined only with respect to and situated within the particular suite of other fare products offered in the market, by the same and competing airlines. In reality, demand occurs as demand by passenger type which is fairly independent rather than demand by fare-class as the characteristics differ considerably. However even by type, interdependencies exist.
If we consider Time and Price Sensitivity to be the two prime determinant of passenger
type, we can define following four types of passengers (Refer to Figure 3):
" Type I: Time-sensitive and price-insensitive
* Type II: Time-sensitive and price-sensitive
" Type III: Time-insensitive and price-sensitive
Demand Forecasting Accuracy in Airline Revenue Management
Low Price Sensitivity p High
High
I
II
IV
III
Low
Figure 3: Market Demand Segmentation Modef
Whereas Type I passengers are most influenced by service variables, like frequency and in-flight amenities etc.; Type II passengers consider price to be of prime importance in their decision. However both Type I and Type II passengers are sensitive to frequency and related service variables while differing in their price sensitivity.
In practice, this disparity between the assumption of independence and real-world
behaviour needs to be recognised and adjusted for in the forecasting and seat optimisation steps. Another important consideration is the context of fare products in the historical database and forecast period. If the fare product changes between the two periods then it requires further adjustment to the historical data base.
Adjustment for independence of demand is further exacerbated by passenger behaviour under constrained situations - where reservations reach booking capacity. Under the independence assumption, the denied lower-fare passengers do not travel upon denial, whereas in reality they either sell-up, are recaptured on other flights or spilled onto other carriers.
Demand Forecasting Accuracy in Airline Revenue Management
Issues of Inherent Bias due to Choice of Base
In previous sections, the focus has been on the arbitrary nature of the concept of forecast accuracy due to the fallibility of the basic assumptions of forecasting that lead to
incorrect forecasts. The current section deals with the equally important issue of the difficulty in choice of a "base" or "actual" demand in employing traditional measures of forecast error. This exposes the inapplicability of these traditional measures of error to airline reservation forecasting.
Definition of Inherent Bias
The main issue arising in comparative assessment of alternative forecasting methods based on error metrics is what base to use in measurement of error. Depending on the base used in error definition, the existence of constrained observations in the dataset and the forecaster used, inherent forecast biases will be present (Refer to Figure 4).
Figure 4: Inherent Biases in Measurement of Forecast Error3 1
Demand Forecasting Accuracy in Airline Revenue Management
Bias exists when the summed difference between predicted and actual bookings over all flights being forecasts is not equal to zero. Failure to eliminate inherent biases mixes the ranking of forecasters as the observed differences can be due to construction of the
experiment as to inherent performance differences.
Skwarek (1997) has listed various types of analysis and the resulting biases. In a Type I analysis that utilises a constrained data set and a constrained error measurement, the bias is uncertain as it varies from forecaster to forecaster on their treatment of constrained observations. Most comparative studies of forecasting have been of this type.
For Type II analysis, an unconstrained data set is used in combination with a constrained base. This will invariably result in a positive inherent bias. Wickham's study involves this
type of forecast error where all forecasters displayed positive bias.
In Type III, the dataset includes flights with constrained data points, but final booking data is unconstrained by some method. This will result in negative bias in contrast to Type II error.
Finally, Type IV error analysis involves a dataset which is unconstrained and a base for the measure of forecast error which employs similar unconstraining procedure. This type of analysis has been rarely performed. Forecast errors calculated under these conditions can be theoretically considered free of induced bias. However, there are still two major sources of bias unaccounted for.
One is the systematic bias in the detruncation procedure itself. This will affect the forecast error calculations, as the base unconstrained bookings on which forecast error is calculated must be estimated via detruncation for every closed flight. Thus a Type IV analysis will only be truly unbiased if detruncation method is unbiased or the there are no constrained observations in the dataset. In the latter case, however all analyses types will have no bias.
The other important source of bias is when the detruncation scheme between calculating base for forecast error and unconstraining historical dataset for forecasting are different. In this case the forecaster/detruncation combination using a different detruncation
Demand Forecasting Accuracy in Airline Revenue Management
methodology than the base, will suffer from an inherent bias differential from the combination that employs same detruncation scheme as the base.
Is Zero Forecast Error Possible or Desirable?
From the above discussion of limitations of forecasting assumptions and inherent biases arising out of analyses, it appears that under some ideal circumstances where these issues are appropriately accounted for, zero forecast error is achievable. Also since intuitively forecast error is related to revenue performance, zero forecast error will result in
maximum revenue performance. However even if definitional issues about forecast error as mentioned above are somehow resolved, the achievement of zero forecast in actuality is nearly impossible. 32The problem remains with the assumption that an input with zero
forecast error will result in flight loads that exactly stick with "zero error" predictions and thus maximise revenue.
Skwarek (1997) has presented the following example that helps explain this. Consider that a constrained flightf departs and the airline is certain that passengers on the nextf+1 departure of the same flight will have exactly similar demand characteristics. After
detruncation, the airline inputs the expected unconstrained bookings as its forecast for the
f+1
departure, based on constrained bookings from departuref Even then this "zero error" forecast will not result in a "zero error" result, with passenger reservations materialising as predicted.As the seat optimiser will adjust optimal seat booking limits to these inputs causing different class closures, sell-up and/or lost passengers and thus a different resultant constrained booking pattern than departuref will be observed. The associated
unconstrained booking level for thisf+1 departure will also be different and as a result there will be a non-zero forecast error.
Only in conditions where either there is low-demand resulting in no fare-class being constrained or each passenger being placed according to his/her WTP, is the above not applicable. This again points out to the arbitrary nature of passenger demand by fare class
Demand Forecasting Accuracy in Airline Revenue Management
as only in these two limited conditions described above, a perfect mapping between passenger type and fare class occurs. Otherwise, observed demands in each fare class are state dependent: a result of the time in the booking class that lower-fare classes close and the segmentation ability of each fare class.
Thus the conventional managerial emphasis on lowering forecast errors and comparing forecasters' performance through traditional measures is somewhat misguided.
Detruncation
Detruncation, unconstraining or uncensoring a distribution refers to the process of estimating parameters of a distribution based on a sample from which some values have been removed or censored3 3. In the airline case this refers to the process of estimating the
unconstrained demand, in the event that bookings-in-hand reach the booking limit for a fare class. This particular fare-class is marked closed and all further requests will be refused till it becomes open again due to cancellations etc. As soon as requests are refused, it becomes almost impossible to infer the actual demand directly from the bookings data and thus the need for detruncation.
The Need for Detruncation
Theoretically speaking, not detruncating such constrained data can have severe revenue consequences for the airline. If a forecaster under predicts demand for higher-value fare classes as a result of not unconstraining the demand, then more low-value passengers will be accepted and later-booking higher-value passengers will have to be turned away. This result then becomes part of historical database for future flights, depressing further the value fare class forecasts. This yield dilution becomes extreme as bookings of high-value fare class passengers spirals iteratively downwards, replaced by the low-fare paying passengers.
Demand Forecasting Accuracy in Airline Revenue Management
Entwined Nature of Detruncation and Forecasting
Detruncation and Forecasting are closely linked as both contribute to generate demand forecast. However, detruncation is applied earlier in the process of generating a demand. Detruncation unconstrained demand whereas forecasting consists of getting an estimated of future demand, given previous demand, including the previously estimated
unconstrained demand. Both these are essential to reliable forecasting.
The seat optimiser routines generate booking limits on unconstrained demand and in turn require unconstrained demand forecasts as input. As discusses in previous sections, unconstrained historical dataset as input to forecaster results in reliable forecasts and thus detruncation is essential to forecasting.
Review of Previous Forecast Accuracy Studies in context of
Detruncation
As briefly mentioned in previous sections, the majority of comparative studies on
forecasters have ignored detruncation both for historical database as well as actual dataset for error measurement. In this most of the studies assumed that their datasets are
unconstrained.
Wickham34 in his thesis has discussed extensively the comparison of several forecasting models with and without a detruncated dataset. He developed his own detruncation algorithm in this regard that has been described in a previous section. His salient findings were:
* Detruncation had no significant effect on higher booking classes.
* Detruncation decreased the spread of performance metrics among the forecasting models that were tested.
* Some performance metrics even improved after detruncation was used