Development of Software Architecture for Environmental Monitoring Using Wireless Sensor Networks
Piyush Hari
B .Tech. , Civil Engineering
Indian Institute of Technology, Roorkee, 2004
SUBMITTED TO THE DEPARTMENT OF CIVIL AND ENVIRONMENTAL ENGINEERING IN PARTIAL FULFILLMENT OF THE REQUIREMENTS FOR THE
DEGREE OF MASTER OF SCIENCE
AT THE
MASSACHUSETTS INSTITUTE OF TECHNOLOGY
'
8
OF TECHNOLOGY
JUNE 2006
02006 Piyush Hari. All rights reserved.
LIBRARIES
I
i The author hereby grants MIT permission to reproduce and to distribute publicly paper and electronic copies of this thesis document in whole or in part in any medium
now known or hereafter created.
Singature of Author:
~ e m e b i o f Civil and Environmental Engineering May 12,2006
Certified by:
-
John R. Williams of Civil and Environmental Engineering*. Thesis Supervisor w -- -1 Accepted by: Andrew J. Whittle Chairman, Departmental Committee for Graduate Students
Development of Software Architecture for Environmental Monitoring Using Wireless Sensor Networks
by Piyush Hari
Submitted to the Department of Civil and
Environmental Engineering on May 12, 2006 in Partial Fulfillment of the Requirements for the Degree of
Master of Science
ABSTRACT
In this thesis, I describe the development of the software architecture for temperature monitoring using Wireless Sensor Networks (WSN). The goal of the software is to provide a means to remotely monitor and analyze temperature data in a closed environment. This architecture forms a building block to achieve the larger aim of energy management in built facilities. A 16 node wireless sensor network was set up to monitor ambient temperature at various locations in MIT. A console application was developed in the C# language to collect temporal sensor data and store it in a SQL database. The application also provides a management system for fire hazard warnings by sending e- mails and calling mobile phones. An ASP.NET web application is then developed to retrieve temperature data over Internet. The data is accessible in different formats- table, XML and visualized in graphical forrn. This application lets the user register their phone numbers and e-mails to be informed in case of a fire emergency or excessive heatinglcooling. A mobile application is developed on top of the web application to increase the range of data access to handheld internet enabled telephony devices such as mobile phones and PDAs. The web access is implemented in XHTML-MP with a .NET web service and J2EE web service client back end. A desktop application is then used to access the real time temperature data through a PC desktop connected to the internet. Spatial representation of data is visualized by overlaying the temperature profiles with floor plans and maps of the buildings using GIs.
Thesis Supervisor: John R. Williams
Title: Associate Professor of Civil and Environmental Engineering Director, Intelligent Engineering Systems Laboratory (IESL)
Acknowledgements
I extend my sincere gratitude and appreciation to many people who made this thesis possible. Special thanks are due to my supervisors Prof. John R. Williams and Dr. Ruadhiri O'Connor. Prof. William's class on C# .NET helped me gain technical know-how that was of immense importance in the project undertaken. Dr. O'Connor valuable suggestions and ideas bore fruitful results in the project. I am highly indebted to Dr. George Kocur for his class, on Database, Internet and Systems Integration that helped me overcome technical barriers. I am thankful to Mr. Daniel Sheehan for providing technical help with GIs (Geographical Information System) in the project.
I am grateful to my parents and friends for consistently encouraging me. Special thanks to my three closest friends at MIT-Sunil, Siddarth and Ilkay for their selfless friendship and admiration of my work.
Table of Content
Acknowledgements...
3 Table of Content...
4 List of Figures...
6...
Chapter 1 7 Introduction...
7 1.1 Purpose...
7 1.2 Problem...
7 1.3 Background...
8...
Chapter 2 11...
System Features 11 2.1 Schema of the entire system...
11...
2.1.1 Software Architecture 12 2.1.2 Requirements for the Wireless Sensor Network...
132.2 DUST Inc
.
HDK MoteView...
142.3 C# Console Application
...
17...
2.4 Database Tables 17...
2.5 Web Features 19 2.6 Desktop Application Features...
242.7 Mobile application Features
...
25Chapter 3
...
28The Language and Software Concepts
...
283.1 C#
...
28 3.1.1 .NET Advantages...
28 3.1.2 Type-safety...
28 3.1.3 Rapid development...
29 3.3 Web Services...
31 3.4 XHTML-MP...
33 3.5 SQL DataBase...
343.6 Serial Port Communication
...
34...
3.7 Creating 2-D graphs in ASP.NET application-.
netcharting 35 3.8 E-mail Notifications...
363.9 Reading from a currently logged file
...
363.10 Multi-Threading
...
37...
Chapter 4 39 Data Modeling-Use of GIs...
394.1 2-D Modeling
...
394.2 3-D Modeling
...
404.3 Time-Variant Data modeling
...
41...
Chapter 5 43 Use Case Scenarios...
435.1 User Classes
...
435.1.1 "An owner/inhabitant of a room decides to set-up his desk in the room to give him the highest level of comfort"
...
43 5.1.2 'A factory inspector wants to detect working conditions in an indoorenvironment of the factory"
...
44 5.1.3 'A facilities manager wants to be informed of afire emergency in the room"...
45 5.1.4 "A facility employ wants to occasionally monitor the real time temperaturedata in a room
.
"...
45 5.1.5 "A facilities manager wants to send the historical temperature data fordetailed analysis through internet in XML format"
...
46 5.1.6 " A facilities manager wants to send the historical temperature data fordetailed analysis through internet in XML format"
...
46 5.1.7 " A facilities manager wants to determine careless use by the roominhabitant and follow it up with the appropriate HVAC control."
...
47 5.1.8 " A facilities manager wants to detect points of leakage (of heat) in a room.
"...
-48 Chapter 6...
50...
Conclusion 50...
Chapter 7 51 Future Work...
51 Chapter 8...
53...
References 53...
Appendix 55List
of
Figures
...
Figure 1 Temperature Color Coded Map 10
...
Figure 2 Schema of Entire system 11
...
Figure 3 Software Architecture 12
...
Figure 4 Dust Inc
.
HDK Moteview 15...
Figure 5 Setting Data Packet Interval 15
...
Figure 6 Wireless Sensor Network-Topolog y 16
...
Figure 7 Storing data in a text file 16
...
Figure 8 C# Console Application 17
...
Figure 9 Database Tables 18
Figure 10 Web Application
...
20...
Figure 1 1 XML Format 22...
Figure 12 Temperature Graph 23...
Figure 13 Phone registry 23...
Figure 14 E-mail Registry 2 3...
Figure 15 Desktop Application 24...
Figure 16 Mobile Application Architecture 25 Figure 17 Mobile Application...
27...
Figure 18 Web Service Architecture 32 Figure 19 SQL DataBase...
34...
Figure 20 Multi threading 38 Figure 21 Temperature Color Coding (2-D)...
40...
Figure 22 3-d modeling 4 1 Figure 23 Time Series Data...
42Figure 24 NO Comfort Zone
...
44Figure 25 Suspected Leakage
...
49Chapter 1
Introduction
1.1 Purpose
This project was undertaken to automate indoor temperature data collection using Wireless Sensor Network. The purpose was to simplify real-time or historical data collection and make it available in meaningful formats using 2Dl3D visualization and analysis. The aim was to investigate and provide information to explain temperature variation with space and time and comment on the performance of W A C (Heating, Ventilation and Air Conditioning) systems installed in built facilities and other enclosed environments. The investigation also aimed at automating f i e alarm notification. Ultimately this work provides a schema for 3-D modeling that can aid in the detection of sources of thermal leak.
1.2 Problem
Temperature in a closed 3-D environment varies spatially. HVAC systems rely on localized thermostats to approximate the ambient room temperature. Thermostats typically assume the temperature reading at a particular point to be the ambient room temperature. However, there can be variations in temperature with space. Thus, modeling the room temperature is a very crucial part of understanding energy losses and conserving energy spent in heating a space. Wireless Sensors Networks (WSN) provide a compact and useful tool in this spatial analysis. Automation of data collection and subsequent automated modeling can enable a clear understanding of heat losses in a built facility.
This work is motivated to provide the fundamental building block in the larger goal of understanding indoor heat losses and improve HVAC efficiency.
1.3 Background
Heating, ventilation, and air-conditioning (HVAC systems) account for 39% of the energy used in commercial buildings in the United states1
.
Consequently, almost any business or government agency has the potential to realize significant savings by improving its control of HVAC operations and improving the efficiency of the system it uses. Heat loss inside a room is primarily responsible for the HVACs' inefficiency. This can occur due to inefficient HVAC design, improper HVAC installation or improper HVAC control. Work is being done to make HVACs more efficient by changing their engineering design. The HVAC group at dAibelofflab2 - MIT researching ways to improve HVAC design by modeling and controlling oil concentration in the refrigerant of an HVAC unit3. Work is underway to improve installation to minimize heat losses also4. The proper selection, sizing, installation and maintenance of HVAC systems are major factors in optimizing energy savings. However, not a significant amount of work has been done to focus on HVAC control. This project focuses on monitoring W A C performance that provides critical input to control processes.An example of heat loss occurring due to improper HVAC control is when a user opens the window to lower the temperature instead of turning off the Heater or setting the thermostat to lower levels. While HVAC tries to maintain the room temperature to the
thermostat settings, there is a gross energy loss. To prevent this, a central facility monitoring HVAC performance and user actions should be setup to deal with such heat losses. As an action to this incident, an automated SWITCH OFF can help reduce the wastage of energy. The work here focuses on providing software infrastructure and information to be used by that central facility to interpret and act upon user actions and energy losses in a closed environment.
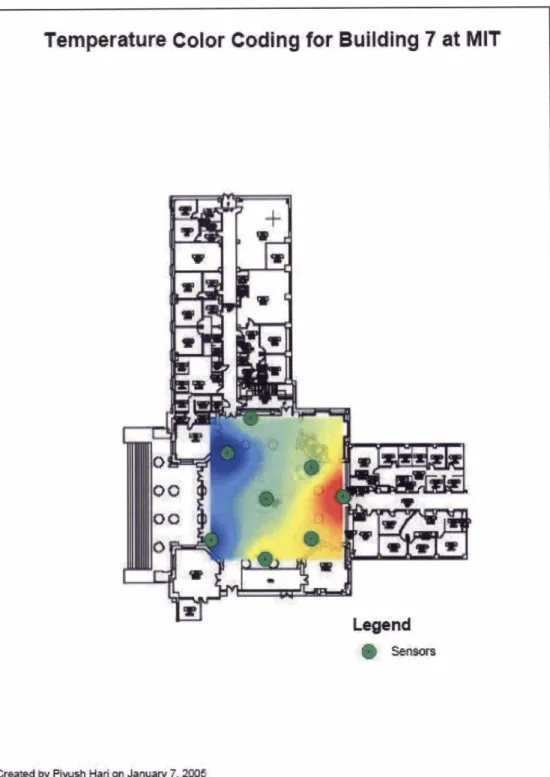
The general approach followed to achieve this goal is as follows: defining problem, defining functional requirements, gathering hardware requirements, gathering software requirements, hardware installation, software development, setting up infrastructure, software testing, sampling real time date, analysis, visualization and reporting.. The criterion of this worKs success is based on the results obtained after automating the data collection process for a real temperature monitoring system in enclosed built facilities. A manual test was conducted in the beginning to showcase temperature variation with space in Lobby-7 at MIT (Fig 1). Sensor Motes were placed as shown and temperature was collected using the DUST Inc. propriety interface and interpolated using ArcGIS 9.0. The results were compelling. It can be seen that there is a considerable temperature variation throughout the lobby. Due to opening and closing of doors at the exit, the space adjacent to it shows colder temperatures (blue shade) whereas the one on the right towards the ''infinite corridot' is warmer (red). This gave us a significant reason to construct a software architecture to automate temperature data collection and retrieval.
3
Temperature
Color Coding
for
Building
7
at
MIT
~ ~ P k y r r a t r H P w i a n J P n c r r u y ? . ~
Chapter
2
System
Features
In this work we are using Sensor Motes from Dust Inc (the company). These motes provide the ability to measure temperature in addition to hardware connectors to measure other temporal data with extended hardware sensor attached through their propriety interface-Dust Inc. HDK Moteview Software.
Schema
of
the
entire
system
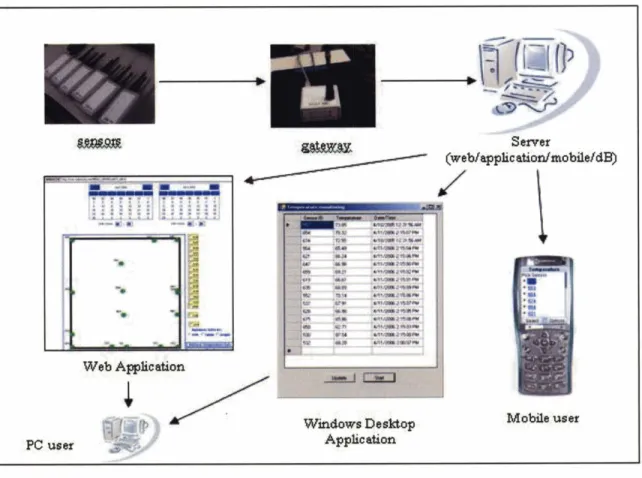
As depicted in Fig. 2 Dust Mote Sensors sense temperature data. The gateway
communicates the data to the Server. The data is made available to the end user in form
of a web application, windows desktop application or as a mobile application.
2.1.1
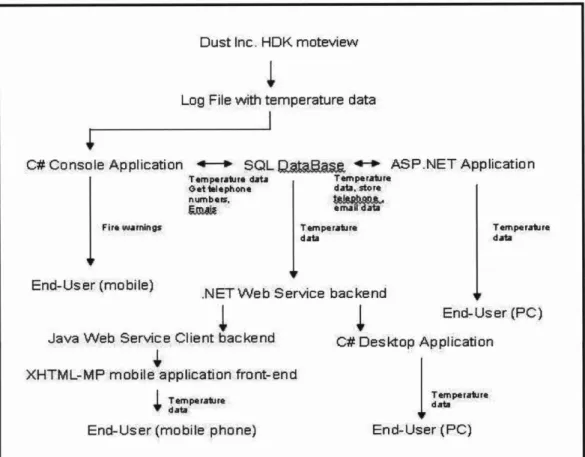
Software Architecture
The software architecture is as shown in Fig 3. The propriety DUST Inc. software communicates with the motes through the gateway and stores the temperature data in a text file. A
C#
console application parses the logged text file for time, temperature and sensor data and stores it in a SQL Database. It also informs the user of a fire hazard through phone or e-mail. An ASPNET web application retrieves temperature data from the MS SQL database and publishes it on the internet. It also lets the user register hislher mobile number andlor email address in order to be informed of the fire emergency. A .NET Web Service makes the temperature data available to a Java Web Service client which in turn is made available on a mobile handset through an XHTML-MP (XML- HTML Mobile platform) front end.Dust Inc. HDK moteview
1
Log File with temperature data
C# Console Applicatian .t--, SQL ASP.NET Application
f rmparafura data Temperabra Get telephone data. store numbers.
€a!Mk a mail data
1
Ftth warnin*1
1
data TempetakreEnd-User (mobile)
.NET Web Service bac kend
1
1
End-User (PC)Java Web Service Client backend C# Desktop Application
4
XHTML-MP mobile application front-end
1
z;gpratunEnd-User (mo bite phone) End-User (PC)
2e1.2
Requirements for the Wireless Sensor Network
Range: We seek to sample a large coverage area with as few wireless sensors as possible. Communication range dictates the bound on the ability to achieve this goal. The wireless transceiver chip in each wireless sensor node has a predefined communications range and we can distribute the nodes to form clusters (localized WSN) and aggregate the measurements. The radio communications range for the wireless sensor nodesS used in this work is approximately 20m.
Multi-Hopping: A good wireless sensor network should support multi-hopping to
increase the area covered by the network. It means that sensors can communicate to the base station (gateway) through one another and not necessarily directly. The Wireless Sensor Network for this experiment supports multi hopping.
Data
Collection Interval: This is the time interval after which each data packet is collected by the base station. The smaller the data collection interval, the better it is since it give precise data variation with respect to time. In the Wireless Sensor Network setup for this experiment, data collection interval is set to 4 seconds. However, due to space constraint and non-usability, only 15 minute data is stored in database.Power Consumption: A fundamental factor in the success of WSN deployment is the
optimal utilization of the onboard power source (typically batteries)
.
Sensors can be of two types - active or passive. Active sensors rely on batteries for their operating energy needs whereas passive sensors rely on external sources of energy like soladlight energy for their energy needs. Passive Sensors have typically an inexhaustible source of energy.They are thus preferred over active sensors. Unfortunately, due to infrastructure constraints, only active sensors are used in this experiment. The sensors are AA battery driven. However, battery data can be stored and then monitored to predict health of a sensor and when necessary inform the user to replace batteries.
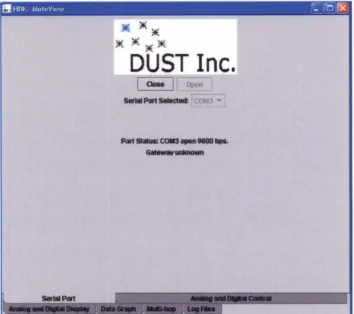
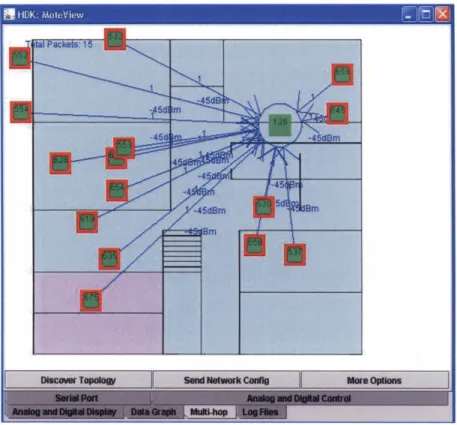
2.2 DUST
Inc. HDK MoteView
This Software is owned by Dust Inc. and is protected by copyright law and international treaties. It communicates with sensor motes through a gateway connected to the computer through a USB port. It also lets the user store data in a text file. As shown in Fig 5, time interval at which data from each sensor is collected can be set by changing Data Packet Interval. Data Packet Interval can be set to 4s, 8s, 16s, 32s, 64s, and 128s. One can also set whether or not sensors would multi-hop. Real time temperature data can be accessed as. However, it's possible to see that data only on the server that is connected to the gateway. An important parameter shown in this real time data is the current battery power (in volts) and the age of sensor data (number of seconds since last data packet received). Since, Dust Motes are active sensors and require 3 volts of input energy to function, the knowledge of this parameter is essential to know when a sensor would need a battery replacement. 'Age' of the sensor helps position sensor so that it's within range of detection.
Figure 6 shows the topology of the wireless sensor network. The lines converge to the gateway and although multi hopping is permitted, there is no sensor-to-sensor communication because all sensors are within the 20 meters range of the gateway. As shown in Fig. 7, user can chose to store the data in a text file at any location of his choice.
Figure 4 Dust Inc. HDK Moteview
Figure 6 Wireless Sensor Network
-
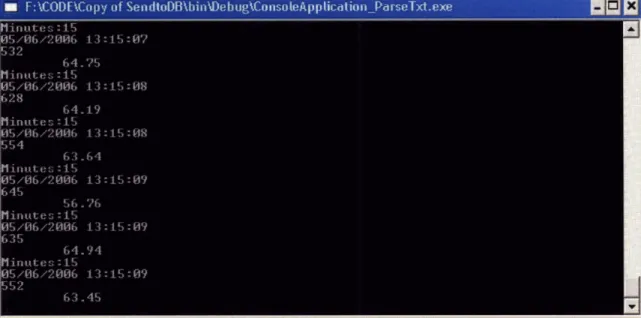
Topology2.3 C# Console Application
As shown in Fig 9, the console application developed in C# parses sensor data from the text file where data is being logged by the Dust Inc. Software. It displays the real time data on the screen. The primary purpose of this application is to gather and store the temperature data from the text file into the SQL database. Temperature data is collected
and stored after every 15 minutes. This application also manages fire hazard warnings by
either calling the stored phone numbers in the database or by e-mailing the e-mail
addresses also stored in the database.
J/@6/28etd 13:15:W 32 64-75 i n u t e s : I 5 i/tS/2t?MX 13:15:88 18 64-29 i n u t e s : 15 i/E16/2886 13:15:@8 ; 4 63.64 i n u t e s :I5 5/06/2[986 13:15:89 95 56.76 i n u t e s :I5 ;/06/2@6 13 : I5 :89 35
I
64.94 i n u t e s :I5 !/06/2@@6 13 : I 5 :09 32 63-45I
I
. - 7T - ..--. 7 . .-.. - Figure 8 C# Console Application2.4 Database Tables
Here we describe the database tables schema used in this application. A DataBase is
necessary to store historical data and to let the applications query that data. MS SQL DataBase is used to store data. The following tables are included in the Database. Their
attributes and primary keys are depicted in the figure and described below. A Primary Key is the unique identification of a record in a table. It is used to query the data fiom the
table. The data primarily consists of temporal temperature data, phone numbers and e- mail addresses. The MS SQL database is named 'MEngProject' and consists of the following tables as shown in Figure 4.
Figure 9 Database Tables
"TempData" Table: This table will keep track of all the incoming data fiom the sensors. Each data entity represents one sensor reading in a sensing event.
Mote-ID (PK): Provides the primary identification for each data monitoring device (sensor).
Time-Starnp(PK) : The time at which data is collected.
Temperature : The temperature in Fahrenheit scale collected by the sensor at a particular time-stamp
"Emails" Table: This table stores e-mail addresses for future retrieval in order to be
informed of a f i e hazard. The user can register hisher e-mail address through the web application. The
C#
application parses temperature data fiom the log file and constantly stores it in the "tempdatrl'table. It also checks to see if temperature falls in the normal range [45F, 85FI. If it does not fall in the normal range, an e-mail notification is sent to all the e-mail addresses stored in the'EnailE table one by one."Phones" Table: This table stores phones for future retrieval in order to be informed of a fire hazard. The user can store phone numbers through the web application.
.
The C# console application checks to see if temperature falls in the normal range [45F, 85FI. If it does not fall in the normal range, it retrieves the list of phone numbers stored in6Phone8' table and then calls each one of them informing of the hazard.2.5
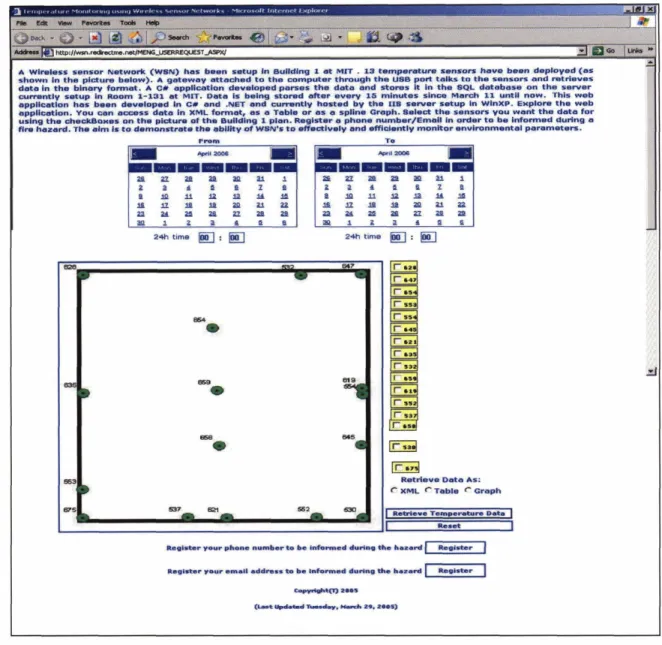
Web Features
The web application developed for this work is located at:
http://wsn.redirectme.net/MENGGUSERREQUESTTASPX/
As shown in Fig. 11, it gives a graphical representation of where sensors are installed in Room 1- 13 1 on the MIT campus. A calendar time selection lets the user select the start and end time of the data he wants to query the data for. Checkboxes on the right lets the user select sensors they want the data for. The user has an option of retrieving data in different formats: as a graph; a table, and as an XML file Users can also register their phone number andlor e-mail in order to be informed of a fire emergency.
Figure 10 Web Application
2.5.1 Data Formats
Data can be retrieved in the following formats:
Table: A table format data is easily understood, displays precise data numbers and
can be copied as an input to useful data application programs to do an in-depth analysis of raw data.
Table 1 Temperature Data Table M o t e Temperature time-Stamp 654 67.16 4/12/2006 12:00:01 AM 654 67.16 4/12/2006 12:00:05 AM 654 66.98 4/12/2006 12:15:09 AM 654 66.98 411 212006 12:30:0 1 AM 675 64.38 4/12/2006 12:00:06 AM 675 64.56 411 212006 12: 15:02 AM 675 64.38 4/12/2006 12:30:02 AM 675 64.38 4/12/2006 12:30:06 AM 645 56.58 411 2/2006 12:00:07
AM
645 56.39 411 212006 12:30:03 AM 645 56.58 4/12/2006 12:30:07 AM 635 67.16 4/12/2006 12:00:07 AM 635 67.16 411 2/2006 12: 15:03 AM 635 67.16 4/12/2006 12:30:03 AM 635 67. I6 4/12/2006 12:30:07 AM 552 68.84 4/12/2006 12:00:04 AM 552 68.84 4/12/2006 12:00:08 AM 552 68.84 411 2/2006 12: 15:04 AM 552 68.84 411 2/2006 12: 15:08 AM 552 68.84 4/12/2006 12:30:00 AM 552 68.84 411 2/2006 12:30:04 AM 552 68.84 4/12/2006 12:45:00 AM 628 65.86 4/12/2006 12:00:02 AM 628 65.86 4/12/2006 12: 15:06 AM 628 65.68 4/12/2006 12:30:02 AMXML (extensible Markup Language): XML is a very useful format to exchange data over internet. Many end user programs are based on XML format. XML is meant for a developer or an end-user application.
Figure 11 XML Format
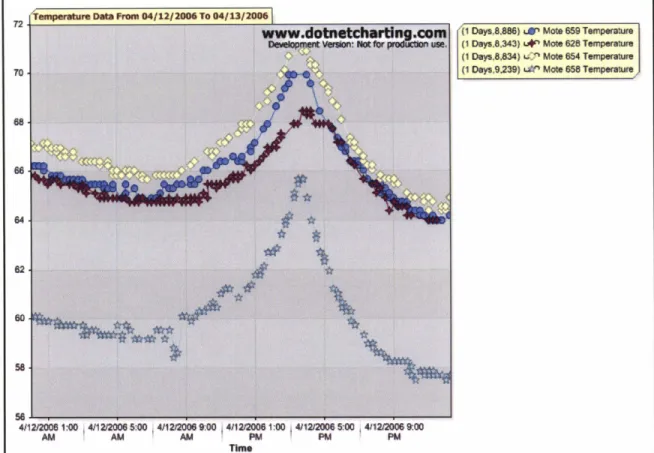
Graph: A graphical representation of Time Vs. Temperature data by sensor ID lets the user know the temperature variation and abnormalities with time as
Figure 12 Temperature Graph 2.5.2 E-maiVPhone Registration
User can register hisher phone and/e-mail address to be notified in case of a fire emergency.
Figure 13 Phone registry
Register for Fire Emergency Reponse - Enter your Emails address
roo(lmitedu(1
2.6 Desktop Application Features
The Desktop application runs on a Windows desktop with internet co~ectivity and displays real-time temperature data corresponding to each sensor. At the backend is a .NET Web Service that retrieves data from SQL database. The desktop application can be downloaded at: http://wsn.redirectrne.net/DesktopSenso~
It can be unzipped and run as a Windows Executable.
I
UpdateFigure 15 Desktop Application
Data gets updated after every 15 mins. However, user can force an update by hitting the 'Updatd'button. Pressing'Pausd'button would pause data update and show last data retrieved.
2.7 Mobile application Features
IntroductionExisting mobile applications lets the user view weather conditions (macro-climate) but not the micro-climate. Real world needs of knowing the micro-climate exists when the user wants to know climate data (temperature, humidity etc.) in a greenhouse, workshop or a building. After having built the IT infrastructure (sensors, gateway, Application/Db/web server) setup data can wither be accessed through the web application or through a mobile device. However, the limitation of internet connectivity and PC availability on the site restricts the use of Web Application. Mobile phones serve as good replacements to view sample data. Mobile applications are thus a need.
2.7.1 Architecture
Figure 16 Mobile Application Architecture
To access a Web site on a mobile phone, one has to type the URL in the browser. Using Wireless Transport Layer Security (WTLS), the mobile phone browser generates an
encrypted URL request and sends it over Wireless Session Protocol (WAP) to a WAP gateway server. WAP is a variant of HTTP that transfers information in a binary format rather than text-based format.
The WAP gateway interprets the request, translates it into a conventional HTTP request.and sends it to the Web Server.
After getting the request, the Web server interprets it and determines which resources to retrieve or execute. If the URL indicates a file, the server sends the file to the client. If the URL indicates a JSP page, then the Web Server executes the JSP code before sending the results to the WAP gateway server. In this method returned content must be in the form of a XHTML-MP document.
The gateway server removes the unnecessary header. Translates the XHTML document into binary, and sends the response to the mobile phone browser. The browser interprets the XHTML-MP and displays it to the user. This is the architecture of Mobile Application using XHTML-MP.
2.7.2 User Interface
Mobile application makes data available on a mobile device-a mobile phone or a palmtop.
Figure 17 Mobile Application
Mobile application can be accessed from any internet enabled mobile phonelpalmtop at
http://wsn.redirectme.net:8090/menu.html.
User can query latest temperature data by sensor ID. The output is temperature data with timestamp at which data was collected.Chapter 3
The Language and Software Concepts
This Chapter briefly overviews the programming languages and modem software engineering concepts implemented in this project.
3.1
C#
C# (pronounced see-sharp) is an object-oriented programming language designed by Microsoft. Here are just a few of the many advantages C# has over other programming languages:
3.1.1
.NET
AdvantagesBecause C# is a .NET language, it takes advantage of the .NET ~ r a m e w o r k ~ class library, whose classes number literally in the thousands. Rather than rewriting code for a myriad of functionalities, programmers can use the classes of the Framework instead.
Another .NET advantage is its cross-language capabilities. This means that one can interoperate with any other .NET language. For example, programmers coding in VB.NET (another .NET language) can easily plug a C# component into their code or create classes in VB.NET that derive from the C# component. All .NET languages also support error handling across different languages, using .NET exceptions.
C# provides solid type-safety checking. Uninitialized variables cannot be used, and one can't go beyond the end of an array.
3.1.3 Rapid development
Developers can use C# in a rapid development environment using a powerful forms engine similar to what VB (Visual Basic) developers have had for years.
Although C++ is considered object-oriented, C# takes this a step further: every data type is considered an object. For example, unlike in C++, objects of type int have methods. The same is true of string literals. Given the advantages of programming in C#, it is easy to see why a component written in C# is such a smart choice.
Because of all the above mentioned reasons, C# was chosen as the programming language to create console application and to do back-end programming for the web application.
ASP.Net is the latest Microsoft programming framework that allows for the rapid development of powerful web applications. In this section, we are going to discuss the advantages of using ASP.Net and why it was chosen to write the web application in this project
.
Powerful database-driven functionality
Like ASP (Microsoft's language preceding ASP.Net), ASP.Net allows programmers to develop web applications that interface with a database. The advantage of ASP.Net is that it is object-oriented and has many programming tools that allow for faster development and more functionality.
Faster web applications
Two aspects of ASP.Net make it fast -- compiled code and caching. In the past, the code was interpreted into "machine language" when the website visitor viewed the page. Now, with ASP.Net the code is compiled into "machine language" before a visitor ever comes to the site.
Caching is the storage of information that will be reused in a memory location for faster access in the future. ASP.Net allows programmers to set up pages or areas of pages that are commonly reused to be cached for a set period of time to improve the performance of web applications. In addition, ASP.Net allows the caching of data from a database so the website isn't slowed down by frequent visits to a database when the data doesn't change very often.
ASP.Net was tested and found to be over 10 times faster for the average user than Java's J2EE technology. While there have been some debates about the methods of testing it is interesting to note that this has been validated by 3rd parties
.
(http://www.gotdotnet.com/team/compare/petshopperf. aspx).Memory leak
and
crash protectionASP.Net automatically recovers from memory leaks and errors to make sure that website is always available to its visitors.
Multiple language support
Programmers can actually write their code in more than 25 .Net languages (including VB.Net, C#, and JScript.Net). This allows programmers to develop their site in the language they know best.
One of the disadvantages of ASP.Net is that it needs to be hosted on a Microsoft web server (11s) that is Operating System(Windows) dependent. However, since Dust Inc. HDK Moteview software is windows compatible only, this is not an issue in this project.
3.3
Web Services
A Web service is any piece of software that makes itself available over the Internet and uses a standardized XML messaging system. XML is used to encode all communications to a Web service. For example, a client invokes a Web service by sending an XML message, then waits for a corresponding XML response. Because all communication is in X M L , Web services are not tied to any one operating system or programming language-- Java can talk with Perl; Windows applications can talk with Unix applications. A Web service is described using a standard, formal XML notion, called its service description that provides all of the details necessary to interact with the service, including message formats (that detail the operations), transport protocols, and location. This is often
referred to as WSDL (Web Service Description Language). The protocol through which
XML communication takes place is called SOAP ( Simple Object Access Protocol).
A graphical representation of the web service concept is shown in Figure 19 with a 'Sensor DaW .NET Web service and a Java Client on another machine. A Java web page
(result.jsp) is hosted on a Unix (or Windows) platform that knows about the .NET Web Service (Service1 .asmx) hosted on IIS server on MS Windows platform. A request is made by Java client to get temperature data fiom the .NET web service. A response is sent after the method gettempdata() is executed on the Web Server (with web service). Both Request and Response are in form SOAP messages. For more information on creating a .NET web service and a Java client refer to the Appendix.
4
gettmpdatafj
90AP
66.6 B
B
Web & e ~ r
-
US
(Wind-] wbb , .pw
G&m.fJdM) Wki&Mce
-
S e w 1.%wax
"Resuk.jsp*mar*-
Method-
GetTmpData[) Locatim : -,. +- -. * k http:/hwsn .redirectme .neWA@fL!?t&IMW Swke?l . a s m3.4
XHTML-MP
XHTML
M P
(extensible HyperText Markup Language Mobile Profile) is the markup language defined in WAP (Wireless Application Protocol) 2.0. WAP 2.0 is the most recent mobile services specification created by the WAP Forum (now the Open Mobile Alliance [OMA].
XHTML Mobile Profile is a subset of XHTML, which is the stricter version of HTML (Hypertext Markup Language). XHTML Mobile Profile is XHTML Basic (also a subset of XHTML) plus some additional elements and attributes from the full version of XHTML.
The goal of XHTML Mobile Profile is to bring together the technologies for mobile Internet browsing and that for the World Wide Web. Before the advent of XHTML Mobile ProNe, WAP developers made use of WML (Wireless Markup Language) and WMLScript to create WAP sites, while web developers use HTML I XHTML and CSS style sheets to build web sites.
With the announcement of XHTML Mobile Profile, the markup language of the wireless world and the wired world finally converges. XHTML Mobile Profile and WAP CSS give wireless Internet application developers more and better presentation control. The greatest advantage, however, is that the same technologies can now be used to develop both the web and wireless version of one's Internet site. One can use any web browser to view a WAP2.0 application during the prototyping and development process7.
3.5
SQL DataBase
SQL (Structured Query Language) is the most popular computer language used to create, modify, retrieve and manipulate data from relational database management systems8. The language has evolved beyond its original purpose to support object-relational database management systems. It is an ANSVISO standard.
Although we do not require a relational database in the current system, MS SQL Server 2000 is used to support SQL queries and store historical data. Commonly used operations are Data Retrieval (for retrieving data from web application and console application) and Data Storage (storing e-mail addresses, phone numbers and temperature data) as shown in Figure 20.
Database
El
Figure 19 SQL DataBase
3.6
Serial Port Communication
Data storageemp erature ,Timestamp, Sensor ID,
Phmes, I5
.
This section will discuss the software tools and concepts used to communicate to a phone via modem through the C# console application to warn users of fire hazards. Adding
+
.
*
Data Retrieval fr emp erature, Timestamp, Sensor ID, Phmes, Ernd addresses)serial communications capabilities to an application is never a simple matter. It requires specialized knowledge that might be outside an individual prograrnmefs expertise. ~ c t i v e ~ o m ~ o r t ~ is a COM component, that provides an easy-to-use scripting interface for serial, asynchronous communications through a serial port. ActiveComport can control modems, ISDN modems, USB serial devices and other devices and machines that have a serial interface.
The core of ActiveComport consists of one file : AComport.dl1. ActiveComport can be distributed easily to many PCs. Once one has purchased the licenses, one can copy the AComport.dl1 to the PCs and register the DLL on that PC.
Having registered, it can be referenced in the C# project and used to initialize and dial ftom a modem.
For details on using this component for initializing a modem and dialing to a phone number see Appendix.
3.7
Creating
2-D
graphs in ASP.NET application
-
.netcharting
.netcharting is a third party vendor software that can be included in an ASP.NET application to create, display and control a graphical representation of data. It is available as a DLL file and fiee for download.
.netchartinglo tool is used in this project to create and display temperature Vs time graphs as shown in figure 12. Refer to the code in Appendix to learn more about how to use it to plot graphs.
3.8
E-mail Notifications
Microsoft.NET framework provides many rich class libraries that aid in sending emailsl' through a C# console application. In this section I discuss how one can make use of the MailMessage class to send emails. In the project, e-mail notifications are sent if temperature at any mote is not in the normal range, normal range being [SOF ,80F]. To be able to include e-mail capability in a C# application, one has to first add the following namespace in the working class: using System.Web.Mai1. This is the namespace that provides the methods and properties for sending an email.
The following function can then be written to send emails using C#.
private void SendEmail(string To, string From, string Subject, string Body)
{
MailMessage mail = new MailMessageO;
mail.To = To; //To is the email address to which email is sent to
mail.From = From; /I From is the email address from which email is to be sent
mail.Subject = Subject; //this is the subject of the email
mail.Body = Body; //this is the body of the email
maiI.BodyFormat = System.Web.Mail.MaiIFormat.Text;
Sm tpMail.Send(mai1); //sends the email
One of the problems encountered was on accessing a text file for reading while it was constantly being written and in use by another application. The text file where the temperature data is being logged by the Dust Inc. HDK Moteview software needs to be read by the c# console application simultaneously. This was overcome by using the special method for accessing the text file for reading.
using (StreamReader reader = new StreamReader(new FileStream(filename,FileMode.Open, FileAccess. Read, Fileshare. ReadW rite)))
3.1 0
Multi-Threading
The ability of an operating system to execute different parts of a program, called threads, simultaneously is called multi-threading
.
C# and .NET support multi-threading1*
.
Main goal of creating multithreading application is performance improvement. As an example, imagine a situation where in a user starts a long process (e.g. copying), he can't use a single threaded application and wait for an infinite time for the operation to get completed. But if he uses multi-threading application he can set copying process in the background and interact with application without any problems. In this project multi- threading is used in the C# console application.As shown in Figure 21, the C# application executes two tasks simultaneously in the event there is an abnormal temperature data detected. While one task notifies the user of the
abnormality by sending emails and calling on phone, the other continues to retrieve temperature data. Emergency notification stops when temperature abnormality is contained.
Parse Temperature Data
1
-
Check if Temperature is *45F or N35F/
P a m Temperature Data Emergency HatMeatian
-
Dial the phone numbers and mail informing them of the hazardChapter
4
Data
Modeling
-
Use of
GIs
Having set up necessary infrastructure for temperature data retrieval, the next big step is to model data for easy understanding and interpretation. Thus, the task of color coding of temperature data was undertaken.
4.1
2-D
Modeling
As shown in Fig 10, temperature data for
a
particular timestamp has been color coded with temperature as the value field. This is a stretched spline color interpolation. ArcGIS9.0'~
is used to create the color interpolation. It can be seen that temperature varies substantially with respect to space in this indoor environment. Temperature varies from a low of 48 F to a high of 87 F. What appears to be an ambient temperature is consistent only in a particular space. There are cold pockets of significantly low temperature (depicted by white and blue) and there are hot pockets depicted by significantly high temperature (depicted by red in bottom right corner). It can be concluded that the quadrant with significantly cold and hot temperatures is a bad comfort zone.Figure 21 Temperature Color Coding (2-D)
3-D
Modeling
Temperature variations also take place in the third dimension (vertically). It is worth an
exercise to model temperature variation in 3-d since inhabitants of a room are not merely
point objects but have heights. Comfort level with respect to heat can better be
understood by understanding temperature variation vertically. As shown in Fig 11,
temperature variation over the two dimensions is depicted for a particular timestamp.
Figure 22 3-d modeling
4.3
Time-Variant Data modeling
Temperature Data varies with time. A time vs. temperature graph depicts temperature trend corresponding to particular sensor. Spatial analysis of temperature data with time
would help us understand the irregularities that exist in the indoor environment. Thus, the
task of representing temperature data over time was undertaken. This is done by
developing static color coded images in ArcGIs and then combining them in Windows Movie Maker. Figure 12 shows the color coded temperature pictures over time.
Chapter
5
Use Case Scenarios
This chapter would discuss the user scenarios where this software architecture can be used depending on different classes of users. The use case and its users are discussed below.
5.1
Userclasses
The following user classes are identified to be potential users of the system:
1) Inhabitantfowner: Person who inhabits the indoor environment. His main concern is comfort level.
2) Facilities: People responsible for Heating and cooling in the indoor environment. They will monitor HVAC performance and take steps to remedy any problems.
5.2
User Scenarios
5.7.7
"An ownernnhabitant of a room decides to set-up his desk in
the room to give him the highest level of comfort"
1. User opens the web application at :
h t t p : / / w s n . r e d i r e c t m e . n e t / M E N G t m U S E R R E Q ~
2. User queries the sensor data for the most recent time-stamp over the period he will be spending time in that room. (For example: yesterday from 9 am to 5 pm).
2.1 User selects the6Froddate and time from the calendar. 2.2 User selects the6Td'date and time from the calendar.
2.3 User6'&ecki' all the sensors. 2.4 User chooses 'TablC' format
2.5 User clicks 'ktrieve temperature datsl' button
3. User saves the table format of data and uses it to create a 2-D color coded map
of temperature data corresponding to each time location.
4. User creates a time series video of the 2-d images so developed and identifies the location in the room with excessively highnow temperatures (shown by
blue or red). User then chooses any other location to set-up hislher desk in the room as shown in Fig 13.
Figure 24 NO Comfort Zone
5.1.2
" A
factory
inspector
wants
to
detect
working
conditions
in
an
indoor
environment
of
the
factory"
Assumptions: User owns an internet enabled mobile phone.
2. User selects the sensor ID for the location at which he wants the data (For ex : '5537
3. User gets the last recorded temperature data corresponding to the sensor ID he selected.
4. User can check if the temperature at the given location is in lines with law.
5.1.3 " A facilities manager wants to be informed of a fire emergency
in the room"
1. User opens the web application at :
http://wsn.redirectme.net/MENG-USERREQUESTTASPX/
2. User registers his e-maillphone through the6Register E-mai1'and6Register Phon6' buttons.
3. Whenever a fire emergency occurs User is informed by call or e-mail.
5.1.4 "A facility employ wants to occasionally monitor the real time
temperature data in a room.
"1. User installs the desktop application :
http://wsn.redirectme.net/DesktopSensorClient.zip
2. User starts the application that provides a real time temperature data of the room.
5.1.5 "A facilities manager wants to send the historical temperature
data for detailed analysis through internet in XML format"
1. User opens the web application at :
http://wsn.redirectme.net/MENG-USEFtREQUESTTASPX/
2. User queries the historical sensor data2.1 User selects the6Froni'date and time from the calendar. 2.2 User selects the6Td'date and time from the calendar. 2.3 User6'check~'all the sensors.
2.4 User chooses6XML' format
2.5 User clicks 'ktrieve temperature datal' button
3. An XML file of the historical data is generated. User downloads this file and e-mails it to the contact for further data analysis.
5.1.6 "A facilities manager wants to send the historical temperature
data for detailed analysis through internet in XML format"
1. User opens the web application at :
http://w sn.redirectme.net/MENG-USERREQ-
2. User queries the historical sensor data
2.6 User selects the6Roni' date and time from the calendar.
2.8 User6'checkd' all the sensors. 2.9 User chooses'XMIY format
2.10User clicks'ketrieve temperature datd'button
3. An XML file of the historical data is generated. User downloads this file and e-mails it to the contact for further data analysis.
5.1.7
"A
facilities manager wants to determine careless use by the
room inhabitant and follow it up with the appropriate HVAC control."
1. User opens the web application at :
http://w
sn. redirectme.net/MENG-USERREQUESTTASPX/
2. User queries temperature data for a particular timestamp.2.1 User selects the6Froni'date and time from the calendar. 2.2 User selects the6T8date and time from the calendar. 2.3 User"checkd'al1 the sensors.
2.4 User chooses6tab16'format
2.5 User clicks'ketrieve temperature datd'button
3. User saves the table format of data and uses it to create a 2-D color coded map of temperature data corresponding to each time location.
4. User creates a time series video of the 2-d images so developed and identifies the abnormal temperature variations near a window. If a high temperature gradient exists, probability is that the user opened the window while HVAC was still set to the higher temperature level. This is gross wastage of energy
since ideally user should have lowered the thermostat. Facility manager, therefore, decides to lower the W A C thermostat through central control.
5.1.8
"A facilities manager wants to detect points of leakage (of heat)
in a room.
"
1. User opens the web application at :
http:llwsn.redirectme.netlMENG-USERREQUESTTASPX/
2. User queries temperature data for a particular timestamp.a.
User selects the'fiod'date and time from the calendar. b. User selects the6Td'date and time from the calendar. c. User"check~'al1 the sensors.d. User chooses'~1C'format
e. User clicks 'ktrieve temperature datd'button
3. User saves the table format of data and uses it to create a 2-D color coded map of temperature data corresponding to each time location.
4. User makes a time-series 2-d representation of data.
5. He analyzes the video and looks for potentially leakage points close to the walls and ductslseals them to prevent heat loss. They are spots closer to walls with temperature signature very different from the rest of the room.
Note: For the height estimation of the point of leakage, the user might repeat the process with the 3-d color interpolation.
1
Figure 25 Suspected Leakage
'.
JChapter 6
Conclusion
The software permits a user to obtain a quasi real-time reporting and visualization of the system. This software infrastructure for temperature monitoring using the existing hardware is complete with the minimum data querying tools. The 2-D and 3-D temperature signature helps us understand the temperature variation with space. The graphical representation of temperature data helps us understand the temperature variation over time. XML representation of data is a good way of communicating data over internet. Temperature data query over a mobile handset provides the user the flexibility to be mobile while querying data. Informing of a fire emergency is a very unique and helpful feature of the software.
Chapter
7
Future Work
The current software infrastructure can be extended to include the following features: 1. Automating 2-d and 3-d color representation of temperature data. This means that
the color coding that is now being done manually using ArcGIS 9.0 can be be hardwired in the web application and color coded maps can be processed and accessed from the web application instead of importing the data and then creating the signatures in ArcGIS 9.0. In this regard, ArcGIS 9.0 libraries can be included in the Visual C# program and then worked upon.
2. Time series representation of 2-d, 3-d data can be automated using the Tracking Analyst ~xtension'~ in ArcGIS 9.0. Currently, its being done by creating the color coded maps i n ArcGIS and then adding the pictures to Windows Movie Maker. This was done because of non- availability of the license for Tracking Analyst extension.
3. Fire Emergency automated action: In case of a fire emergency when the user is informed of excessively high temperatures, the information can be used to automate opening of windows and sprinklers alike.
4. A detailed HVAC performance software can be made to analyse HVAC performance on the basis of the data obtained using the current software infrastructure. The purpose of such software will be to monitor W A C performance and automate central control of W A C systems like, lowering the thermostat settings etc.
5. Currently, Mobile application displays real time data (or the last stored data) only. It can be extended to make historical data available too. Also, data can be represented in other formats like graph and color coded temperature signature.
Chapter 8
References
1. High-Performance HVAC by Carl Ian Graham, PE Stevan Winter Associates http://www
.
wbdg .org/des ignlhvac. php? r=minimize~consumption2. IYArbeloff Lab (MIT) http://darbelofflab.mit.edu/hvacweb/
3. He, X., Cheng, T., Kasahara, S. and Asada, H., 2004,"An Oil Circulation Observer for
Estimating Oil Concentration and Oil Amount in Refrigerant Compressor$ ASHRAE Transaction, Vol 110, Part 2.
4. http://www.energy.ca.gov/efficiency/qualityhomes/procedures.html 5 Dust Inc. (www.dust-inc.com)
6 Thuan Thai and Hoang Q. Lam, .NET Framework, (YReilly, 200 1,O-596-00 165-7 7. XHTML-Moblie Platform Style Guide (for developing mobile applications)
http://developer.openwave. c o m / d v l / s u p p o ~ h
tml-mp-st yle-guidelindex. htm 8. SQL DataBase
http://en/wikipedia. org/wiki/SQL-database 9. Serial Port Communication
http://www .activexperts.com/activcomport/ 10.2-d graphing tool for ASPNET
http://www.dotnetcharting.com/ 1 1. Sending E-mail
12. Multi threading
h t t p : / / w w w . c o d e r s o u r c e . n e t / c s h a r p _ t u t o ~ 13. ArcGIS 9.0
http://www
.
esri.com~software/arcgis/ 14. Tracking Analyst ExtensionAppendix
A.
Creating a.NET
Web ServiceThe following steps illustrate the creation of a .NET Web Service for temperature data retrieval from the SQL database.
1) Open MS Visual Studio
2) Create a new ASP.NET Web Service Project (File
+
New Projects)3) Create Web Methods for your web service in the Service1.asmx.c~ file. The following web methods are created in the WS-SensorData Web Service.
getTempData(int SensorID) : Returns last temperature data collected for the given sensor.
getTirneData(int SensorID) : returns last temperature data collected for the given
sensor.
02006 Piyush Hari. All rights reserved.
Servicel.asm.cs--- using System; using System.Collections; using System.ComponentMode1; using System.Data; using System.Diagnostics; using System-Web; using System.Web.Services; using System.Data.SqlC1ient; using System.Data.Sq1Types; namespace WS-SensorData {
public class Servicel : System.Web.Services.WebService {
public Servicel ( ) {
//CODEGEN: This call is required by the ASP Web Services Designer
Initializecomponent(); 1
[WebMethod]
public String getTempData (int id) {
~ r r a y ~ i s t result = new ~rrayList(2); result=Data (id) ;
f oreach (string s in result)
{
return s; 1
return "notfoundW;
[ WebMethod]
public String getTimeData(int id) {
ArrayList result = new ArrayList(2);
result=Data (id) ; int i=O; foreach(string s in result) { if (i==l) return s; i++; 1 return "notfoundn; 1
private ArrayList Data(int sensorID) { System.Data.SqlClient.Sq1Connection sqlConnection1 = new System.Data.SqlClient.SqlConnection(); / / sqlconnectionl sqlConnectionl.ConnectionString = "workstation id=\nmit-gws74u3vd51\";packet size=4096;user id=piyush;integrated securn + "ity=SSPI;data source=\"(local)\m;persist
security info=False;initial catalog=MEngPm + "rojectw ;
sqlConnectionl.Open();
SqlCommand command; SqlDataAdapter resultDA;
ArrayList result = new ArrayList(2); command = new SqlCommand("SELECT TOP 1 Temperature,time-Stamp FROM TempData WHERE Mote-ID = '"+~ensorID+~' ORDER BY time-Stamp DESCw,sqlConnectionl) ;
command.CommandTimeout = 30; resultDA = new SqlDataAdapter() ; resultDA.SelectCommand = command; DataSet resultDS = new Dataset(); res~ltDA.Fill(resultDS,~TempData");
sqlConnectionl.Close();
foreach ( DataTable table in resultDS.Tables )
{
/ / Repeat for each row in the table. foreach ( DataRow row in table.Rows )
{
r e s u l t . M d ( r o ~ [ ~ T ~ e r a t u r e ~ ] .Tostring() ) ; r e s u l t . A d d ( r ~ w [ ~ t i m e ~ S t ~ ~ ] . T o S t r i n g ( ) ) ; return result;
Creating a Java Client to a
.NET
Web Service
The following steps illustrate the creation of a Java Client (.JSP) to a
.NET
Web Service for current temperature data retrieval from the SQL database.1) Download and install Eclipse with Lomboz plug-in
.
Go for lomboz complete all inone installation:
http:/flomboz.obiectweb.or~downloads/download.~hp
-2) Open eclipse. Create a new Web Service Client. (file
+
new+
other ). Click next 3) Check on Test the Web Service and click next.4) Enter the location of the WSDL (url for the web service whose client to want to
make). For example : http://wsn.redirectme.net/WS SensorDataIServicel .asrnx?wsdl
5)
Hit next, chose the methods you want to be incorporated from the web service in theclient and Finish.
6) A Service Java proxy class will be created titled : ServicelSoapProxy.java that would include proxy methods to the methods in the web service. These methods can then be called from
a JSP page and displayed
on the web page.02006 Piyush Hari. All rights reserved.
...
Result.jsp--- <jsp:useBean id=~sampleServicelSoapProxyidn ~ c o p e = ~ s e s s i o n ~ class=~org.tempuri.ServicelSoapProxy" /> <% try {String id= request.getParameter("id");
int id1 = Integer.parseInt(id); java.lang.String getTempData1 = sampleServicelSoapProxyid.getTempData(id1); java.lang.String getTimeData1 = sampleServicelSoapProxyid.getTimeData(id1); String tempResultreturn= org.eclipse.jst.ws.util.JspUtils.markup(String.valueOf(getT~pData1 1 ) ; String timeResultreturn= org.eclipse.jst.ws.util.JspUtils.markup(String.valueOf(getTimeData1 1 ) ; %> Temperature : <%= tempResultreturn %> on <%=timeResultreturn %> <% 1 catch (Exception e) { e.printStackTrace() r 1 %>
Mobile Application in XHTML-MP
The following code illustrates the XHTML-MP Mobile application for displaying current temperature data on a mobile phone.
02006 Piyush Hari. All rights reserved.
< ? m l < ! DOCTY Pr; L A L A L L ~ PUBLIC "-//W3C//DTD XHTML 1.0 Transitional//ENW "DTD/xhtmll-transitional.dtdn> <html --.1---~ - http://www.w3.org/l999/xhtml" x m l w 7 <title>Temperature</title> < /head> <body> <p>Pick Sensor: <li><a rr~bef=nhttp://wsn.redirectme.net:8080/WS~SensorData~Clientl/smpleSe r v i c e l S o a p P r o x y / R e s u l t 2 . j s p ? i d = 5 5 3 t 1 ~ 5 5 3 ~ / a ~ ~ / l i ~ <li><a href=~http://wsn.redirectme.net:8080/WS~SensorData~Clientl/smpleSe rvicelSoapProxy/Result2.jsp?id=654"~654</a~</li~ <li><a href=~http://wsn.redirectme.net:8080/WS~SensorData~Clientl/smpleSe rvicelSoapProxy/Result2.jsp?id=554">554</a~~/li~ hr,~="http://wsn.redirectme.net:8080/WS~SensorData~C1ient1/smp1eSe
I
--A lelSoapProxy/Result2. j sp?id=621 " >621</a></li>.i><a
..,,f=whttp://wsn.redirectme.net:8080/WS~SensorData~Clientl/smpleSe
I
celSoapProxy/Result2. j sp?id=647 " >647</a></li>.i><a I,I,L=1'http://w~n.redirectme.net:8080/WS~SensorData~Clientl/smpleSe
I
-riqelSoapProxy/Result2. jsp?id=659">659</a></li> ~ i > < a ~,,,Z="http://wsn.redirectme.net:8080/WS~SensorData~Clientl/smpleSeI
-74 selSoapProxy/Result2. jsp?id=619">619c/a></li> L i x a ~,,L="http://wsn.redirectme.net:8080/WS~SensorData~C1ient1/smp1eSeI
-~;?elSoapProxy/Result2. jsp?id=635">635</a>c/li> L i x a ,,,,L="http://wsn.redirectme.net:8080/WS~SensorData~Clientl/smpleSeI
n r i ?elSoapProxy/Result2. j sp?id=552 " >552</a></li> L i x a <a ~~~,~="http://wsn.redirectme.net:8080/WS~SensorData~Clientl/smpleSe1
celSoapProxy/Result2. j sp?id=530H>530</a>c/li> Lixa -~~I="http://wsn.redirectme.net:8080/WS~SensorData~Clientl/smpleSe rvicelSoapProxy/Result2.jsp?id=532w~532~/a></li~ </p> < /body> c/html>D.
SerialPort Communication
-
AComport library
The following code illustrates the Class used to dial a phone for emergency notification in case an abnormal temperature data is
detected
02006 Piyush Hari. All rights reserved.
//ComControl.cs : Dials the phone numbers stored in the database.
using System; using System.Text; using System.Runtime.1nteropServices; using ACOMPORTLib; using System.Collections; using System.Data.SqlC1ient; using System.Data.Sq1Types; using System.Data; namespace ConsoleApplication-ParseTxt { class ComControl {
public static Comport m-objcomport;
public static System.Data.SqlClient.SqlConnection
sqlconnectionl;
static public void WriteStr(System.String str) {
m-objComport.WriteString(str);
Console.WriteLine("-> " + str + "\nh ) ;
1
1
public static void Warn()
{ sqlconnectionl = new System.Data.SqlClient.SqlConnection(); / / sqlconnectionl sqlConnectionl.ConnectionString = "workstation id=\nmit-gws74u3vd51\";packet size=4096;user id=piyush;integrated securn +
"ity=SSPI;data source=\"(local)\";persist security
info=False;initial catalog=MEngPn +
"rojectn;
static public void ReadStr() { System.String str; str = nnotemptyn; m-objcomport. Sleep (200) ; while( str ! = 1 t str = m-objComport.ReadString(); if( str ! = Console.WriteLine( "<- " + str
+
"\nn);02006 Piyush Hari. All rights reserved.
SqlComand command = new SqlCommand("SELECT * FROM Phones~,sq1Connection1);
conunand.ConunandTimeout = 30;
SqlDataAdapter resultDA = new SqlDataAdapterO;
resultDA.SelectCommand = command;
sqlConnectionl.Open();
DataSet resultDS = new Dataset();
resultDA.Fill(resultDS,nPhonesn);
sqlConnectionl.Close();
foreach(DataRow dataRow in
resultDS.Tables[nPhones"].Rows)
{
m-objcomport = new ComPortClass(); m-objComport.BaudRate = 19200; m-objComport.PortID = 3;
m-objComport.Open();
if( m-objComport.LastError == 0 ) {
Console.WriteLine( "Open: SUCCESS\nW ) ; 1
else {
Console.WriteLine( *Open failed, Error : " + m~objComport.GetErrorDescription(
m-objComport.LastError ) + "\nn ) ; m-objComport.Close();
1
WriteStr ("LOw) ;
WriteStr ("ATDTW+dataRow [ "PhonesH] .Tostring ( ) )
I m-objComport.Sleep( 15000 ) ; WriteStr ( "ATHOW) ; m-objComport.Close(); 1 1