arXiv:hep-ph/9910381v1 18 Oct 1999
VCS above 8 GeV. The Experimental Challenge
1P.Y. BERTIN and Y. ROBLIN
Universit´e BLAISE PASCAL/IN2P3, Clermont-Ferrand FRANCE. and
C.E. HYDE-WRIGHT
Old Dominion University, Norfolk VA USA.
Abstract
We discuss the experimental issues confronting measurements of the Virtual Compton Scattering (VCS) reaction ep → epγ with electron beam energies 6–30 GeV. We specifically address the kinematics of Deeply Vir-tual Compton Scattering (Deep Inelastic Scattering, with coincident de-tection of the exclusive real photon nearly parallel to the virtual photon direction) and large transverse momentum VCS (High energy VCS of ar-bitrary Q2, and the recoil proton emitted with high momentum transverse
to the virtual photon direction). We discuss the experimental equipment necessary for these measurements. For the DVCS, we emphasize the im-portance of the Bethe-Heitler – Compton interference terms that can be measured with the electron-positron (beam charge) asymmetry, and the electron beam helicity asymmetry.
1
Introduction
Exclusive reactions are a very powerful tool to study the transition between weakly interacting quarks at small distances and large distance effects such as the quark confinement responsible for the hadron structure. One of the cleanest ways to tackle this problem is via Virtual Compton Scattering (VCS), even though this reaction is experimentally challenging for a number of reasons. First, the cross-section is small and decreases as Q2or s increases. Furthermore,
the VCS process (ep → epγ) has to be separated from a number of concurrent background processes, often with counting rates several times higher than the VCS itself. Until recently this kind of experiment was not achievable because
1Presented atNuclear and Particle Physics with CEBAF at Jefferson Lab, 3-10 November 1998, Dubrovnik, Croatia.
it requires high beam current, high duty cycle, and low emittance. The advent of CEBAF, enabled us to perform the first VCS experiment above the pion threshold at high Q2 and s. This experiment is currently under analysis.[1] In
the upcoming years this machine will be upgraded to 8 GeV, then 12 GeV and perhaps 24 GeV in the future. In the same time, the ELFE project in Europe is planning to use the existing LEP cavities to build a 30 GeV Machine with similar beam characteristics [2] (high current, high duty cycle and good energy resolution).
In a contribution to the workshop CEBAF at 8 GeV [3] we stressed the ben-efits of the VCS approach. This paper will focus on the experimental challenges for VCS experiments above 8 GeV. Our interest in VCS is twofold:
• Deeply Virtual Compton Scattering (DVCS) corresponding to the diffrac-tion of a virtual photon in the forward direcdiffrac-tion. DVCS[4] [5] [6] allows us to access the Off Forward Parton Distribution (OFPD) directly linked to the non perturbative part of the nucleon. The kinematic domain of DVCS is deep inelastic electron scattering (large s and Q2) with the final
photon produced very nearly in the virtual photon direction. For incident energies of 6 to 12 GeV, the accessible domain is in the quark valence regime (xBj ≈ 0.3).
• The Large PT domain. This is the domain where s is large and the angle
between the real and virtual photons is large (neither near 0 nor near π). Q2 is moderate or even quasi-real. This probes the quark wave function
[6][7].
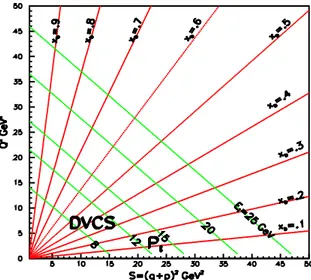
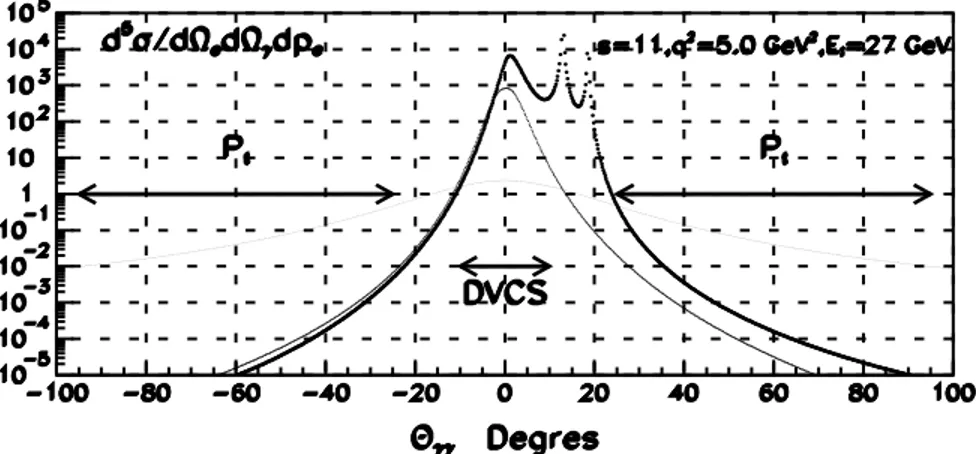
Fig. 1 shows the kinematical domains relevant for DVCS and Large PT. It also
shows the limit on Q2and s given an accelerator energy.
2
Electro-production of a Photon
To the lowest order in α the three graphs in the top panel of Fig. 2 contribute to the electro-production of a photon. Graph (a) is the VCS and graphs (b) and (c) are the Bethe-Heitler (BH) graphs. The latter two are fully calculable if we know the form factors of the proton, and their amplitude is purely real.
Due to the propagator of the virtual electrons and the the virtual photon, three different poles have to be considered in the BH graphs:
ABH∼1t 1 (k − q′)2− m2 e +1 t 1 (k′+ q′)2− m2 e
These poles determine the shape of the BH cross section at high energy. Since the sign of the electron propagators are opposite in the two BH graphs there is a strong destructive interference at the t = (q − q′
)2 pole.
In Fig.3, BH, DVCS, and large PT VCS cross sections are evaluated for
Figure 1: : Ranges in Q2and s accessible with an accelerator of incident energy Ei
+
+
2 BH VCS (a) (b) (c)DVCS =
2 (d)ππ
00 Production.=
ADVCS =
+
+
2 ABH AVCS (e) (f) (g)ππ
0Figure 2: Lowest order diagrams of electro production of photon, pion, or photon plus pion. Top: VCS and BH amplitudes. Middle: π0 electro- production,
which contributes a background ep → epγγ. Bottom, Associated production: ep → eγN∗
(N∗
Figure 3: Cross sections for the ep → epγ process. Heavy dotted line: Bethe-Heitler; Medium line, DVCS; Thin line, Model for Hard Scattering (Large PT)
VCS. The cross sections are plotted as a function of θγγ, the laboratory opening
angle between the virtual photon and emitted real photon directions.
modeled as the product of the DIS distribution functions and the elastic form factors. The cross section for the large PT domain is modeled with the virtual
photon flux and a scaling ansatz for the photo-production cross section: 2π d 5σ dpedΩedtdφγ = dΓ dpedΩe s−6 (30 µ b · GeV10).
We will use these two models to estimate counting rates.
One of the main difficulties of VCS experiments is to be able to measure a cross-section over several (5∼8) orders of magnitude. The dominant contribu-tion is the BH at the two electron poles. At the photon pole θγγ = 0 (t = tmin)
the BH is also larger than VCS. Far away from these poles BH becomes much smaller than the VCS, and the cross section is small (∼ 1 pb GeV−1
sr−2
). The DVCS cross-section by itself is very small and the BH makes up most of the total cross-section in the DVCS regime. Fortunately, it is possible to extract the DVCS using asymmetries to access the interference term between the DVCS and the BH amplitude. This interference has an important contribution to the cross-section since the BH amplitude is large. This enhancement of the DVCS with the BH is the key to the measurement of the DVCS. There are two kinds of asymmetries that we can use:
• The lepton charge asymmetry, • The beam polarization asymmetry
2.1
Lepton charge asymmetry
This asymmetry is measured by the difference in the cross section for a negative or positive incident lepton (electron to positron):
• The VCS amplitude (diagram (a), Fig. 2) TV CS is anti-symmetrical under
a charge conjugation, there is only one coupling on the lepton line. • The BH amplitude (diagrams (b and c), Fig. 2) TBH is symmetrical, there
are two couplings onto the lepton line.
Therefore, the interference term between the BH and the VCS in the cross section is the only term contributing to an electron-positron asymmetry [6]
d5σe−
− d5σe+ =∼ 4ℜ[TV CS· TBH]
This asymmetry is a direct measure of the VCS amplitude since the BH ampli-tude is fully calculable.
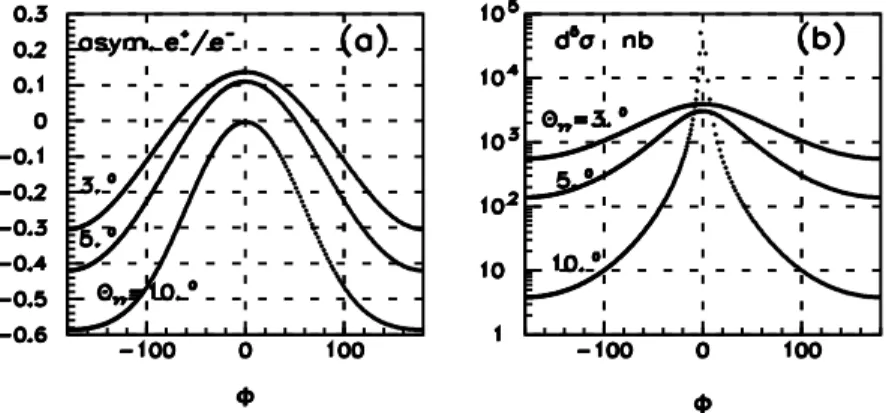
We use in the following the asymmetry: Ae+/e− = d 5σe− − d5σe+ d5σe− + d5σe+.
We give in Fig. 4 the value of this asymmetry for three angles between the virtual photon and the real photon θγγ. It is plotted against the azimuthal
angle φ between the leptonic and the hadronic plane. This figure is for an incident beam energy of 8 GeV, s=8 GeV2 and Q2= 3 GeV2. From the figure
we see that the asymmetry is large for small angles of the real photon relative to the virtual photon direction.
We think it is very interesting to use this characteristic and that is why we propose to build at CEBAF and at ELFE a positron beam. We will come back on this point later.
2.2
The beam polarization asymmetry.
Another interesting observable is the beam helicity asymmetry ABeam =d
5σ→
− d5σ←
d5σ→+ d5σ←
produced with a polarized beam. This asymmetry is defined by the ratio be-tween the difference and the sum of the cross-sections obtained when reversing the beam longitudinal polarization. Here also, the interference between the BH amplitude and the VCS is the only term contributing (assuming the longitudinal VCS amplitude is much smaller than the BH).
This was pointed out in the case of large PT by P. Kroll et al. [7][6] and
af-terwards applied by M. Diehl et al [8] and PAM Guichon and M. Vanderhaeghen [6] in the case of the DVCS.
Figure 4: (a) Asymmetry versus azimuthal angle φ induced when the sign of the beam is changed (electron/positron beam). The plot is given at three angles θγγ = 3◦, 5◦ and 10◦. (b) The cross section dσ/(dkedΩedΩlabγγ) in nb / (GeV
sr2) at the same angle. For φ = 0, the emitted photon lies in the scattering
plane, closer to the beam than the virtual photon direction. The curves are calculated with the model of Ref. [6]. We have chosen the kinematic at s = 8 GeV2, Q2=3 GeV2and an incident Energy E
i= 8 GeV.
Figure 5: (a) Asymmetry versus angle induced when the sign of the longitudinal polarization of the beam is reversed . The plot is given at three angles θγγ 3, 5
and 10 degrees. (b) The cross section at the same angle. We have chosen the kinematic at s=8 GeV2, Q2=3 GeV2and an incident energy E
We give in Fig. 5 the value of this asymmetry, for the same kinematics as in Fig. 4. The asymmetry deviates slightly from a pure sin φ behavior, due to the structure of the BH amplitude. This asymmetry is maximal out of plane (φ = ±90 deg) and is zero when the photon angle θγγ is zero.Unfortunately the
cross section is maximum when θγγ is zero. The beam helicity asymmetry will
require a larger integrated luminosity to achieve the same precision as the beam charge asymmetry.
3
Experimental Equipment
In order to select VCS events (DVCS or large PT) one must make sure to select
photon electro-production events. To do that we can use the squared missing mass. We need to know:
• the incident particle - that is why it is so crucial to have a good quality beam;
• the scattered electron - it fixes the virtual photon;
• the recoil proton and/or the photon produced. The choice to detect the recoil proton and/or the photon will be fixed by the kinematics and the level of resolution needed.
If the photon is not detected, it is necessary to separate the missing mass zero (photon missing mass) from the pion mass. The squared missing mass resolution must be
∆MX2 ≤ Mπ2.
If we measure the photon (instead of the proton), the resolution we require on M2
X is much looser:
∆M2
X ≤ (MP+ Mπ2) − Mp2∼ 2MpMπ.
There is a factor of twenty between the required resolution on the squared missing mass in the two cases.
The best case will be when the photon is detected and measured (momentum and direction) and the proton detected (position only). In this case we can use not only a missing mass technique, but also require coplanarity conditions on the virtual photon, the recoil proton and the photon.
3.1
The Background Problem
There are two main sources of background. The π0 electroproduction: ep →
epπ0 (diagram d, figure 2), and the pion associated production with photon
electroproduction: ep → eγN∗
3.1.1 The π0 electro-production.
The graph of the π0electro-production is the d graph of the figure 2. When the
π0 decays with a photon emitted in the forward direction, the second photon
from the π0is backward and has a very low energy (few MeV). The final products
of this reaction are nearly the same as a VCS event except for a soft backward photon which is very difficult to detect at an electromagnetic machine. The missing mass technique is unable to solve the problem either. The π0 events
are partially removed by a coplanarity cut on triple epγ coincident events. The solution for the remaining π0 events is to record in the calorimeter events with
the π0 decay at 90 degrees in the centre of mass. The two photons are emitted
in the forward direction with comparable energies and their opening angle is θπ
γγ ≥ 2mπ0
Pπ0 . Using these events we can infer the π0 cross section and subtract
its contribution from the events with only one photon recorded.
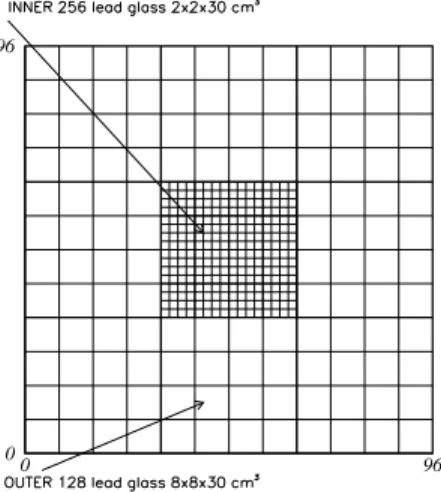
0 96
0 96
Figure 6: Calorimeter concept with high inner granularity to record DVCS events and coarser outer granularity to record two photon events from the ep → epπ0 reaction.
In the figure 6 we give an example of a composite calorimeter. The inner part, with a small granularity to collect the VCS events, the outer part with a bigger granularity to collect the two photons events from the π0 decay.
In the DVCS kinematics the π0 production:
• Decreases as 1/Q6, faster than the DVCS which decreases as 1/Q4.
• Has no interference with BH, contrary to the VCS which is amplified by the BH when the quadri-transfer t is small.
• Has no beam charge-dependent asymmetry. Thus this background van-ishes identically in Ae+
/e−
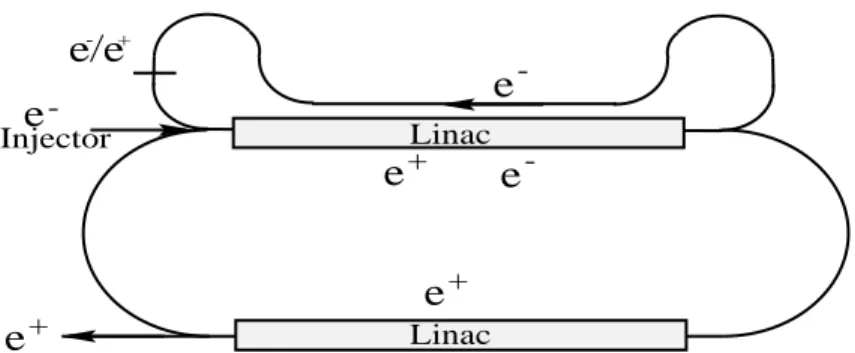
- +
e/e
Injectore
-e
+e
+e
+e
-Linac Linace
-Figure 7: Possible setup of a positron beam at CEBAF.
We should point out that the π0 cross section is in itself a very interesting
result. In DVCS kinematics, it is sensitive to another combination of the off forward parton distribution [9].
3.1.2 The Associated Pion Production.
Another parasitic reaction is the associated pion production at the photon electro-production. The corresponding graphs are Fig. 2 e, f and g. The last two graphs (f and g) are the associated pion production with the BH process (ABH). The A-BH process can be exactly predicted, given knowledge of the p → N∗
transition form factors (instead of the proton form factors as in the VCS). The third graph (AVCS) is the pion production in the VCS. It leads to the same final state as the e and f graphs and therefore the three graphs interfere.
The physics of associated production in DVCS (f) is just as important as the physics of the DVCS process. For example, for pion-nucleon system at the mass of the ∆ (or higher N∗
) A-DVCS gives access to some of the N → N∗
transition OFPD’s. However it is not so simple to extract the A-DVCS amplitude since, in this case A-BH is no longer purely real but has an imaginary part as well (because of the intermediate on-shell N∗
state). Close to the pion threshold (πN system in s-wave) a low energy theorem can be built to relate the p → Nπ OFPDs to the elastic OFPDs.
Under the charge change of the lepton, the associated pion production has an asymmetry similar to the DVCS case.
If the proton is not detected, the associated pion production can appear in either the π0P or π+n final states. If the recoil proton is detected, only the π0
channel is open.
3.2
Positron beam
We have pointed out the interest of the charge asymmetry. But to access this information we need a positron beam. Several techniques can be used such as radioactive sources but the main technique is to produce positrons on a heavy material target. This yields positrons of about 60 MeV, which are then collected
Parameters SLC94 NLC-II CEBAF Electron Beam Drive
Electron Energy (GeV) 30 6.22 0.5 Bunches by pulse 1 75 Repetition Rate (Hz) 120 120 Bunch Intensity (e− ) 3.5 · 1010 1.5 · 1010 Pulse Intensity (e− ) 3.5 · 1010 113. · 1010 Intensity (e− / sec) 4.20 · 1012 1.35 · 1014 1.00 · 1015 Intensity (µA) 0.67 21.6 160 Beam Power (KW) 20.2 134 80 Positron Collection Yield (e+ per e− ) 2.4 2.1 ∼ (a) 0.04 (b) 0.17 Intensity (1014e− /s) 0.108 2.84 (a) 0.4 (b) 4.3 Intensity (µA) 1.7 45.8 ∼ (a) 6.4 (b) 27 Table 1: Positron production from the SLC-94 and the Next Linac Collider II[10]. The estimation for CEBAF is obtained by scaling with the CEBAF beam power (a) on SLC, or (b) on the future project NLC-II, which increases the parameter of the positron collection.
and injected into the Linac. This does not require any significant changes in the Linac setup. (Fig. 7). Positrons can just be injected into the Linac with a RF phase difference of 180◦
relative to the electrons. The positron yield is proportional to the electron beam power on the conversion target. Table 1[10] lists the parameters of the positron source used at the SLC, the parameters of the source for the Next Linear Collider (NLC). The CEBAF extrapolation is obtained by scaling theto the CEBAF beam power on the conversion target. [10]. We have given for CEBAF two extrapolations (a) and (b) based the SLC number and the NLC Project. This latter give a larger positron yield due to an improved positron collection. We can conclude that a positron beam is realistic for CEBAF. Because the asymmetry is large we do not need rapid switching from electrons to positrons. We need to switch the beam (reverse the polarity of the arc magnets) approximately once every 100 hours.
The following modifications needs to be done on the beam line to provide a positron beam:
• A new magnet at the end of the north Linac, • a beam transport line in the north tunnel,
• a room for the positron target, and the optics to collect the positrons, • a 80 KW beam dump for 0.5 GeV beam
3.3
Electron spectrometer
When one detects the scattered electron one must overcome two difficulties: • Reach small angles to do the physics of interest
• Have enough solid angle to insure high counting rate.
This must be done keeping a high momentum acceptance (∆PP = 5 − 10%) and a momentum resolution of 10−4.
It is not difficult to go at small angles but this is often at the expense of the solid angle. For example, experiment E154 at SLAC reach θe = 5.5deg with a
solid angle Ω= .5 msr, and θe=2.75deg with Ω= .15 msr. Several solutions are
possible to boost the solid angle while still being at small angles:
• use of cos nθ magnets such as was proposed by P, Vernin et al. for the ELFE project [11] or in this conference [12]or by J.M. Finn & Al. [13] for 8-12 GeV at CEBAF. This solution gives a good spectrometer acceptance (Ω=6.8 msr) and ∆P
P = 20% in the case of ELFE project at 15 GeV .
• use of Septum magnet. This is currently being build by the INFN group for the CEBAF HRS. It will be possible to reach 6deg with a solid angle of Ω=6 msr.
• If a smaller angle is desired (smaller then 1deg), this can be done using a setup using quadrupoles, like the Møller setup in the experimental hall A.
3.4
Photon calorimeter
The specifications of the photon calorimeter are very different if we consider physics at large momentum transfer or DVCS kinematics. The next two sections list the requirements on the apparatus for each type of experiment.
3.4.1 Large PT H(e, e′pγ)
In this case the main purpose of the calorimeter is to suppress the accidentals in the reaction. It must be used at very high luminosity (1 − 2 · 10+38cm−2
s−1
) and will be placed at large angle (50 deg). It does not need high energy resolu-tion (30-50 %), rather it must have a large acceptance coverage (1.5 sr). This calorimeter can be shielded from the low energy gamma rays, and can be close to the target. It can be built in lead/chamber or lead/plastic sandwich. The fact that it must be able to remove accidentals requires a moderate granularity. That granularity needs to be somewhat better if it is necessary to identify the π0decay. The two decay photons are separated by an angle of θ
γγ =2mPπ0
π0 . This
is roughly two degrees at s = 20 GeV2, Q2= 5 GeV2 and an incident energy of
27 GeV, the photon energy at the maximum PT=2.1 GeV is q′ = 6.6 GeV. If
the granularity is good enough one can also use it for coplanarity cuts (requiring that the detected photon, the recoil proton and the VCS virtual photon all lie in the same plane)
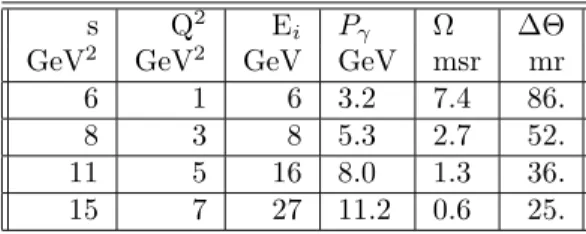
s Q2 E
i Pγ Ω ∆Θ
GeV2 GeV2 GeV GeV msr mr
6 1 6 3.2 7.4 86. 8 3 8 5.3 2.7 52. 11 5 16 8.0 1.3 36. 15 7 27 11.2 0.6 25.
Table 2: Minimum Calorimeter acceptance Ω required to measure the π0
electro-production cross section to subtract it from the DVCS. We also give the required separating power ∆Θ of two photon in the calorimeter to resolve both photons in π0→ γγ.
3.4.2 DVCS
In this case the calorimeter will be placed in a forward direction (10–20 deg) where the electro magnetic background coming from the target is a limiting factor for the luminosity, a few 1037 cm−2s−1 instead of 1038 cm−2s−1. The
calorimeter solid angle is also much smaller (10 msr) than in the case of large PT. This is just a fact of the Jacobian. But if we want solve the missing photon
from the π0 decay this acceptance must be increased to cover the two photons
decay of the π0 :
Ωπγγ≫ (
2mπ0
Pπ0
)2.
One must stress again that if we work with charge asymmetry, (electron-positron) then the electro-production of π0 is gone (it does not contribute to
the asymmetry) and our only worry is the associated pion production. To distinguish between the associated pion production and the H(e, e′
γ)p reaction we need an energy resolution on the photon:
∆Pγ ≪
Mpmπ
PX
or we have to detect the recoil proton to check for coplanarity.
In the figure 8 we give on a plot (s,Q2) the required photon resolution for
one sigma separation of the p and N π final states in the H(e, e′
γ)X reaction. In order to estimate the precision of the energy measurement of the photon, we consider three kind of crystals:
• Lead tungstate used on the CMS calorimeter [14] giving a resolution when the crystal is seen by APD:
σE
E = .035 + .036 √
E
• F101 Radiation Resistant Lead Glass [15]. The resolution σE
Figure 8: Photon resolution on a plot Q2 vs. s.
is obtained with a preshower compensation.
• CsI(Ti) used by BaBar at SLAC [16]. The resolution is σE E = .012 + .01 4 √ E
This calorimeter is without any doubt one of the best on the market. If we want to go at higher energy we can use a pair spectrometer with a converter and a magnetic field.
From the figure 8 we can see that at moderate s (smaller then 10 GeV2) it is
possible to build a calorimeter meeting all the specifications for the DVCS. High luminosity will be the main issue for the calorimeter, mainly in the forward angle where the electro-magnetic background coming from the target will be large (Møller, Radiative Møller, scattered electrons...). Several tests done in HALL A for the RCS experiment 97-108 have already shown that working at a luminosity of few 1037cm−2 s−1is possible. In order to deal with the pile-up
in the calorimeter we will use a new technology based on high speed sampling (1 GHz) on the calorimeter channels.
3.5
Proton detector
There are two different approaches for the proton detectors depending on what we want to measure:
• In the case of VCS at Large PT we use the reconstructed proton
momen-tum to build the missing mass and identify the reaction. This means one needs a high resolution spectrometer (the same level of performances one has in the electron arm). A design with cos nθ magnets is discussed in [11],[12].
Figure 9: Recoil proton angle versus emitted photon angle in the laboratory frame for the H(e, e′
pγ) reaction. Both angles are measured relative to the virtual photon direction.
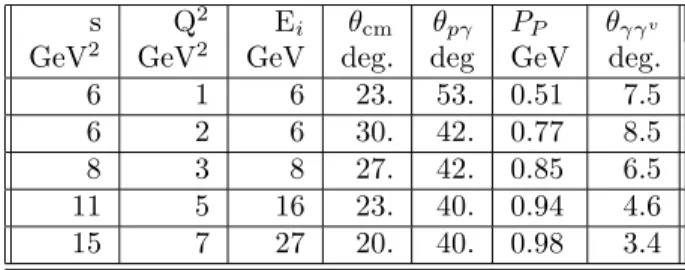
s Q2 E
i θcm θpγ PP θγγv
GeV2 GeV2 GeV deg. deg GeV deg.
6 1 6 23. 53. 0.51 7.5 6 2 6 30. 42. 0.77 8.5 8 3 8 27. 42. 0.85 6.5 11 5 16 23. 40. 0.94 4.6 15 7 27 20. 40. 0.98 3.4
Table 3: Kinematics of the maximum angle θLabP γv between the proton and the
virtual photon, in the H(e, e′
pγ) reaction.
• In the case of DVCS we may only need to perform coplanarity tests. It is possible to chose kinematics such that the angle θlab
P,γv between the recoil
proton and the virtual photon in the laboratory frame is large. The Center of mass angle corresponding to this kinematic is small and this is a DVCS kinematics (small t). The figure 9 shows some possible kinematics at several incident energies and Q2 and S.
Table 3 gives several examples of DVCS kinematic computed at the maxi-mum angle in the lab between the proton and the virtual photon. At this angle the Jacobian J = d ΩcmP
d Ωlab P
is maximal (meaning our CM solid angle is maximal).
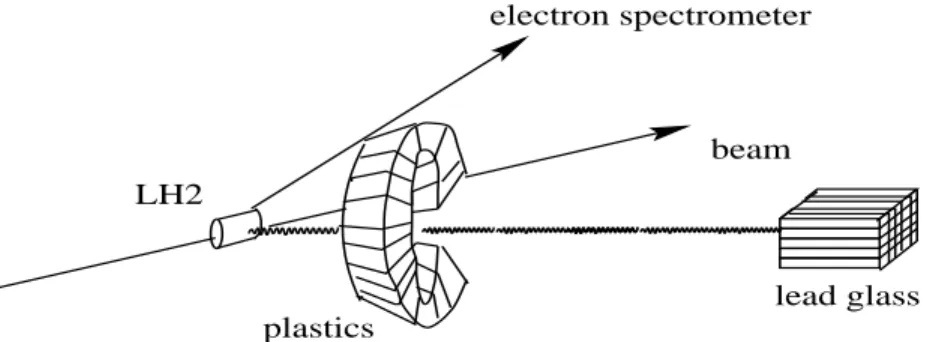
electron spectrometer
beam
lead glass plastics
LH2
Figure 10: Proposed experimental setup for DVCS.
GeV has a range of 20 g cm−2 in iron. This implies that we can
shield the proton detector from low energy particles without losing in efficiency on the proton detection. Since most of the high noise counting rate is at low energy this also has the benefit to allow us to use high luminosities.
2. The angle between the virtual photon and the real photon is small. Thus, we can place the photon calorimeter in the direction of the virtual photon. This calorimeter can have a small angular acceptance and we will still be able to catch the real photon. The optimum position is a tradeoff between this angle and the electron spectrometer acceptance.
3. The angle of the proton and the virtual photon is large (40 degrees for the smallest in the table). The virtual photon is close to the forward direction, (10-20 degrees) the proton detector however will be farther thus, less sensitive to background allowing us to work at high luminosities.
• The solution proposed for the photon calorimeter to solve the pile-up prob-lem based on sampling at 1 Gigahertz will nicely improve the detection of the proton also.
Finally, we can propose the experimental setup sketch presented in the figure 10. The proton detector is a ring of plastic scintillators located around the di-rection of the virtual photon. The ring is partially open in the forward didi-rection to let the beam and the scattered electron through.
In Figs. 11,12 the plots a) shows the separation between p(e, e′
γ)p and p(e, e′
γ)N∗
achievable using only the electron and the photon information. The plots b) & c) show the discriminatory power of the coplanarity distribution us-ing a proton array to measure p(e, e′
γp)X events. The plots b) & c) are without and with a cut on the missing mass obtained in a).
Figure 11: Missing mass plot and acoplanarity spectra for the e + p → e + γ + p and e + p → e + γ + Nπ reactions. Kinematic is at Q2=3 GeV2, S=8 GeV2, 8
GeV incident energy. The electron spectrometer HRS is at 19.9 Degrees with a solid angle of 6 msr. The inner photon calorimeter is located at -11.9 degrees and its solid angle is 40 msr. The density of the events on this plot is just given by the phase space, there is no cross-section weighting. a) Missing mass squared for H(e, e′
γ)X. b) Out of plane angle between final photon and proton for H(e, e′
γp) and H(e, e′
γp)π0reactions. c) Same as b), but with cut on missing
mass spectrum of a).
Figure 12: Missing mass plot and acoplanarity spectrum. Kinematic is at Q2=5
GeV2, S=11 GeV2, 27 GeV energy incident. The electron spectrometer is a
new spectrometer at 5.7 degrees with a solid angle of 2 msr. The inner photon calorimeter is located at −10.0 degrees and this solid angle is 40 msr. The density of the events on this plot is just given by the phase space, there is no cross-section weighting. The plots are the same as in Fig. 11.
Figure 13: Localization of the proton in a plane perpendicular to the mean vir-tual photon direction, 30 cm from the LH2 Target. Kinematic is at Q2=3GeV2,
S=8 GeV2, 8 GeV energy incident. The electron spectrometer HMS is at 19.9
Degree with a solid angle of 8 msr. The inner photon calorimeter is located at -11.9 degrees and this solid angle is 40 msr. Note that the density of the event is just given by the phase space. The proposed array of proton detectors is also illustrated.
Figs. 13,14, show the intercept of the recoil protons with the plane defined by the array of scintillators. Plots a) and c) show DVCS events, plots b) and d) show the associated production events. Plots a) and b) are for all of the the corresponding events, Plots c) and d) are after the cut on missing mass from Figs. 11,12 is applied. The protons of the DVCS and the associated events do not have the same distribution. The phase space (4 body) of the associated production events is evenly spread on the acceptance whereas the DVCS events are concentrated at a ring on the edge of the phase space. This is even more marked if we require a cut on the missing mass obtained with the electron and the photon.
Fig. 15,16,17 give for three kinematics the expected yield for measurements of the beam-charge and beam-helicity asymmetries. This simulation was done using the code “BITCH” [17], which takes into account the resolution of the spectrometer, the multiple scattering in the target, and the DVCS cross section model of Ref. [6]. It must be noted that in the two lowest energy settings (6 and 8 GeV) the electron spectrometer corresponds to the CEBAF HRS spectrometer. At 16 and 27 GeV the angular acceptance is much smaller. The calorimeter is a lead glass calorimeter with a preshower compensation. No attempt was made to optimize the size of this calorimeter for counting rate (at 6 and 8 GeV the counting rate can be increased by using a bigger calorimeter surface.) These asymmetries contain the physics of the off forward parton distributions. The Q2
evolution (at fixed xBj) of these asymmetries is a direct test of the theoretical
framework of DVCS, independent of any model of the OFPD [8].
4
Experimental Details for Large P
Tphysics
In Table 4, we give the counting rate by day for several incident energies and kinematics. Since the large PT domain can be reached by two symmetrical
kinematics around the virtual photon it is possible to place the proton spec-trometer in the same side (relative to the electron beam) (positive angles) the electron spectrometer. The photon calorimeter is then placed in the opposite hemisphere (negative angle). We can chose a center of mass angle not too far from 900which maximize the P
T. If we want to increase the solid angle, (linked
to the proton jacobian dΩcm/dΩ
p) we can put the calorimeter in the backward
direction. This will also decrease the electro magnetic background allowing us to work at higher luminosities.
We have assumed a low angular acceptance of the electron spectrometer (2.5 msr) compatible with the small angles. Since the proton spectrometer is at larger angle we have taken the HRS CEBAF spectrometers solid angle acceptance.
The purpose of the photon calorimeter is only to add a third arm coincidence to reject accidentals. Therefore, it does not need high energy resolution. It can be done with a sandwich of lead and plastic scintillators. A lead sheet placed in front to protect it from low energy X-ray and photons. We will then just set a threshold on this calorimeter response to get rid of the low energy noise.
Figure 14: Localization of the proton in a plane perpendicular to the mean virtual photon direction, 30 cm from the LH2 Target. Kinematic is at Q2=5
GeV2, s = 11 GeV2, 27 GeV energy incident. The electron spectrometer is a
new spectrometer at 5.7 degree with a solid angle of 2 msr. The inner photon calorimeter is located at -12.9 degrees and this solid angle is 40 msr. Note that the density of the event is just given by the phase space.
Figure 15: Expected asymmetry (a) with the polarization of the beam (b) with the beam charge, in 400h Hour of beam time at a Luminosity of 1037cm−2s−1.
Kinematic is at Q2=3GeV2, S=8 GeV2, 8 GeV energy incident. The electron
spectrometer HMS is at 19.9 degrees with a solid angle of 8 msr. The inner photon calorimeter is located at -11.9 degrees and this solid angle is 40 msr. The definition of φ is the same as in Figs. 4,5
Figure 16: Expected asymmetry (a) with the polarization of the beam (b) with the beam charge, in 400h Hour of beam time at a Luminosity of 1037cm−2s−1.
Kinematic is at Q2=2 GeV2, S=6 GeV2, 6 GeV energy incident. The electron
spectrometer HMS is at 22.4 degrees with a solid angle of 8 msr. The inner photon calorimeter is located at -11.9 degrees and its solid angle is 40 msr
Figure 17: Expected asymmetry (a) with the polarization of the beam (b) with the beam charge, in 400h Hour of beam time at a Luminosity of 1037cm−2s−1.
Kinematic is at Q2=5 GeV2, S=11 GeV2, 27 GeV energy incident. The electron
spectrometer is new spectrometer at 5.7 degrees with a solid angle of 2 msr. The inner photon calorimeter is located at -12.9 degrees and its solid angle is 40 msr proton acceptance. dΩγ = dΩp× (dΩ
cm
dΩp )(
dΩγ
dΩcm).
For the large PT reaction the associated BH amplitude is small, and will be
not enhanced by ABH. This means it will be smaller than in the DVCS case so it should not be a problem. On the other hand the pion electro production is becoming relevant in this kinematic. We will use missing mass cuts to select our events. The missing mass will be constructed with the scattered electron and the recoil proton. If this is not enough, then we can use the photon calorimeter granularity for coplanarity cuts. The acoplanar events will be used to obtain the π0 cross section. We will then subtract their contribution to the coplanar
events to get a clean signal.
The counting rate are given by day. It must be noted that in this example we tried to reach the highest s and the biggest Q2. However the cross section
and the counting rate decrease as s−6. Going from s = 15 GeV2 to s = 12
GeV2 increases the counting rate by a factor 3.8. Decreasing Q2 increases the
counting rate also.
5
Conclusion
We have shown that experimentally from 6 to 27 GeV it is possible to access the VCS, the DVCS and the VCS at Large PT. For the DVCS up to s ≤ 15GeV2
and Q2
≤ 7 GeV2 (for xBj ≈ 0.3). We have also shown that for the large PT
VCS (PT = 1.9 GeV) we can reach s = 15 GeV2and Q2=2 GeV2. We have also
θγγcm PT θlabγ θlabp Pp d 5 σ dPedΩcm dΩcm dΩlab γ dΩcm dΩlab p N
deg GeV deg deg GeV GeV srpb 2 day
−1
Ei= 8 GeV, s = 8 GeV2, Q2= 0.5 GeV2, θe= 7.22◦, pe= 3.9 GeV
90 1.25 +27.6 −35.7 2.22 .406 3.12 5.1 120 120 1.08 +49.6 −24.7 3.57 .406 1.07 8.5 200 Ei= 12 GeV, s = 10 GeV2, Q2= 1.0 GeV2, θe= 6.43◦, pe= 6.6 GeV
90 1.44 +22.2 −33.5 3.31 .139 4.0 6.1 82 120 1.24 +42.0 −23.5 4.60 .139 1.28 10.6 149 Ei= 27 GeV, s = 11 GeV2, Q2= 5.0 GeV2, θe= 5.7◦, pe= 18.9 GeV
60 1.32 −25.5 +15.4 2.78 .085 15.7 4.9 149 70 1.43 −28.2 +11.9 3.41 .085 12.8 6.6 160 Ei= 27 GeV, s = 15 GeV2, Q2= 2.0 GeV2, θe= 3.6◦, pe= 18.4 GeV
120 1.58 +32.7 −20.7 7.03 .041 1.78 15.4 175 90 1.82 −31.7 +13.9 4.96 .041 6.05 8.2 96 Table 4: Large PT: Counts obtained in 1 day, with a beam of 80. µA, 10 cm
of liquid hydrogen target, an electron spectrometer of 2.5 mr and a momentum acceptance of ±2.5% and an acceptance of 7 mr for the proton spectrometer. The detection of photon is assumed to match the acceptance of the proton spectrometer.
at this level of accuracy (CEBAF), momentum (SLAC) and background (RCS studies at CEBAF). It is also evident that a positron beam would be a big advantage for DVCS. We believe that it is technically possible to have such a beam at CEBAF. It is almost a requirement for the new ELFE machine to be able to deliver both electrons and positrons beams since so much physics can benefit from it.
6
Acknowledgments
We thank P.A.M. Guichon, M. Vanderhaeghen, A.V. Radyushkin, and M. Diehl for many fruitful discussions, and for their interest in developing this physics. We want to point out especially P.A.M. Guichon who gave us the code we used to evaluate the DVCS and BH processes. P.Y. B. and Y. R. have done this work for the European network (HaPHEEP). The work of C.E.H.-W. was supported by the U.S. Dept of Energy and N.S.F.
References
[1] G. Audit, et al., Jefferson Lab Experiment E93050 /http://www.jlab.org/˜ luminita/vcs.html
[2] G. Geschonke and E. Keil CERN SL/98-060(rf)
[3] C. Hyde-Wright and P.Y. Bertin, Workshop on Physics and Instrumenta-tion with 6-12 GeV Beams, TJNAF, June 1998: http://www.jlab.org/ user resources/usergroup/proceedings/papers/hyde wright.pdf
[4] X. Ji, Phys.Rev.Lett 78 (1997) 5511, Phys.Rev. D 55 (1997) 7114. [5] A.V. Radyushkin, Phys.Lett.B 380 (1996) 417, & 385 (1996) 333 [6] P.A.M. Guichon and M. Vanderhaeghen, Prog.Part.Nucl.Phys 41 (1998) [7] P. Kroll, M. Schurmann and P.A.M. Guichon, Nucl.Phys. A598 (1996) 435 [8] M. Diehl, et al., Phys.Lett.B 411 (1997) 183.
[9] M. Guidal and M. Vanderhaeghen, Workshop on Physics and Instrumen-tation with 6-12 GeV Beams, TJNAF, June 1998: http://www.jlab.org/ user resources/usergroup/proceedings/papers/guidal.pdf
hep-ph/9901298.
[10] “The NLC Positron Source” H. Tang et al. SLAC-PUB-6852
[11] P. Vernin et al. The ELFE Project: an Electron Laboratory for Europe ,Mainz, 7-9 October 1992;Italian Physical Society conference proceedings 44 (1993), ed. J.Arvieux and E. De Sancti, p. 503;
[12] P. Vernin, contribution at the CEBAF at Dubrovnik 98 Workshop, Oct. 1998.
[13] J.M. Finn, Hall A Workshop on CEBAF at Higher Energies, 1998. [14] G. Alexeev, et al., Nucl.Inst. Meth. A385 (1997) 425.
[15] H. Avakian et al., Nucl. Instr.and Meth. A378 (1996) 155. [16] F. Bianchi, et al., Nucl.Instr. and Meth. A384 (1996) 67. [17] P.Y. Bertin, computer code BITCH for VCS simulation.
![Table 1: Positron production from the SLC-94 and the Next Linac Collider II[10]. The estimation for CEBAF is obtained by scaling with the CEBAF beam power (a) on SLC, or (b) on the future project NLC-II, which increases the parameter of the positron collec](https://thumb-eu.123doks.com/thumbv2/123doknet/13970762.453670/10.918.201.708.186.455/positron-production-collider-estimation-obtained-increases-parameter-positron.webp)