HAL Id: in2p3-00024409
http://hal.in2p3.fr/in2p3-00024409
Submitted on 21 Dec 2006HAL is a multi-disciplinary open access
archive for the deposit and dissemination of sci-entific research documents, whether they are pub-lished or not. The documents may come from teaching and research institutions in France or
L’archive ouverte pluridisciplinaire HAL, est destinée au dépôt et à la diffusion de documents scientifiques de niveau recherche, publiés ou non, émanant des établissements d’enseignement et de recherche français ou étrangers, des laboratoires
Structure of low-lying states of
10,11C from proton elastic
and inelastic scattering
C. Jouanne, V. Lapoux, F. Auger, N. Alamanos, A. Drouart, A. Gillibert, G.
Lobo, A. Musumarra, L. Nalpas, E. Pollacco, et al.
To cite this version:
C. Jouanne, V. Lapoux, F. Auger, N. Alamanos, A. Drouart, et al.. Structure of low-lying states of
10,11C from proton elastic and inelastic scattering. Physical Review C, American Physical Society,
Structure of low-lying states of
10,11C from proton elastic and
inelastic scattering
C. Jouanne, V. Lapoux,∗ F. Auger, N. Alamanos, A. Drouart, A. Gillibert,
G. Lobo,† A. Musumarra,‡ L. Nalpas, E. Pollacco, J-L. Sida, and M.Trotta§
CEA-SACLAY DSM/DAPNIA/SPhN F-91191 Gif-sur-Yvette, France. Y. Blumenfeld, E. Khan, T. Suomij¨arvi, T. Zerguerras
Institut de Physique Nucl´eaire, IN2P3-CNRS, F- 91406 Orsay, France
P. Roussel-Chomaz, H. Savajols
GANIL, Bld Henri Becquerel, BP 5027, 14021 Caen Cedex, France A. Lagoyannis, A. Pakou
Department of Physics, The University of Ioannina, 45110 Ioannina, Greece Chmpn. (Dated: May 12, 2005)
Abstract
To probe the ground state and transition densities, elastic and inelastic scattering on a pro-ton target were measured in inverse kinematics for the unstable 10C and 11C nuclei at 45.3 and 40.6 MeV/nucleon, respectively. The detection of the recoil proton was performed by the MUST telescope array, in coincidence with a wall of scintillators for the quasi-projectile. The differen-tial cross sections for elastic and inelastic scattering to the first excited states are compared to the optical model calculations performed within the framework of the microscopic nucleon-nucleus Jeukenne-Lejeune-Mahaux potential. Elastic scattering is sensitive to the matter root mean square radius found to be 2.42 ±0.1 fm and 2.33 ±0.1 fm, for10,11C, respectively. The transition densities from cluster and mean-field models are tested and the cluster model predicts the correct order of magnitude of cross sections for the transitions of both isotopes. Using the Bohr-Mottelson prescrip-tion, a profile for the10C transition density from the 0+ ground to the 2+
1 state is deduced from the
data. The corresponding neutron transition matrix element is extracted : Mn= 5.51 ± 1.09 fm2.
PACS numbers: 23.20.Js,25.40.Ep,25.60.-t,27.20.+n
∗E-mail: vlapoux@cea.fr; URL: http://www-dapnia.cea.fr/Sphn/Exotiques
†permanent address :Geel
‡permanent address :INFN-Laboratori Nazionali del Sud, Via S. Sofia 44, 95123 Catania, Italy
I. INTRODUCTION
For stable nuclei, proton and neutron ground state density distributions usually display similar behaviours. In a first approach, the neutron density can be considered as propor-tional to the proton density in the ratio N/Z. The proton density can be obtained from the charge distribution measured experimentally through electron scattering [1]. Nevertheless, it was suggested that, provided a high enough excitation energy, clustering effects could be found in the light stable nuclei. In 1968, K. Ikeda [2] built a diagram based on the mass excess of the nuclei. He suggested that clusters could be formed in a nucleus for excitation energies in the vicinity of the fragment emission thresholds. These cluster fragments were constituted by alpha particles, like in the three alpha-cluster in 12C which was located at an
excitation energy close to 7.27 MeV.
A renewed interest for the clustering in light nuclei has been prompted by the availability of radioactive beams far from stability. Recently a new scheme was proposed (Von Oertzen-Ikeda’s rule) [3], and predictions were given for stable and radioactive nuclei. It was assumed that bound covalent molecular structures might appear in neutron-rich nuclei for an excita-tion energy close to the fragmentaexcita-tion thresholds for alpha, neutrons or other clusters. The predictions for stable nuclei are in agreement with the available experimental observations, like the formation of an alpha-chain in 12C at high excitation energy [4] and the structure
of 8Be in two alpha-particles.
In weakly-bound nuclei, with low energy particle emission thresholds, alpha-clustering is expected to be found at lower excitation energies than for stable isotopes. The important role that alpha-clustering should play for the beryllium, boron and carbon chains is underlined in Ref. [3], based upon the results obtained within the Antisymmetrized Molecular Dynamics (AMD) [5] framework. This model was applied to neutron-rich nuclei, from lithium to carbon, and suggest important alpha-clusterization phenomena for light neutron-rich nuclei. For instance, for the carbon chain, in the framework of AMD, the shape of the neutron distribution is found to be strongly dependent on the neutron number and varies rapidly from prolate to spherical or oblate. The nuclei 10,11C, like all the other carbon isotopes
described in AMD theory [5] are expected to have a proton density for the ground state with an oblate deformation, and a different shape for the neutron density : prolate for 10C
shapes for proton and neutron densities.
The neutron-deficient 10C and 11C are short-lived nuclei, with half-lives of 19 s and
20 min. Their low-lying spectroscopy is relatively well-known [6], as shown in Fig.1, where the excited states below the proton separation threshold, Sp=4.01 MeV for10C and 8.69 MeV
for 11C, are shown. From interaction cross section experiments, and via Glauber-model
calculations, proton and neutron rms radii were indicated for 10C [7] : r
p = 2.31 ± 0.03 fm
and rn= 2.22 ± 0.03 fm, and for 11C [8] : rp = 2.13 ± 0.06 fm and rn= 2.10 ± 0.06 fm.
The transition strength B(E2,0+ → 2+
1) for 10C is known from Doppler shift
measure-ments, with an adopted value of 61.5 ± 10 e2.fm4 [9]. For11C the low-lying excited states are
also known but the transition strengths from the ground to the first excited states have not been measured. In this article, the structure of10,11C is investigated through (p,p’)
measure-ments. As shown for the 6He(p,p’) reaction performed at 40 MeV/nucleon [10], when the
measured angular range is limited to 75 deg in the center of mass (c.m.) frame (75◦
c.m.), the
elastic scattering is rather insensitive to details of the ground state density like the presence of a halo. These features are better investigated through proton inelastic scattering which is sensitive to the shape of the density [11, 12]. Knowing the proton transition strength, it is possible to deduce the neutron transition strength from (p,p’) measurements. Using this probe, with10,11C radioactive beams, we can obtain direct structure information for the 10,11C nuclei (matter root mean square radius, low-lying spectroscopy).
The analysis of the inelastic scattering to the first excited states is performed within the framework of a microscopic interaction potential including theoretical neutron and proton ground state (gs) and transition densities. It allows us to test the description of these nuclei, in terms of the mean-field approach and the AMD cluster structure model, and also to deduce interesting features of the density profiles. In the case of the 10C, the E2 electromagnetic
(EM) transition rate B(E2) for 0+ → 2+
1 is known, and also the corresponding B(E2) value
(related to the square of the proton transition matrix element Mp) for the mirror transition
in10Be. Usually, following the prescription from Bernstein, Brown and Madsen [11], charge
symmetry and charge independence are assumed, and the mirror symmetry is applied to obtain the neutron transition matrix element Mn from the EM decay rate of the mirror
transition. In Ref. [11], this method was checked for several mirror nuclei, of masses ranging from A = 17 (17O,F) to A = 42 (42Ca,Ti). They showed that the M
n value for a given
transition matrix Mp value, obtained for the corresponding transition in the mirror nucleus.
This transition rate is measured using an EM probe.
Using radioactive beams, it is possible to check the mirror symmetry method for a wider range of isospin values, by investigating the transitions for mirror nuclei far from stability, for neutron-rich or neutron-deficient species. Recently, it was done in [13], where the mirror method was successfully checked for the A = 32 T = 2 multiplet. In contrast, the isospin symmetry breaking was suggested for the A=38 nuclei in [14] and the A = 30 T = 1 multiplet [15]. Furthermore, in the case of light exotic nuclei, for a mirror pair composed by a neutron-deficient and a neutron-rich nucleus, like 10C and 10Be, this symmetry may
be questioned. These nuclei have a large difference between neutron and proton numbers, compared to their stable isotopes, the particle threshold energies are low, inducing stronger coupling to excited states in the continuum, and the large Coulomb effect in the case of
10C (Z/N =1.5) may contribute to a significant violation of the mirror symmetry. In the
present work, the Mn factor for10C will be deduced directly from the (p,p’) measurement,
and compared to the Mn value given by the mirror symmetry. This will allow to check the
validity of the mirror assumption.
In the following, we present the experiment carried out at the GANIL facility to study the elastic and inelastic scattering to the first excited states, below the proton separation threshold, for the nuclei 10,11C. In order to test the analysis procedure, elastic and inelastic
scattering of 12C on proton was also measured.
In Section II, the production of the beams and the experimental set-up are detailed. In Section III, the microscopic nucleus-nucleon interaction used to analyze the elastic scattering on protons is described. It is calculated using the microscopic, complex and parameter-free JLM potential [16]. This potential is used to perform the Distorted Wave Born approximation (DWBA) calculations leading to the inelastic (p,p’) cross sections. The JLM calculations are first applied to our reference case, the 12C(p,p’) cross sections. The
theoretical ground state and transition densities of 10,11C provided by the AMD model [17]
and by the HF+BCS and Quasiparticle-Random Phase Approximation (QRPA) formalism are examined in Section IV. They are used to generate the microscopic JLM potential included in the (p,p’) calculations.
Conclusions on the structure of the neutron-deficient radioactive carbon isotopes are given in Sec. V.
II. EXPERIMENTAL SET-UP
The elastic and inelastic differential cross sections of 10,11C on a proton target were
measured with the MUST [18] telescopes. MUST (“MUr `a STrips”, wall of strips) is an array devoted to the inverse kinematics measurements of direct reactions induced by heavy ion beams on light target (proton, deuton targets).
We detail below the beam production, the detection system including the MUST array, the plastic wall for fragment detection and two “CATS” beam tracking detectors. A sketch of the experimental device in the reaction chamber can be found in Fig.2.
A. Beam production and identification
The10,11C secondary beams were produced successively by fragmentation of a 95 A.MeV 12C beam delivered by the two GANIL cyclotrons, on a 1710 mg/cm2 (1930 mg/cm2 for 11C)-thick carbon production target located between the two superconducting solenoids of
the SISSI device (Superconducting Intense Source for Secondary Ions) [19, 20].
This device is located at the exit of the second cyclotron and at the entrance of the beam analysing α-spectrometer. It allows for an improved collection and transmission of the secondary beams to the different experimental areas. A 0.2 mm thick mylar degrader was put in the Alpha-spectrometer in order to purify the secondary beam. The beam purity was checked by a 300 µm-thick Si detector located inside the chamber, using the ∆E energy loss versus Time of flight (TOF) method. The TOF was taken between a microchannel plate (mcp) detector, located at the exit of the Alpha spectrometer, and the time given by the particle detected in the Faraday plastic (Fig.2) at a distance of 64 m from the mcp.
After purification, the 10C beam had no contaminant whereas the 11C represented
around 75% of the total secondary beam, with 12C as main contaminant. The intensities
of the 10,11C secondary beams on the reaction target were of the order of 5. 105 and 5. 106
B. Beam profile
As the emittance of a radioactive beam produced by fragmentation is large, the beam spot usually covering 1 cm2 on the target with a maximum angular divergence of 1◦, two position
sensitive detectors, the low pressure multi-wire trajectory chambers CATS [21] (“Chambres `a Trajectoires de Saclay”, Trajectory Chambers of Saclay), were used to improve the defini-tion of the posidefini-tion of the incoming ion on the target. They provided the beam posidefini-tion and time tracking particle by particle. CATS1 and CATS2 were located at 159.2 cm and 27.5 cm upstream of the target (distances between detectors and target are given in Fig. 2). These detectors measured event by event the horizontal (H) and vertical (V) positions perpendic-ular to the beam axis providing the impact point and the incident angle of the particles on the target with a FWHM resolution of 1.1 mm (H), 1.2 mm (V) and 0.1◦. Figure 3
presents the profiles of the 11C beam at 40.6 MeV/n on the two CATS detectors and the
resulting beam profile reconstructed on the proton target. The counting rate was reduced to 3. 105 pps for both10C and11C beams in order to use these beam tracking detectors under
standard conditions. These detectors were required to obtain a good angular resolution for the scattering angle and enough excitation energy resolution to separate the excited states of 11C. We will show in Sec. II E that their use is necessary to separate these states.
C. Proton detection
The experimental apparatus MUST [18], an array of eight three-stage telescopes, 6 × 6 cm2 each, specifically designed to detect light charged particles was used to measure
angular distributions for elastic and inelastic scattering of10,11C radioactive beams on proton.
Using the MUST array, similar measurements were done for oxygen isotopes [22] and 6He
nucleus [10]. The first stage is a 300 µm-thick double-sided Si-strip detector (DSSD) which provides horizontal and vertical positions, time-of-flight with respect to a beam detector and energy loss of the recoil proton ; the second 3 mm-thick Si(Li) stage gives the proton energies up to 25.4 MeV and the third stage of 1.5 cm-thick CsI detects protons up to 75 MeV. The MUST detectors were assembled in a wall configuration which was located at 15 cm from the target, and the vertical axis of the wall was rotated by an angle of 63 deg. (63◦
lab) with
angular range between 45 and 90◦
lab. At this distance, the 1 mm wide strips result in an
angular resolution of 0.4◦ for the detection of the scattered particle, in the laboratory frame.
For the less energetic recoil particles which are stopped in the first Si-stage, like protons with energies below 6 MeV, the separation between p,d, triton and 3,4He is operated with
the energy E versus TOF technique. The particles are identified in the correlation plot constructed between their energy loss ∆E in the Si-strip detector and their TOF. This TOF is measured between the Si-stage and the start given by the passage of the incident particle in the second beam tracking detector CATS. The overall time resolution was 1.4 ns. In Fig.4 the left panel presents the E-∆E plot, where the events for p,d and t are shown by the lines, and the right one shows the E-TOF correlation spectrum, the selection of the events for protons is shown by the contour.
For energies higher than 6 MeV the protons punch through to the 2ndstage, and the
iden-tification is performed by the E-∆E method between the energy deposited in the SiLi stage and the ∆E energy loss in the Si-stage. A typical plot is shown in Fig. 4. At 25.4 MeV the proton punches through the 3mm-thick SiLi and is detected in the CsI. In this experiment, the energy threshold for the measurement in the first Si-stage was 1 MeV. For the different sets of data, the angular range in the c.m. frame is from 10◦
c.m. to 50◦c.m., determined by the
detection of the protons from 1 MeV up to 25.4 MeV (the data presented here correspond to events for which the protons are stopped in the first two telescope stages) and for angles between 45 to 90◦
lab in the laboratory.
D. Detection of the ejectile
In order to select the reaction channel and to eliminate background, the recoiling proton was detected in coincidence with the ejectile in the forward direction. The ejectile was detected in a plastic wall, located 75 cm behind the target and made of 6 horizontal bars of BC408, 8 × 50 cm2 and 3 cm-thick. Each bar was read out by a photo-multiplier on
both sides. For the most forward angles where the counting rates are very high, a small 2.8 cm-diameter plastic scintillator (referred as the Beam plastic in Fig. 2) was centered at zero degrees to collect, identify and count the beam particles. The identification of the heavy projectile in the Faraday plastic is presented in Fig.5 in the case of the 11C incident
The coincidence with the ejectile allows to suppress the protons coming from reactions induced by the beam contaminants on the target, and also the protons emitted from excited nuclei produced in central collisions of the beam on the carbon contained in the target. Moreover, to check the background due to the carbon content in the target, a measurement on a carbon target is also carried out during the experiment as will be explained in Sec. II F. Elastic and inelastic angular cross sections of10,11C(p,p’) were measured on a 1.48 mg/cm2
and a 8.25 mg/cm2-thick polypropylene target (CH
2CHCH3)n (density of 0.896 g/cm3).
E. Kinematics and excitation energy spectra
To measure angular distributions down to 10◦
c.m.where the energy of the recoiling protons
decreases to 1 MeV, the 1.48 mg/cm2-thick polypropylene target was used. Good statistics
at larger angles were obtained by using the 8.25 mg/cm2-thick target. The events considered
to build the kinematical spectra, and afterwards to extract the (p,p’) cross sections, are those for which there is a proton in coincidence with the heavy ejectile, and a particle detected in CATS 1 and 2 providing the incident trajectory and the beam profile shown in Fig. 3. The excitation energy spectra are calculated from the kinematical properties of the scattered protons. In Fig. 6 the left spectrum presents the kinematical plot of the scattered proton obtained in the case of the reaction p(11C,p’) at 40.6 MeV/nucleon on the 1.48 mg/cm2
polypropylene target : it is the correlation matrix of the proton energy Elabp versus its scattering angle θlabp . The right panel shows its projection as the 11C excitation energy E∗
spectrum. This spectrum is constructed from the scattering angle given by the MUST array, without taking into account the incident angle given by the CATS detectors. The 11C beam
impact is considered as point-like and perpendicular to the target. The curve drawn in the matrix corresponds to the kinematical loci of the elastic scattering. Only one peak-structure at zero excitation energy appears and the other expected peaks, corresponding to the excited states of 11C are not resolved.
Now, in the reconstruction of the proton scattering angle, we take into account event by event the impact point and the incident angle of the beam on the target. We present in Fig. 7 the results obtained for 12,11,10C(p,p’) applying this reconstruction method, the left
column shows the scattering plots, and the right one the projected excitation energy spectra. The spectra obtained for 11C are presented in the second line, they correspond to the same
events as those considered to construct the spectra shown in Fig. 6.
Taking into account the beam profile, it is now possible to separate clearly the different excited states in the (θlabp ; Elabp ) matrix and in the excitation energy E∗ spectrum in Fig. 7.
The full width half-maximum (FWHM) of the peak corresponding to the elastic scattering events has decreased from about 3.4 MeV (Fig. 6) to 700 keV for 11C (Fig. 7).
The upper plots of Fig. 7, for slowed down primary beam 12C at 36.3 MeV/nucleon
and a 8.25 mg/cm2-thick target, shows that the ground and first excited states 2+ and
3− are clearly identified. Their centroids are located at 20 keV, 4.46 MeV and 9.70 MeV
respectively, in excellent agreement with the values tabulated in [6] : 0, 4.44 and 9.64 MeV. The 0+ state located at 7.65 MeV is weakly excited. The FWHM of the ground state peak
is 940 keV.
In the second line of Fig. 7, for 11C(p,p’) events on the 1.48 mg/cm2-thick target, the
calculated kinematical curves are drawn for the elastic scattering, and inelastic scattering from ground to the 1/2−, 5/2− and 7/2− states (curves from right to left). We observe the
ground state 3/2−, the excited states 1/2−, 5/2− and 7/2− at the respective energies of 13
keV, 2.02 MeV, 4.33 MeV and 6.50 MeV. The tables (Fig.1) give the excited states at 2.00, 4.32 and 6.48 MeV respectively. Here, the 11C ground state width is 680 keV (FWHM).
The resolution depends on the target thickness, especially for low energy protons emitted at small c.m. angles. When the 8.25 mg/cm2-thick target is used, the resolution is degraded
to 970 keV.
The lower plots in Fig. 7 are obtained for 10C(p,p’) events on the 1.48 mg/cm2 target,
with selection of the 10C in the plastic wall and protons in MUST. The ground state for 10C is observed at 23 keV and the first state 2+ at 3.36 MeV (adopted value 3.35 MeV).
The energy resolutions of the ground state peaks are 720 and 990 keV for the 1.48 and 8.25 mg/cm2 targets, respectively. No structure above the one-proton separation energy
(8.7 MeV for 11C, 4 MeV for 10C) can be seen due to the imposed coincidence with 11C
(10C) in the plastics.
These results demonstrate the importance of measuring event by event the impact point and the incident angle of the beam particles, in order to reconstruct with enough precision the scattering angle of the proton, when using beams of poor optical qualities. This recon-struction method provides the centroids of the peaks with a precision, around 20keV, which is excellent for a charge particle measurement.
F. Cross sections
The numbers of incident particles for the 10C+p scattering measurements on the 1.48
and 8.25 mg/cm2 polypropylene targets were 7.14 109 (11C : 1.02 1010) and 2.1 109 (11C :
6.66 109) pps, respectively. In Fig.7, for 10C (lower right panel) the background is small, we
show below that a good separation between the ground and the 2+ states can be operated. To determine the background induced in the energy excitation spectra by the carbon content in the polypropylene target we performed a measurement with a 6 µm-thick car-bon target. Due to the good selection of the ejectile and of the proton in coincidence, this background contributes for less than ± 0.5% to the global systematical error bar on the background subtraction. To evaluate the whole background subtraction in the energy excitation spectrum, we have evaluated the angular distribution of the background and of the elastic scattering for a similar range of excitation energy. From the comparison of the cross sections for various angular slices we evaluated the global error bar on the background subtraction to ± 1 %.
For all the experimental angular distributions which will be presented in the next section, the error bars given are statistical. We have estimated the overall value for the systemat-ical error bars in the angular distributions. They come from the detection efficiency and reconstruction process, which gives ± 3 % total uncertainty (including the effect of the sub-traction of the background ± 1 %), the target thickness (± 5%) and the number of incident particles (± 2%). This results in a total systematic error (± 6%) which is the main error on the normalization of the extracted elastic and inelastic differential cross sections.
The angular distributions for the proton elastic and inelastic to the 2+ state (4.44 MeV)
of 12C can be seen in Fig.8. No data point is given between 24◦
c.m. et 30◦c.m. for the elastic
scattering, this is due to the energy threshold effect of 1 MeV produced by the SiLi detectors of the second stage of MUST, which results in a bad estimation of the proton energy. Consequently we do not give the cross sections corresponding to the protons in this specific region. For the scattering of 10C and11C the same effect will be found.
III. NUCLEON-NUCLEUS INTERACTION POTENTIAL
A. JLM potential
The nucleon-nucleus potential used in this study is the microscopic, complex and parameter-free JLM (Jeukenne, Lejeune, Mahaux) potential [16], parameterized for incident energies up to 160 MeV. This potential is based upon infinite matter calculations, and it is built on the Reid hard-core Nucleon-Nucleon interaction, using the Brueckner-Hartree-Fock approximation.
The local complex potential UJLM(ρ, E)(r) = V (ρ, E)(r) + iW (ρ, E)(r) is derived in the
case of a finite-size nucleus of density ρ(r), (neutron and proton densities ρn and ρp) by
applying the Local Density Approximation (LDA). This LDA is improved by folding the potential by a Gaussian function exp[−~r2/t2] to take into account the short-range of the
nuclear interaction, and with t fixed to 1. fm (see in [23] for details).
The potential depends on the incident energy E and on the neutron and proton densities of the nucleus. This potential allows a good reproduction of large sets of nucleon-nucleus data [23–26]. In order to fit the nucleus-nucleon data, the JLM potential UJLM may need
to be slightly modified, by varying the normalization factors λV and λW for the real V and
W imaginary parts :
UJLM(ρ, E)(r) = λVV (ρ, E)(r) + iλWW (ρ, E)(r) (1)
For A ≥ 20, the variations of λV and λW are usually less than 10% ; these factors are close
to 1 for all A ≥ 20 stable nuclei. In the case of light nuclei (A ≤ 20), it was shown that usually λW = 0.8 [24]. We adopt this renormalization as the standard normalization of
JLM for light nuclei.
B. (p,p’) inelastic scattering
The inelastic (p,p’) angular cross sections are obtained through DWBA calculations in-cluding the JLM potential. They are performed with the TAMURA code [27].
The entrance, transition and exit channel potentials are defined with the ground state and transition densities. The normalization of the real and imaginary parts is fixed with the values obtained in the analysis of the elastic scattering. For a Ji to Jf transition the
density is written : ρtr
= hΨf|δ(−→r −−→r0)|Ψii. The calculated inelastic (p,p’) cross sections
are sensitive to the Mn and Mp factors, which are the radial moments of the transition
densities, defined as :
Mp,n =
Z
rl+2ρtrp,ndr (2)
where l is the multipolarity of the transition. The Mp factor for a Jito Jf transition is directly
related to the corresponding B(El) transition strength value obtained by an electromagnetic experiment (Coulomb excitation, electron scattering or lifetime measurements). We adopt here the following convention for the relationship between |Mp| and B(E2) :
B(E2, Ji → Jf) = e2
1
(2Ji+ 1)|M
p|2 (3)
The models of elastic and inelastic scattering on proton including the JLM potential were proven to be reliable to extract the fundamental quantities such as Mn/Mp without
ambiguity for the stable nuclei [23] as well as for the exotic nuclei [22, 25]. A careful analysis of the elastic scattering is required in the case of weakly-bound nuclei in order to have a correct treatment of the coupling effects, as will be explained in Sec. III D.
A simple analysis of the (p,p’) can be performed using the Bohr-Mottelson prescription (also ascribed as the phenomenological Tassie form in Ref. [12]) for the densities. The proton (p) or neutron (n) transition density is then obtained by derivating the ground state density :
ρtr,lp(n)(r) = −αlp(n)rl−1dρp(n)
dr (4)
The proton density is normalized with the αl
p by requiring that its moment |Mp| should
satisfy Eq. 3 with B(E2) obtained by electromagnetic measurements. |Mn| is then deduced
by adjusting the calculated (p,p’) cross sections on the data.
C. 12C(p,p’) as a test reaction
During the same experiment, the proton elastic and inelastic scattering from 12C were
measured in inverse kinematics, using a12C degraded beam produced at 36.3 MeV/nucleon.
The experimental conditions (beam line, settings of the telescope array) were the same as for
10,11C data taking. Since other 12C(p,p’) measurements at various energies are available in
the efficiency of our detection system, the reconstruction procedure and the background subtraction. It can be compared to the previous data, measured from 31 to 46 MeV/nucleon in direct kinematics. Moreover, since 12C is a stable N=Z nucleus for which the densities
were measured, a JLM calculation can be done using these densities and compared to the set of12C data.
The ground state proton density of12C is parameterized as a two-parameter Fermi (2pF)
function :
ρ = ρo
1
1 + exp{(r − Ro)/a}
(5) with the radius Ro = 2.1545 fm, diffuseness a = 0.425 fm and ρo = 0.207 fm−3. These
parameters were adjusted in Ref. [28] to reproduce closely the charge rms radius [29] deduced from elastic electron scattering measurements, and the diffuseness of the matter density distributions obtained from shell model calculations [28]. The rms radius is of 2.3 fm, close the empirical rms radius of the proton distribution (2.33±0.01 fm) obtained from the charge density distribution unfolded from the charge distribution of the proton. The same density is assumed for neutrons.
The JLM potential is calculated for the various energies using this 2pF density and the same set of normalization factors λv = 1 and λw = 0.8, which are standard for the light
stable nuclei [24]. The resulting calculations for the elastic scattering are presented in Fig. 9 and compared to the data obtained in direct kinematics at 31 MeV [30], 35 MeV [31] and 40 MeV [32]. The JLM calculation is compared to the elastic data we have obtained in inverse kinematics at 36.3 MeV/nucleon in Fig. 8. We obtain a good agreement between the whole set of data and the microscopic calculations done at various energies. This means that our reconstruction method is correct and the efficiency is well estimated.
We measured also the inelastic scattering to the first 2+ excited state at 4.44 MeV.
We calculate the inelastic scattering using the Bohr-Mottelson prescription to build the transition density for 12C. The proton transition density is a derivative of 2pF function (as
given by Eq. 4). With the adopted B(E2) value equal to 41 ±5 e2.fm4 [33], the |M
p| moment
of the proton density deduced from Eq. 3 is equal to 6.40 ± 0.4 fm2. From |M
p| = 6.40
fm2 we can fix the normalization of the proton transition density via the integral calculated
from Eq. 2. Like the ground state densities, the neutron and proton transition densities are assumed to be identical.
distri-bution is reproduced with the JLM DWBA calculation, within the error bars. This result shows that the subtraction of the background is well operated, and that the systematical errors on the inelastic cross sections in Sec. II F are correctly estimated.
D. Coupling effects in the case of weakly-bound nuclei
It has been shown [34] that the angular distributions of6He on proton at energies ranging
from 25 to 75 MeV/nucleon, are well reproduced, using the JLM optical potential, provided the real part of the potential be renormalized by a factor 0.8. The origin of this effect was discussed in Ref. [35] : to calculate the interaction potential for elastic scattering, one should include all possible virtual couplings between the ground and excited states. These processes remove flux from the elastic channel. This effect is negligible for stable nuclei, but increases for weakly-bound nuclei. In particular, for exotic isotopes with low particle emission thresholds the coupling between the ground state and the continuum is expected to play an important role. The interaction term arising from couplings to inelastic channels is called the dynamical polarization potential (DPP). It is complex, non-local and energy-dependent [36]. Its exact calculation requires the precise knowledge of the spectroscopy of the nucleus and of the transition strengths to bound and continuum excited states. It is thus difficult to evaluate and is not taken into account in the usual optical model approaches as discussed in Ref. [35]. For that reason, we prefer to approximate its effect in a simpler way with a reduction of the real volume potential V, that is λV smaller than 1. Indeed, it
was explained in Ref. [37] that a complex surface potential, with a repulsive real part, is expected to simulate the surface effects generated by the DPP. This was found appropriate to understand the elastic scattering data for the6Li projectile on various targets. The effects
induced by the DPP were shown to correspond roughly to the reduction of the real part [37]. Recently, the need for a DPP to analyze the elastic scattering data of the weakly-bound 6He
IV. PROTON ELASTIC AND INELASTIC SCATTERING FOR CARBON ISO-TOPES
A. Structure models
We consider two models to generate the densities, AMD [5, 17] and Hartree-Fock formal-ism with BCS correlations. For this latter model, three types of Skyrme effective interaction were used for the particle-hole (p-h) channel : SIII [39], SGII [40] and Sly4 [41]. A con-stant gap pairing interaction was used. The transition densities are then calculated with the QRPA which allows to take into account the pairing effects in excited states. The detailed description of these calculations can be found in Ref. [22].
B. Ground state densities
The neutron and proton ground state density distributions calculated within AMD[17] or HF + BCS models are presented in Fig. 10 in linear (left column) and logarithmic (right) scales to view the variations at small and large radii, respectively. The first plots, a. and b. present the comparison between proton and neutron densities for AMD model. The HF + BCS densities with SIII, SGII et SLy4 are presented in Fig. 10 c. d for the proton, and in Fig. 10 e. f for the neutrons. We can compare the neutron and proton ground state densities for the AMD and HF + BCS calculations of 10C. AMD predicts a proton density
with a maximum not located at the origin, which is consistent with the clustering of 10C in
two α particles and two protons found in this model. In Fig. 11, the same representation is adopted for the 11C ground state densities.
The parameters of the densities (rms for neutron, proton and matter densities) are displayed in Tab. I and II, for 10C and11C respectively.
C. 10C elastic scattering
In Fig. 12, the elastic scattering data for10C are compared to the calculations using the
JLM potential and densities given within the AMD model and the HF + BCS framework. All the calculations with the standard normalization λV = 1.0, λW = 0.8 (dotted line)
ground state and the continuum which remove flux from the elastic channel, as seen in Section III D. We simulate that effect by reducing the real part of the potential. The best agreement with experimental data was obtained with a renormalization of the real part of JLM by a factor λV = 0.92, as shown in Fig.12 with the thick solid lines. Taking into
account the normalization error on the data, the λV range is λV = 0.92 ± 0.03. We adopt
the central value for the analysis. In this case, a good description is obtained with the HF densities, using the SIII and SGII effective interactions.
The angular distribution is correctly reproduced except for the large c.m. angles which are underestimated in the AMD model and HF + BCS with the SLy4 effective interaction. Since these two calculations are associated with the largest rms matter radius, it means that a slightly smaller rms radius is needed. The HF + BCS densities (SIII and SGII) allowing the best reproduction of the elastic angular distributions gave a neutron rms radius of 2.3 ± 0.01 fm and a larger proton rms radius of 2.5 ± 0.03 fm. In the following subsection we will discuss the sensitivity of the elastic scattering to the matter rms radius.
D. Sensitivity of the method and extraction of the rms radius for 10C
Since the angular range in our measurement does not exceed 50◦
c.m., the elastic cross
sections are mainly sensitive to the matter rms radius. This is illustrated in Fig. 13a. by a calculation done using, for simplicity, gaussian-function densities for 10C with two different
values rm= 2.3 or 2.45 fm. Fig. 13b presents calculations using two densities of the same
rm = 2.45 fm, having the same (thick line) or different (dashed line) values for the neutron
and proton radii. Obviously, elastic scattering data are not sensitive to these small differences in the neutron-proton densities. For 10C the HF+BCS(SGII) densities give a satisfactory
agreement. They can easily be fitted by a 2pF function. Consequently, to deduce the rms of the 10C from the data, we use the 2pF parameterization from Eq.5 for the proton and
neutron density distributions, and the parameters of the radius Ro, diffuseness a and ρo are
obtained applying the following prescriptions : ρo is calculated in order to normalize the
proton and neutron densities to the values of the neutron N and proton Z numbers of 10C,
Ro and a are fixed initially to the value of the experimental 12C proton density (Sec. III C),
then they are varied so as to provide a profile for the proton and neutron distributions close to the HF+BCS (SGII) densities, and same proton and neutron rms radii as the ones of
SGII densities (given in Tab.I).
The final parameters of the fitted 2pF densities are given in Tab.III. The rms radii of these functions are close to those of the initial densities, those are 2.31 fm for neutrons and 2.50 fm for protons. The rms radius of the resulting matter density is rm = 2.42 fm.
From calculations with 2pF functions which correctly reproduce the angular distribution, we deduce the central value and error bar on the rms value : rm =
√
< r2 >
m = 2.42 ± 0.10
fm.
The error bar takes into account the statistical error on data, the uncertainty on λV and
the different values obtained in calculations which reproduce equally well the data. This extracted value is within the same range as the 12C one, showing that the 10C nucleus has
a similar matter extension, even with less neutrons than 12C.
The AMD ground state densities do not give a good description of the elastic scattering at the large angles, but this can be due to the underestimation of the correlations between alpha-clusters, resulting in an overestimation of the neutron extension, and then of the matter rms radius. The HF+BCS calculation, validated by the elastic data, predicts for rp
significantly larger values than for rn in Table I.
E. 11C elastic scattering
In the same way as for 10C, we need a reduction of the real potential, here with λ V =
0.90 ± 0.03, to reproduce the 11C + p elastic scattering distribution at small c.m. angles,
whatever the adopted densities, either from AMD or HF + BCS models. The comparison between the data and these calculations is shown in Fig. 14.
However the data at larger angles are not reproduced in any calculation, suggesting a rms matter radius smaller than expected. Since the elastic scattering in the angular range we measured is not sensitive to the difference of shape between neutron and proton as shown in Sec.IV D, the ground state density is parametrized with a 2pF function with the same geometry for the neutron and proton densities. We adopt the same procedure as used for
10C density, and deduce the 2pF parameters for proton and neutron densities providing the
best agreement with the elastic data. These parameters are displayed in Tab.III. This allows also to obtain the matter rms radius for 11C : r
m = 2.33±0.1 fm, very close
cross sections [8].
For10C, as well as for11C, the best agreement with the data is obtained using densities
having a smaller rms radius than the one predicted by the AMD calculations. A 2pF profile with parameters adjusted to reproduce the data was found to provide a satisfactory agreement.
F. 10C inelastic scattering to the first 2+ states
The elastic cross sections provide the entrance channel potential used throughout the analysis of the inelastic cross sections. For the whole inelastic scattering analysis, and to calculate the elastic and transition form factors, the λV factor deduced from the elastic data
will be fixed to 0.92 for 10C and to 0.90 for 11C.
Different densities are considered here to calculate the JLM potentials : the AMD pre-dictions and the QRPA densities plotted in Fig. 15. The corresponding |Mn|, |Mp|, B(E2)
and Mn/Mp values are given in Tab.IV. The transition density from the first 0+ state
to the first 2+ state in 10Be has already been calculated in the AMD framework [42]. In
these calculations, B(E2; 0+1 → 2+1) = 55 e2fm4 in 10Be, close to the experimental value :
B(E2; 0+1 → 2+1) = 52.5±5 e2fm4[9]. The authors assume mirror symmetry between10C and 10Be to calculate the B(E2; 0+
1 → 2+1) of10C, found in their model to be equal to 45 e2fm4.
By analysing the intrinsic state of the wave function of the main component, they found that the deformations of proton and neutron are different, larger for the proton density than for the neutron one, deformed as triaxial. This AMD B(E2) is at 1.6σ from the experimental value, higher than the predicted QRPA B(E2) values. All these calculations underestimate the known B(E2) value, even though the error bar on B(E2) are large. In Fig.16, using AMD and QRPA, the JLM calculations for the inelastic scattering to the first 2+ excited state
at 3.35 MeV are compared to our data. Neither the AMD transition densities [5] nor the QRPA incorporated in our JLM calculations allow to reproduce the inelastic (p,p’) data.
The experimental adopted B(E2) value is known, B(E2) = 61.5 ± 10 e2.fm4 [9], and the
proton integral can be deduced from Eq.3 : Mp = 7.84 ± 0.64 fm2. A possible approach
could be to use the AMD or the QRPA densities and to renormalize the calculated proton transition density to the experimental value of Mp (Eq. 2). The normalization of the neutron
The proton and neutron excitations in AMD are rather close to the experimental values (see Tab. IV), but since the elastic data analyzed using the AMD ground state densities were not reproduced at larger angles (Sec. IV C) we choose to deduce the Mn value using a
parameterization for the neutron and proton transition densities.
We proceed to determine the Mnvalue using the Bohr-Mottelson prescription, formulated
in Ref. [12] : the ground state densities are derived according to the Tassie formula (Eq.4), in order to obtain the transition densities. These ground state densities are chosen according to the results explained in Sec. IV D. Since the HF+BCS densities with SGII interaction were validated by the elastic scattering data (with λV = 0.92), and the 2pF functions
adjusted on these densities were found to be consistent with the data, for simplicity, we can use this parameterization of the proton and neutron ground state densities to generate the transition densities. The normalization of the proton transition density is fixed on the Mp
central value Mp = 7.84 fm2, and the neutron normalization can be adjusted on the (p,p’)
data or fixed on a given value, to test different assumptions.
In Fig. 17, we show calculations, with the same renormalized proton transition density (Mp = 7.84 fm2), and two different |Mn| values : a reasonable agreement is obtained with
the ratio |Mn|/|Mp| = N/Z (short dashed line) while the best agreement corresponds to
|Mn|/|Mp| = 0.70 ± 0.08 (solid line). Taking into account the error bar on the |Mp| value
and on the extraction of the Mn/Mp value from the data, we deduce |Mn| = 5.51 ± 1.09 fm2.
This is in contrast with the AMD and QRPA models which both predict a ratio Mn/Mp
greater than 1. The experimental result indicates that the contribution to the excitation from the protons is larger than from neutrons, as can be expected from the Z/N ratio.
The AMD calculation directly assumes mirror symmetry in the T=1 A=10 isospin dou-blet to deduce the neutron densities of 10C from the proton density of 10Be. The
pre-diction of the B(E2) is closer to the experimental value than the ones from the QRPA model, but the neutron excitation is clearly overestimated : Mn(AMD) = 7.42 fm2. The
Mn/Mp(10C) ratio can be merely calculated by assuming the mirror symmetry : we consider
Mn(10C) = Mp(10Be), with Mp(10Be)= 7.245 ± 0.345 fm2, deduced from the experimental
B(E2) value (52.5 ± 5. e2fm4), and we obtain M
n/Mp(10C)= Mp(10Be)/Mp(10C) = 0.92 with
an error bar of ±0.13. Comparing this ratio to the one deduced from (p,p’), and the Mnvalue
from mirror symmetry, equal to 7.245 ± 0.345 fm2, to the measured |M
the mirror symmetry is not fulfilled in the T = 1, A = 10 nuclei 10Be and 10C.
The full discussion of the symmetry breaking effects between 10Be and 10C will be the
subject of a forthcoming article devoted to the quantitative tests on proton and neutron transition matrix elements of 10C and 10Be.
G. 11C inelastic scattering to the 5/2− and to the 7/2− states
If we consider the spectroscopy of 11C in Fig. 1, we can see that, around 4.5 MeV, two
excited states can be found, a 5/2− at 4.3 and a 3/2− at 4.8 MeV. In the energy range
from 6 to 7 MeV we have also several states as shown in Fig. 1 : 1/2+, 7/2−, 5/2+. In
Fig. 7, the comparison of the peaks observed for11C(p,p’) with the 2+ peak obtained for10C
shows similar widths. Moreover, considering the experimental resolution measured on the elastic peak (700 keV), we can assume that one state of the doublet is mainly contributing to the (p,p’) excitation between 4 and 5 MeV, that is, the 5/2− ; between 6 and 7 MeV,
we attribute the peak to the 7/2− state. In the following, to discuss the 11C cross sections,
we assume that the (p,p’) reaction at 40 MeV/nucleon mainly selects the transitions from ground to 5/2− (4.3 MeV) and to 7/2− (6.48 MeV) states.
These transitions are expected to be electric quadrupolar E2 transitions in the AMD model. The values of the moments |Mn|, |Mp| and B(E2) obtained with these densities can
be found in Tab. V. The proton and neutron transition densities from AMD are presented in Fig. 18. It should be noted that, clearly, it cannot be expected that the simple QRPA model could provide a good treatment of the excited states of such a light odd-even nucleus as 11C. The time-reversal symmetry is broken and the blocking approximation should be
careful treated. The theoretical cross sections have been calculated with the JLM potential including AMD densities. Using these predicted E2 transitions, the calculated (p,p’) an-gular distributions are found to be consistent with the shape of the experimental anan-gular distribution presented in Fig. 19. The AMD densities allow to give the correct order of magnitude for the cross sections. The reproduction of the experimental cross sections is satisfactory.
However, in contrast with the analysis done for10C, since the experimental B(E2) values
are not known, the inelastic scattering data cannot give access to the |Mn| factor, it only
mean-field models (for instance the present QRPA), with no specific treatment of the light odd-even nuclei, the predicted |Mn|, |Mp| and B(E2) values are very small. Then, the
resulting JLM calculations using these mean-field transition densities underestimate strongly the inelastic cross sections. For both transitions, the AMD model was found to give a rather good agreement with the data, which would validate the AMD model, in spite of some disagreement with the elastic scattering data due to a too large rms matter radius. The Coulomb excitation represents a complementary measurement, which would allow to fix the contribution of the proton to the11C excitation and the proton integral |M
p| for the ground
to 5/2− (4.32 MeV) and 7/2− (6.48 MeV) states and to progress in the extraction of the
neutron excitation from the (p,p’) analysis. Nevertheless, the experimental value for the global isoscalar Mn+ Mp value can be obtained from this (p,p’) analysis. It is indicated in
Tab. V.
In the mass region of the p-shell nuclei, the microscopic models usually underestimate the nucleon excitations. The resulting predicted values of the E2 transition or quadrupole moments are usually too small, compared to the experimental ones. For instance, the authors of Ref. [43] underlined that the values predicted by their shell model calculations were underestimated, and they had to change the effective charges to improve the agreement. The fact that the AMD calculations give the order of magnitude for the (p,p’) scattering for the odd-even 11C, and predict a rather high value for the B(E2) of 10C, favours this model
for further microscopic studies of these nuclei.
V. CONCLUSIONS
We have presented the analysis of the 10,11C(p,p’) scattering data, measured in inverse
kinematics with radioactive beams. From the energy, time of flight and position of the light charged particle, allowing for an identification of the light particles, in coincidence with the ejectile in the plastic wall, a full reconstruction of the (p,p’) kinematics was possible in the angular range from 10 to 50◦
c.m.. Using beam detectors, an energy resolution of 700 keV was
achieved, enough to separate elastic from inelastic contributions.
The12C(p,p’) cross sections were measured at an energy of 36.3 MeV/nucleon, in the same
conditions as the10,11C ones. This allowed to cross-check the reconstruction, the background
the proton elastic scattering of 11C at 40.6 MeV/nucleon and for inelastic scattering to the
5/2− (4.32 MeV) and 7/2− (6.48 MeV) 11C states, for elastic scattering data of 10C+p at
45.3 MeV/nucleon and inelastic scattering to the 2+ state of 10C.
The (p,p’) analysis was performed within the microscopic nucleus-nucleon potential ap-proach, using the JLM microscopic potential. The coupling effects induced by the weak binding of the unstable nuclei on the interaction potential were taken into account by reduc-ing the real part of the potential. The potential in the entrance channel of (p,p’) reactions was tuned on the elastic scattering. Direct structure information (matter rms radii, neutron moment for 10C) was extracted. The elastic data were found consistent with an extended
matter rms radius of 2.42 ± 0.1 fm for 10C, comparable with the rms of the heavier 12C
(2.3 ± 0.1 fm). It is found to be 2.33 ± 0.1 fm for 11C. We have proposed 2pF profiles for
the densities of 10C and 11C, consistent with the elastic data, the parameters are given in
Tab. III.
The validity of the models was discussed : we have tested the ground and transition den-sities predicted by HF+BCS and QRPA and by cluster-model calculations. The matter rms radius for 10C was overestimated by AMD, and both models overestimated the rms matter
radius for 11C. HF+BCS (for the SIII and SGII interactions) provided a good agreement
with the10C elastic data. Both AMD and QRPA fail in reproducing correctly the10,11C(p,p’)
data. This means that an appropriate framework beyond QRPA mean-field should be de-veloped to describe the excitations of light odd-even nuclei like 11C. In the AMD model,
an improvement of the theoretical description of the proton-neutron correlations could be required.
In the case of the 11C(p,p’), prior to our measurement, the transition multipolarities
for 11C from ground state to 5/2− at 4.32 MeV and 7/2− at 6.48 MeV were unknown.
The shape of the experimental angular distributions are very similar to those calculated by considering electric quadrupolar E2 transition.
The proton inelastic scattering probe is a powerful tool to investigate the profile of the density and to extract the moment of the neutron transition density : within the covered angular range, the proposed 2pF density, and the derived transition density were validated on the analysis of the elastic and inelastic scattering, and the Mnfactor for10C was deduced.
The Mn/Mp ratio is 0.70 ± 0.08, indicating a stronger contribution from the protons in the
is not in agreement with the value expected when assuming the mirror symmetry. But, for such a light neutron-deficient system as 10C, the Coulomb effect is expected to be important
and could be mainly responsible of the isospin symmetry breaking. Detailed tests of mirror symmetry for the 2+1 excitations of the T=1 10C-10Be isospin doublet will be done on the 10C(p,p’) data and reported in a later publication.
Acknowledgments
We thank Dr Y. Kanada En’yo for providing us with her10,11C density distributions. The
help of P. Gangnant, J.F. Libin (GANIL) during the preparation of the experiment, of C. Mazur and M. Riallot (Dapnia/SEDI) for the CATS detectors, of L. Petizon (IPN-Orsay) for the mounting of the MUST detectors is gratefully acknowledged.
[1] R. C. Barrett and D. F. Jackson, Nuclear Sizes and Structure (Clarendon, Oxford, 1977). [2] K. Ikeda, N. Tagikawa and H. Horiuchi, Prog. Theor. Phys. (Jap), Suppl. (1968) 464. [3] W. von Oertzen, Z. Phys. A 357 (1997) 355, Physica Scripta T88 (2000) 83.
[4] M. Freer et al., Phys. Rev. C 49, 1751 (1994).
[5] Y. Kanada-En’yo and H. Horiuchi, Phys. Rev. C 55, 2860 (1997) and ref. therein. [6] F. Ajzenberg-Selove, Nucl. Phys. A 490 (1988) 1., ibid. A 506 (1990) 1.
[7] A. Ozawa, I. Tanihata, T. Kobayashi, Y. Sugahara, O. Yamakawa, K. Omata, K. Sugimoto, D. Olson, W. Christie, and H. Wieman, Nucl. Phys. A608 (1996) 63.
[8] A. Ozawa et al., Nucl. Phys. A583 (1995) 807.
[9] P. Raghavan, At. Data Nucl. Data Tables 42, 189 (1989). [10] A. Lagoyannis et al., Phys. Lett. B 518, 27 (2001).
[11] A.M. Bernstein, V.R. Brown and V.A. Madsen, Phys. Rev. Lett. 42, 425 (1979). [12] G. R. Satchler, Direct Nuclear Reactions (Clarendon Press, Oxford 1983). [13] P. D. Cottle et al., Phys. Rev. Lett. 88, 172502 (2002).
[14] P. D. Cottle et al., Phys. Rev. C 60, 031301 (1999).
[15] E. Khan, V. Lapoux, N. Alamanos and Y. Blumenfeld, Phys. Rev. C 69, 031303 (1999). [16] J.P. Jeukenne, A. Lejeune and C. Mahaux, Phys. Rev. C 16, 80 (1977).
[17] Y. Kanada-En’yo, private communication.
[18] Y. Blumenfeld et al., NIM A 421 (1999) 471-491.
[19] A. Joubert et al., Particle Accelerator Conference IEEE Vol 1 (1991) 594. [20] J. L. Baelde et al., Nouvelles du GANIL, n0 44, f´ev. 1993.
[21] S. Ottini et al., NIM A 431, 476 (1999). [22] E. Khan et al., Phys. Lett. B. 490, 45 (2000).
[23] S. Mellema, R. Finlay, F. Dietrich and F. Petrovich, Phys. Rev. C 28, 2267 (1983). [24] J. S. Petler et al., Phys. Rev. C 32, 673 (1985).
[25] N. Alamanos, F. Auger, B. A. Brown and A. Pakou, J. Phys. G 24 (1998) 1541.
[26] N. Alamanos and A. Gillibert, Selected topics in Reaction Studies with Exotic Nuclei, Lect. Notes Phys. 651, 295-337 (2004).
[27] T. Tamura, W.R. Coker and F. Rybicki, Comp. Phys. Commun. 2, 94 (1971). [28] M. El-Azab Farid and G. R. Satchler, Nucl. Phys. A438, 525 (1985).
[29] H. De Vries, C. W. De Jager, and C. De Vries, At. Data Nucl. Data Tables 36, 495 (1987). [30] J. Kirk Dickens et al., Phys. Rev. 129, 743 (1963).
[31] R. De Leo et al., Phys. Rev. C 28, 1443 (1983). [32] L. N. Blumberg et al., Phys. Rev. 147, 812 (1966).
[33] S. Raman et al., At. Data and Nucl. Data Tables 36 (1987) 1. [34] V. Lapoux et al., Phys. Lett. B 517, 18 (2001).
[35] M.E. Brandan and G. R. Satchler, Phys. Rep. 285, 143 (1997). [36] H. Feshbach, Ann. Phys. 5, 357 (1958).
[37] Y. Sakuragi, Phys. Rev C 35, 2161 (1987).
[38] V. Lapoux et al., Phys. Rev. C 66, 034608 (2002).
[39] M. Beiner, H. Flocard, Nguyen Van Giai and P. Quentin, Nucl. Phys. A238, 29 (1975). [40] Nguyen Van Giai and H. Sagawa, Nucl. Phys. A371, 1 (1981).
[41] E. Chabanat, P. Bonche, P. Haensel, J. Meyer, and F. Schaeffer, Physica Scripta T 56, 231 (1995) ; Nucl. Phys. A635, 231 (1998).
[42] Y. Kanada En’yo et al., Phys. Rev. C 60, 064304 (1999). [43] P. Navr`atil, W. E. Ormand, Phys. Rev. C 57, 3119 (1998).
AMD HF+BCS Exp [7] SIII SGII SLy4
rn(f m) 2.50 2.29 2.31 2.37 2.22 ± 0.03
rp(f m) 2.57 2.53 2.52 2.61 2.31 ± 0.03
rm(f m) 2.55 2.44 2.44 2.51 2.27 ± 0.03
TABLE I: Rms neutron rn, proton rp and matter rm radii obtained for the10C densities presented
in Fig. 10. They are compared to the values deduced from experiments in Ref. [7].
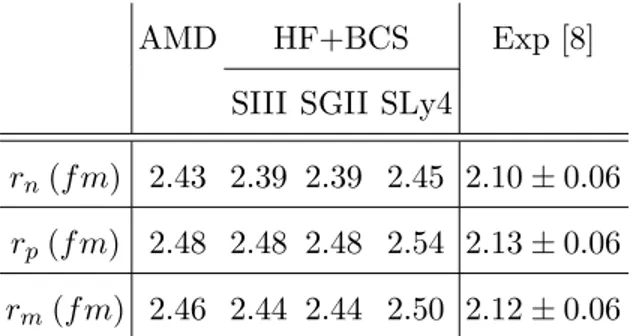
AMD HF+BCS Exp [8]
SIII SGII SLy4
rn(f m) 2.43 2.39 2.39 2.45 2.10 ± 0.06
rp(f m) 2.48 2.48 2.48 2.54 2.13 ± 0.06
rm(f m) 2.46 2.44 2.44 2.50 2.12 ± 0.06
TABLE II: Rms for neutron (rn), protons rp and matter rm densities calculated with the 11C
10C 11C ρo Ro a rms ρo Ro a rms fm−3 (fm) fm−3 (fm) proton 0.0929 2.16 0.499 2.50 1.104 2.06 0.455 2.33 neutron 0.0808 1.96 0.469 2.31 0.092 2.06 0.455 2.33 rm (fm) 2.42 ± 0.1 2.33 ± 0.1
TABLE III: Parameters of the 2pF ground state proton and neutron densities for 10C and 11C, allowing to reproduce the elastic scattering data.
Exp [9] AMD QRPA This work
SIII SGII SLy4
Mn(f m2) 7.42 5.15 6.01 5.96 5.51 ± 1.09
Mp(f m2) 7.84 ± 0.64 6.71 4.65 5.50 4.70
B(E2) (e2f m4) 61.5±10 45 21.62 30.27 22.07
Mn/Mp 1.11 1.11 1.09 1.27 0.70±0.08
TABLE IV: Transition matrix elements Mn, Mp and reduced transition strength for the E2
tran-sition from 0+ ground to first 2+ excited state of 10C. The transition densities are presented in Fig. 15.
AMD Exp., this work Mn(f m2) Mp(f m2) B(E2) (e2f m4) |Mn+ Mp| (fm2)
gs to 5/2− 7.84 6.60 10.88 16.2 ± 1.7
gs to 7/2− 2.99 7.87 15.48 13.3 ± 2.5
TABLE V: Transition matrix elements Mn, Mp and reduced transition strength for the E2
tran-sitions from the 3/2− ground to 5/2− (E∗=4.32 MeV) excited state and for the ground state to
7/2− (E∗=6.48 MeV) of11C. The experimental values Mn+ Mp extracted from the present (p,p’)
data are given in the last column.
0+ 2+ 2+ Sp 0.00 3.35 4.01 5.22 5.38 6.58 7.54 9.27 E *(MeV) 10
C
3/2 -Sp 0.00 8.69 E *(MeV) 11C
1/2 -5/2 -1/2+ 3/2 -7/2 -5/2+ 3/2+ 3/2- 5/2 -2.00 4.32 4.80 6.34 6.48 6.90 7.50 8.10 8.42Plastic Plastic Wall p Polypropylene target CsI SiLi (x,y) Si-strips
C
10 CATS BeamC
beam 10MUST
1317 275 564 mm 191 15010-1 1 10 -20 0 20 -40 -30 -20 -10 0 10 20 30 40
CATS1
10 -1 1 10 -20 0 20CATS2
vertical (mm)
10-1 1 10 -20 0 20 -40 -30 -20 -10 0 10 20 30 40Target
horizontal (mm)
FIG. 3: (Color online) From top to bottom : beam profiles on detectors CATS1 and CATS2, reconstructed beam profile on the target.
80 90 100 110 120 130 140 0 1 2 3 4 5 6 7 8 9 10 7
TOF (arb. units)
∆ESi(MeV)
rebroussement pour les pistes non couvertes par le SiLi
protons deutons α 7 Temps croissant
p
d
α
0 1 2 3 4 5 6 7 8 9 10 0 5 10 15 20 25 30 ∆ ESi (MeV) ∆ESiLi(MeV) protons passing through the SiLidetection limit of the
Silicium
p
t
d
FIG. 4: (Color online) Identification spectrum of the light charged particles in the MUST array, by E-∆E (left) and by E-TOF techniques (right panel).
1 10 102 200 300 400 500 600 700 800 700 800 900 1000 1100 1200 1300 11 C 12 C
time of flight (arb. units)
light (arb. units)
FIG. 5: (Color online) Identification spectrum of11C particles from the correlation matrix between the light deposited in the Faraday plastic versus the TOF measured between the plastic and the CATS2 beam detector.
1 10 102 0 5 10 15 20 25 30 40 50 60 70 80 90 Edet p (MeV) Θdetp (deg) 0 250 500 750 1000 1250 1500 1750 2000 0 5 10 a) b) E*(MeV) 11 C+p 40.6 MeV/nucleon
FIG. 6: (Color online) Uncorrected scattering matrix (θlabp ; Elabp ) for the reaction 11C +p at 40.6 MeV/n and 11C excitation energy spectrum. The incident angle and beam impact on the
E
0 5 10 15 20 25 40 50 60 70 80 90 E lab p (MeV)C (p,p’)
12 Θlabp (deg)Θ
0 5 10 15 20 25 30 40 50 60 70 80 90C (p,p’)
10 E lab p (MeV)E
0 50 100 150 200 250 300 350 400 0 5 10 4.46 9.70 Counts / 100 keV 35.3 MeV/nucleong.s.
-3
12
1+
0+
0 25 50 75 100 125 150 175 200 0 5 103.36
Counts / 100 keV 45.3 MeV/nucleonE* (MeV)
g.s.
0+
2
1+
0 5 10 15 20 25 30 40 50 60 70 80 90 E lab p(MeV)
E
C (p,p’)
11 0 50 100 150 200 250 300 0 5 10 2.02 4.33 6.48 Counts / 100 keV 40.6 MeV/nucleong.s.
3 2 -5 2 -7 2 -1 2-FIG. 7: (Color online) From top to bottom, elastic and inelastic scattering data for 12,11,10C on proton at 35.3, 40.6 and 45.3 MeV/nucleon, respectively. The 8.25 mg/cm2-thick target was used
for these 12C(p,p’) events, the 1.48 mg/cm2-thick one for 10,11C(p,p’) shown here. Left column is for the correlation matrices of the proton energy deposited in the Si-strip and SiLi stages versus the angle measured in the lab. frame, θlab. The thick lines superimposed are the kinematical loci of
the (p,p’) reaction to the11C states. Right side column gives the corresponding excitation energy
spectrum in the energy range up to 13 MeV. For12C (first line) the position of the 0+2 state, weakly excited by the (p,p’) is only indicated by a vertical arrow. For 11C (10C), no structure over the
10 102 103 10 20 30 40 50 60
p(
12C,p
,)
d
σ
/d
Ω
(mb/sr)
Θ
c.m.(deg)
E = 36.3 MeV/nucleon E(2+)=4.4 MeVJLM
FIG. 8: Elastic and inelastic scattering data for 12C on proton target at 36.3 MeV/nucleon in comparison with the results given by the JLM microscopic potential calculated using densities described in the text.
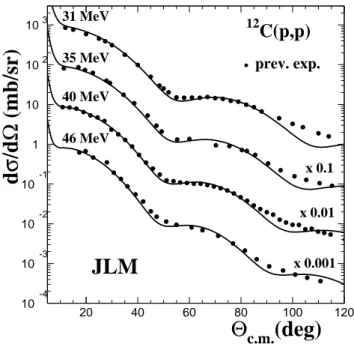
10-4 10-3 10-2 10-1 1 10 102 103 20 40 60 80 100 120 12 C(p,p)
d
σ
/d
Ω
(mb/sr)
Θ
c.m.(deg)
31 MeV 35 MeV x 0.1 40 MeV x 0.01 46 MeV x 0.001JLM
prev. exp.FIG. 9: Comparison of the elastic scattering data for 12C on proton target at various energies (references can be found in the text) in comparison with the results given by the JLM microscopic potential calculated using the12C 2pF density. The standard normalization of the JLM imaginary potential (λw = 0.8) for light nuclei is applied.
0 0.02 0.04 0.06 0.08 0 1 2 3 proton neutron a)
AMD
10-6 10-5 10-4 10-3 10-2 3 4 5 6 7 8 proton neutron b)AMD
0 0.02 0.04 0.06 0.08 0 1 2 3 SIII SGII SLy4 c) proton 10-6 10-5 10-4 10-3 10-2 3 4 5 6 7 8 SIII SGII SLy4 d) proton 0 0.02 0.04 0.06 0.08 0 1 2 3 SIII SGII SLy4 e) neutron 10-6 10-5 10-4 10-3 10-2 3 4 5 6 7 8 SIII SGII SLy4 f) neutron r (fm) ρ (r) ( 10 C) (fm -3 )FIG. 10: Neutron and proton ground state densities for10C obtained with the AMD model (a and
b) and the HF+BCS calculations done with three Skyrme interactions (c to f). The densities in the left (right) column are displayed in linear (logarithmic) scale.
0 0.02 0.04 0.06 0.08 0 1 2 3 proton neutron a)
AMD
10-6 10-5 10-4 10-3 10-2 3 4 5 6 7 8 proton neutron b)AMD
0 0.02 0.04 0.06 0.08 0 1 2 3 SIII SGII SLy4 c) proton 10-6 10-5 10-4 10-3 10-2 3 4 5 6 7 8 SIII SGII SLy4 d) proton 0 0.02 0.04 0.06 0.08 0 1 2 3 SIII SGII SLy4 e) neutron 10-6 10-5 10-4 10-3 10-2 3 4 5 6 7 8 SIII SGII SLy4 f) neutron r (fm) ρ (r) ( 11 C) (fm -3 )10 102 103 20 40 60
AMD
λv=0.92 λv=1.00 10 102 103 20 40 60HF + BCS
(SGII)
λv=0.92 λv=1.00 10 102 103 20 40 60HF + BCS
(SIII)
λv=0.92 λv=1.00 10 102 103 20 40 60HF + BCS
(SLy4)
λv=0.92 λv=1.00Θ
c.m.(deg)
10C+p 45.3 MeV/nucleon
d
σ
/d
Ω
(mb/sr)
FIG. 12: Elastic scattering data for 10C on proton target at 45.3 MeV/nucleon in comparison with the results given by the JLM microscopic potential calculated with the AMD and HF densi-ties. Three Skyrme forces (SGII, SIII, SLy4) were considered for the HF calculations. The solid and dotted lines are obtained with a normalization factor for the real part equal to 0.92 and 1, respectively.
1 10 102 103 20 40 60 Gaussian density rn=rp= 2.45 rn=rp= 2.3 a) 10 C+p 45.3 MeV/nucleon d σ /d Ω (mb/sr) 1 10 102 103 20 40 60 Θc.m.(deg) Gaussian density rmatter=2.45 fm rn=2.45 rp=2.45 rn=2.34 rp=2.52 b)
FIG. 13: JLM calculation for10C+p elastic scattering at 45.3 MeV/nucleon using gaussian-function
densities : a) with equal proton and neutron densities, one having a rms radius equal to 2.45 fm (solid line), other with 2.3 fm (dotted line) and b) two matter densities with same rms radius (2.45 fm) but different rn and rp.The normalization factor for the real part is fixed to 0.92.
10 102 103 20 40 60
AMD
λv=0.90 λv=1.00 10 102 103 20 40 60HF + BCS
(SGII)
λv=0.90 λv=1.00 10 102 103 20 40 60HF + BCS
(SIII)
λv=0.90 10 102 103 20 40 60HF + BCS
(SLy4)
λv=0.90Θ
c.m.(deg)
11C+p 40.6 MeV/nucleon
d
σ
/d
Ω
(mb/sr)
FIG. 14: Same as in Fig.12 for 11C. The solid and dotted lines are obtained with a normalization factor for the real part equal to 0.9 and 1, respectively.
0 0.025 0.05 0.075 0.1 0 1 2 3 4 5
QRPA
SIII
SGII
SLy4
a)
proton
0 0.025 0.05 0.075 0.1 0 1 2 3 4 5 6QRPA
SIII
SGII
SLy4
b)
neutron
0 0.025 0.05 0.075 0.1 0 1 2 3 4 5proton
neutron
c)
AMD
r (fm)
ρ
tr(r) (
10C) (fm
-3)
FIG. 15: Neutron and proton AMD and QRPA transition densities from the 0+
gs to the 2+1 excited