The Journal of Nutrition
Nutritional Epidemiology
Selected Dietary Flavonoids Are Associated
with Markers of Inflammation and Endothelial
Dysfunction in U.S. Women
1,2
Rikard Landberg,
3* Qi Sun,
4Eric B. Rimm,
4–6, Aedin Cassidy,
7Augustin Scalbert,
8Christos S. Mantzoros,
9Frank B. Hu,
4–6and Rob M. van Dam
4,103Department of Food Science, Swedish University of Agricultural Sciences, SE-75007 Uppsala, Sweden;4Department of Nutrition, Harvard School of Public Health, Boston, MA 02115;5Channing Laboratory, Department of Medicine, Brigham and Women’s Hospital and Harvard Medical School, Boston, MA 02115;6Department of Epidemiology, Harvard School of Public Health, Boston, MA 02115; 7School of Medicine, University of East Anglia, Norwich NR4 7TJ, UK;8INRA, UMR 1019, Unite´ de Nutrition Humaine, Centre de Recherche de Clermont-Ferrand/Theix, 63122 Saint-Genes-Champanelle, France;9Division of Endocrinology, Diabetes and Metabolism, Beth Israel Deaconess Medical Center and Harvard Medical School, Boston, MA 02215; and10Departments of Epidemiology and Public Health, and Medicine, Yong Loo Lin School of Medicine, National University of Singapore, Singapore 117597
Abstract
Flavonoids show antiinflammatory effects in vitro and human intervention studies have suggested beneficial effects of flavonoid-rich foods on biomarkers of inflammation and endothelial function. In the present study, we assessed the relationship between flavonoid intake and biomarkers of inflammation and endothelial dysfunction in a cross-sectional study of participants from the Nurses’ Health Study cohort. Intake of 6 flavonoid subclasses (flavonols, flavones, flavanones, flavan-3-ols, anthocyanidins, and polymeric flavonoids) was assessed using a FFQ administered in 1990. Also, the main food sources of these flavonoids were examined. Blood samples were collected in 1989–1990 and plasma C-reactive protein (CRP), IL-6, IL-18, soluble tumor necrosis factor receptor-2 (sTNF-R2), soluble intercellular adhesion molecule-1, soluble vascular adhesion molecule-1 (sVCAM-1), and E-selectin were measured in 1194–1598 women. The multivariate-adjusted geometric mean of plasma IL-8 were lower for women in the highest intake quintile of flavones, flavanones, and total flavonoids compared with those in the lowest quintiles by 9% (Q1: 264 ng/L, Q5: 241 ng/L;P-trend = 0.019), 11% (Q1: 273 ng/L, Q5: 244 ng/L;P-trend = 0.011), and 8% (Q1: 276 ng/L, Q5: 55 ng/L; P-trend = 0.034), respectively. The multivariate-adjusted geometric mean for women in the highest intake quintile of flavonol compared with those in the lowest quintile was 4% lower for sVCAM-1 (Q1: 578mg/L, Q5: 557 mg/L; P-trend = 0.012). Among flavonoid-rich foods, higher intake of grapefruit was significantly associated with lower concentrations of CRP and sTNF-R2. In summary, higher intakes of selected flavonoid subclasses were associated with modestly lower concentrations of inflammatory biomarkers. In particular, flavonoids typically found in citrus fruits were modestly associated with lower plasma IL-18 concentrations. J. Nutr. 141: 618–625, 2011.
Introduction
Inflammation is a fundamental biological process that plays an
important role in atherosclerosis and thus the development of
cardiovascular diseases (CVD)
11(1–3). Increasing evidence also
links inflammation and endothelial dysfunction with the group
of alterations constituting metabolic syndrome: hyperglycemia,
insulin resistance, hyperinsulinemia, hypertension, obesity, and
dyslipidemia (4). Proinflammatory cytokines such as TNFa,
IL-6, IL-18, and C-reactive protein (CRP), a biomarker of
low-grade inflammation, have been associated with an increased risk
of type 2 diabetes (5,6). TNF
a, IL-6, and CRP also stimulate
endothelial production of adhesion molecules, such as E-selectin
and inter-cellular adhesion molecule 1 (ICAM-1), mediators of
endothelial dysfunction in capillary and arteriolar endothelium
(7).
Flavonoids represent a large and diverse group of secondary
plant metabolites commonly found in various fruits, vegetables,
legumes, dark chocolate, and beverages such as tea and wine (8–
10). According to structural features, flavonoids can be divided
into subgroups: flavonols, flavones, flavanones, anthocyanidins,
isoflavones, monomeric flavan-3-ols, and polymeric flavan-3-ols
1Supported by the NIH (grant R01 DK082486). Dr. Sun was supported by a career development award K99HL098459 from the National Heart, Lung, and Blood Institute.
2
Author disclosures: R. Landberg, Q, Sun, E. B. Rimm, A. Cassidy, A. Scalbert, C. S. Mantzoros, F. B. Hu, and R. M. van Dam, no conflicts of interest.
* To whom correspondence should be addressed. E-mail: rikard.landberg@lmv. slu.se.
11
Abbreviations used: CRP, C-reactive protein; CVD, cardiovascular disease; MET, metabolic equivalent; NHS, Nurses’ Health Study; sICAM-1, soluble intercellular adhesion molecule 1; sTNF-R2, soluble tumor necrosis factor receptor-2; sVCAM-1, soluble vascular cell adhesion molecule 1.
ã 2011 American Society for Nutrition.
618 Manuscript received October 13, 2010. Initial review completed November 21, 2010. Revision accepted January 13, 2011.
(i.e. proanthocyanidins, thearubigins, and theaflavins). Many of
the flavonoids show antiinflammatory effects in vitro and in
animal models (11–13). Due to the structural differences,
bioactivity and bioavailability vary substantially between and
also within the subclasses (14,15). Several short-term
interven-tion studies have shown favorable effects on biomarkers of
inflammation and endothelial function by intake of flavonoids
or flavonoid-rich foods (16–19), whereas other studies have
shown no effect (20–24). To date, only a limited number of
observational studies have investigated the association between
the extensive range of flavonoids or flavonoid-rich foods and
biomarkers of inflammation and endothelial dysfunction (25–
28). However, none of the previous studies used the latest
flavonoid database from 2007 (9) and typically only 1 or 2
biomarkers of inflammation were investigated. Assessment of
several different biomarkers of inflammation and endothelial
function that partly reflect different mechanistic pathways may
facilitate a more comprehensive understanding of the putative
effects of flavonoids in relation to chronic diseases.
In the present study, using a recently updated database, we
examined the association between intake of total flavonoids and
6 flavonoid subclasses as well as flavonoid-rich food sources in
relation to plasma biomarkers of inflammation and endothelial
dysfunction in a large number of apparently healthy women in
the U.S. Nurses’ Health Study (NHS).
Participants and Methods
Participants. The NHS was established in 1976 and included 121,700 female nurses residing in the United States (29). Every 2 y, participants have been mailed a follow-up questionnaire regarding potential risk factors to identify newly diagnosed cases of chronic diseases. FFQ have been mailed to participants every 2–4 y. The present study included a total number of 2115 women aged 43–70 y who were selected as controls for 2 nested case-control studies on type 2 diabetes and myocardial infarction (5,30). Participants had not been diagnosed with CVD, cancer, or type 2 diabetes mellitus at the time of the blood collection in 1989–1990. The Harvard School of Public Health and Brigham and Women’s Hospital Human Subjects Committee Review Board approved the study protocol.
Blood collection and assessment of markers. Blood was collected in1989–1990 from 32826 women. Women willing to provide blood specimens were sent instructions and a phlebotomy kit by mail and blood specimens were returned on ice by overnight mail. When arriving at the laboratory, samples were centrifuged at 12003 g for 15 min to separate plasma, buffy coat, and erythrocytes, and all parts were immediately frozen in liquid nitrogen at a temperature no higher than21308C and kept until analysis. Ninety-seven percent of samples arrived within 26 h of phlebotomy. Quality control samples were routinely frozen along with study samples to monitor changes due to long-term storage and assay variability.
Biomarkers of inflammation and endothelial dysfunction were analyzed in the Clinical Chemistry Laboratory at Children’s Hospital in Boston, except for IL-18, which was analyzed at the Division of Endocrinology, Diabetes and Metabolism, Department of Medicine, Beth Israel Deaconess Medical Center, Harvard Medical School, Boston. The numbers for the different biomarkers vary somewhat, because measurements were conducted in different years with the size of the nested case-control studies increasing over time [CRP, n = 1598; IL-6, n = 1158; IL-18, n = 1087; soluble tumor necrosis factor receptor 2 (sTNF-R2), n = 1194; soluble intercellular adhesion molecule-1 (sICAM), n = 1199; soluble vascular adhesion molecule-1 (sVCAM), n = 1199; E-selectin, n = 1199]. The concentrations of plasma sICAM-1, sVCAM-1, E-selectin, IL-6, and sTNF-R2 were measured by commercial ELISA (R&D Systems). Plasma high-sensitive CRP concentrations were mea-sured by a latex-enhanced turbidimetric assay on a Hitachi 911 (Denka
Seiken). The plasma IL-18 concentration was measured by an ELISA (MBL). The inter-assay CV were,10% for all markers. It has been demonstrated that processing time did not substantially affect concen-tration of investigated markers (31).
Assessment of flavonoid intakes. In 1990, a semiquantitative FFQ containing 131 food items was mailed to the participants. A standard portion size was given for each food item and cohort members were asked to choose 1 from 9 possible frequency responses ranging from “never” to “6 times/d” for each food. The relative validity and reproducibility of the FFQ have been previously reported and the correlation between flavonoid-rich foods such as grapefruits, oranges, apple, and tea intakes measured by diet records and FFQ were 0.76, 0.84, 0.70, and 0.77, respectively (32).
A database for assessment of intake of total flavonoids and 6 subclasses commonly consumed in the U.S. diet was constructed and included in the Harvard nutrient database as described by Cassidy et al. (33). Briefly, data from the latest USDA databases on flavonoids and proanthocyanidins (9,34) were extended with information from a European database (35) and peer-reviewed literature. Intakes of individual flavonoids were calculated as the sum of the consumption frequency of each food multiplied by the content of the specific flavonoid for the specified portion size. We derived intakes of the 6 main subclasses commonly consumed in the U.S. diet. These were flavonols (quercetin, kampferol, myricetin, isohamnetin), flavones (luteolin, apigenin), flava-nones (eriodicytol, hesperetin, naringenin), anthocyanidins (cyanidin, delphinidin, malvidin, pelargonidin, petunidin, peonidin), monomeric flavan-3-ols (catechins, epicatechins), and polymeric flavan-3-ols (in-cluding oligomeric and polymeric proanthocyanidins, theaflavins, and thearubigins). Total flavonoid intake was calculated as the sum of the 6 subclasses and expressed in mg/d. Flavonoid intakes were adjusted for total energy intake by the residual method (36). We also examined the association of flavonoid-rich foods, including tea, onions, apples, berries (strawberry + blueberry), oranges (including juice), grapefruit (including juice), and total citrus (oranges + grapefruit including juices) with the biomarkers. Fresh and frozen strawberries and blueberries represented 95% of the per capita availability of berries in the US in 1990 (37). Intakes of foods were expressed as servings, equivalent to 237 g (coffee and tea), 186 g (juice), 110 g (onions), 138 g (apples), 37 g (berries), 131 g (oranges), and 65.5 g (grapefruit).
Assessment of other variables. Body weight was self-reported in 1990. BMI was calculated as weight (kg) divided by squared height (m2).
Physical activity was assessed in hours per week spent on common leisure-time physical activities expressed as metabolic equivalent (MET) h/wk in 1988 (38). Mean daily alcohol intake and total coffee intake (sum of caffeinated and decaffeinated coffee) were assessed in the 1990 FFQ. Aspirin intake was assessed from 1988 and hormone therapy and menopausal status were assessed in 1990.
Statistical analysis. We calculated Spearman’s rank correlation coef-ficients for flavonoid intakes and biomarkers. Plasma biomarker variables were log-transformed to better approximate a normal distri-bution. ANCOVA was used to calculate age-adjusted (5-y categories) and multivariable-adjusted geometric least square means and their 95% CI of biomarkers for quintiles of flavonoid intakes. Foods were categorized a priori into 4–5 groups with cutoff values chosen to obtain wide intake ranges including at least 4% of the intake distribution in each category (total citrus fruits including juices:,1/mo, 1/mo to 1/wk, 1/wk to 1/d, 1/d to 2/d,$2/d; grapefruit including juice: ,1/mo, 1/mo to 1/wk, 1/wk to 1/d, $1/d; apples: same categories as for grapefruit; onions: same categories as for grapefruit; tea:,1/mo, 1/mo to 1/wk, 1/wk to 2/d, $2/d). Because biomarkers were analyzed at different occasions, all models were adjusted for batch. In multivariable models, means were adjusted for age (5-y categories), BMI (entered as a continuous variable), smoking status (never smoked, past smoker, and current smoker of 1–14 and $15 cigarettes/d), alcohol consumption (nondrinker and 0–4.9, 5.0–9.9, 10–14.9, and$15 g/d), energy intake, current aspirin use (yes/no), and menopausal hormone therapy (pre-menopausal and never, past, and current user), physical activity
(quintiles of MET h/wk). We also conducted sensitivity analysis by further adjusting models for nutrients and foods that had previously been associated with inflammation and endothelial dysfunction, including vitamin C, trans-fatty acids, total (n-3) fatty acids, and cereal fiber. Age-adjusted and multivariable models where flavonoids were entered as continuous variables were also tested. P-values for trend were calculated by entering the median value of each category of the dietary exposure variable into the model as a continuous variable. All analyses were conducted using SAS version 9 (SAS Institute).
Results
We observed a ~5-fold difference in total flavonoid intake
between the highest and lowest quintiles of the study population
(median: 801 mg/d in the highest quintile vs. 107 mg/d in the
lowest) (Table 1). Women in the higher intake categories were
less likely to smoke and to use aspirin. They also drank less
alcohol and coffee and more tea compared with those in the
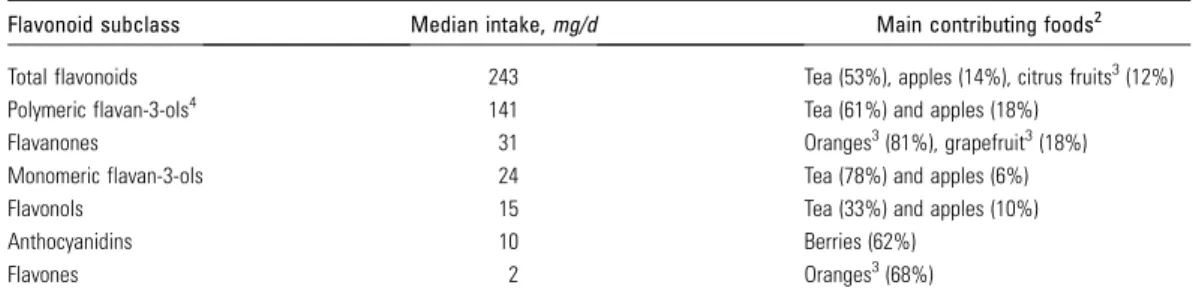
lower quintiles. The median intake for flavonoid subclasses
ranged from 2 to 141 mg/d and the main contributing foods
were tea, apples, and citrus fruits (including juices) (Table 2).
Significant Spearman correlation coefficients in the range of
0.15–0.95 were observed between flavonoid subclasses and
flavonoid-rich foods such as tea, onion, apples, berries
(straw-berry + blue(straw-berry), oranges (including juice), grapefruit
(includ-ing juice), and total citrus (oranges + grapefruit includ(includ-ing juices).
We calculated partial Spearman correlation coefficients
between flavonoid subclasses and biomarkers of inflammation
and endothelial dysfunction and found that several flavonoid
classes were inversely correlated with plasma IL-18, CRP,
sVCAM-1, sICAM-1, and sTNF-R2 concentrations in
age-adjusted models (data not shown). After multivariable
adjust-ment, the correlation between Il-18 and flavones (
20.069; P =
0.033), anthocyanidins (
20.079; P = 0.014) ,and total
flavo-noids (
20.075; P = 0.020) remained significant as did the
correlation between flavonols and sVCAM-1 (
20.078; P =
0.012) (Table 3). A borderline significant correlation was
observed between intake of flavanones and sTNF-R2 (
20.061;
P = 0.05) (Table 3).
To avoid the potential impact of extreme intakes and to
evaluate whether associations were monotonous, we further
investigated significant correlations in an analysis of biomarker
concentrations by quintiles of flavonoid intakes. After
multivar-iable adjustment, higher intake of total flavonoids was
asso-ciated with lower concentrations of IL-18 (Q1: 276 ng/L, Q5:
255 ng/L; P-trend = 0.034). The flavonoid classes flavones (Q1:
264 ng/L, Q5: 241 ng/L; P-trend = 0.019) and flavanones (Q1:
273 ng/L, Q5: 244 ng/L; P-trend = 0.011) were also associated
with lower IL-18 concentrations (Table 4). In addition, higher
intakes of flavonols were associated with lower sVCAM-1
concentrations (Q1: 578, Q5: 557
mg/L; P-trend = 0.008)
TABLE 1 Characteristics in 1990 according to quintiles of total flavonoid intake in the NHS1
Total flavonoids2 Q1, n = 403 Q2, n = 402 Q3, n = 402 Q4, n = 403 Q5, n = 402 Median [IQR],3mg/d 107 [47] 174 [31.7] 243 [44.8] 375 [88.9] 801 [455.3] Age, y 576 7 586 7 586 7 586 7 576 7 BMI, kg/m2 25.96 5.5 25.16 4.4 25.26 4.5 25.46 4.6 25.26 4.4 Current smoker, % 28 18 14 10 15 Physical activity, MET h/wk 15.26 15.9 18.66 18.8 19.16 17.2 18.86 21.6 16.36 16.0 Postmenopasual hormone use, % 31 39 36 32 33 Hypertension, % 15 18 19 18 17 Hypercholesterolemia, % 29 31 34 32 26 Total energy intake, MJ/d 7.26 2.3 7.76 2.2 7.56 2.0 7.56 1.9 7.16 2.1 Alcohol consumption, g/d 7.06 11.4 6.26 9.8 4.96 8.5 5.16 9.3 5.56 10.2 Aspirin use, % 61 66 66 64 58 Glycemic load 996 21 1046 20 1096 19 1086 20 1086 19 Vitamin C intake, mg/d 2526 355 3266 366 3446 376 3286 359 3186 377 Total trans fat, % of energy 1.66 0.6 1.46 0.5 1.46 0.6 1.46 0.5 1.56 0.6 Total (n-3) fat,4% of energy 0.76 0.3 0.76 0.2 0.76 0.3 0.76 0.2 0.76 0.2 Cereal fiber intake, g/d 5.16 3.8 5.36 3.1 5.66 3.0 5.26 2.8 5.26 3.3 Whole grain, g/d 18.86 20.4 20.46 15.5 23.36 16.9 20.56 15.1 19.86 17.3 Coffee,5servings/d 2.86 2.0 2.76 1.8 2.46 1.7 2.16 1.6 1.66 1.6 Tea, servings/d 0.16 0.4 0.16 0.1 0.26 0.2 0.76 0.4 2.46 1.4 Onions, servings/wk 3.16 6.1 3.16 3.2 3.06 3.0 3.36 3.6 2.86 3.2 Apples,6servings/wk 1.06 6.1 2.06 1.6 3.16 2.3 2.86 2.6 3.16 4.1 Berries, servings/wk 0.66 1.1 1.06 1.0 1.36 1.3 1.36 1.4 1.56 2.7 Oranges,7servings/wk 2.56 4.5 4.46 3.6 5.26 4.2 5.16 5.3 4.46 4.7 Grapefruit,7servings/wk 0.96 1.9 1.36 2.0 1.56 2.4 1.66 2.5 1.36 2.5
1Values are means6 SD. One serving corresponds to 237 g (coffee and tea), 110 g (onions), 138 g (apples), 37 g (berries), 131 g (oranges),
65.5 g (grapefruit), and 186 g (orange/grapefruit juice).
2Total U.S. flavonoids. 3[75th–25th percentile]. 418:3(n-3) + 20:5(n-3) + 22:6(n-3).
51 serving = 237 g (coffee and tea), 110 g (9 g/slice, onions), 138 g (apples), 37 g (berries), 131 g (oranges), and 65.5 g (grapefruit). 6Apples and pears were assessed by the same question in the FFQ. According to per capita consumption, apples accounted for 88% of
apples and pears availability in the US in 1990 (37). Reported values were therefore multiplied by 0.88.
7Sum of juice and fruit.
(Table 5). After further adjustment for quintiles of (n-3) fatty
acids, trans-fatty acids, vitamin C, and cereal fiber, the
associ-ations remained virtually the same (data not shown).
We also investigated the associations with biomarkers of the
main food sources for the flavonoid subclasses for which we
observed significant inverse associations. The examined foods
were tea, onions, apples, berries (strawberries and blueberries),
grapefruit (including juice), oranges (including juice), and total
citrus (sum of grapefruit, oranges, and juices). Plasma
concen-trations of IL-18 tended to be lower with higher total citrus
intakes (284 ng/L for
,1/mo vs. 231 ng/L for $2/d; P-trend =
0.007) (Fig. 1A). This trend was mainly attributed to orange
juice and not to orange or grapefruit intake (Fig. 1B), for which
the range of intake was smaller (data not shown). However,
grapefruit (including juice) intake (Fig. 1C,D), but not total
citrus intake (Fig. 1E,F), was significantly associated with lower
CRP and TNF-R2 concentrations. None of the other tested
foods were substantially associated with differences in
bio-markers (data not shown). The results did not substantially
change after adjustment for quintiles of (n-3) fatty acids,
trans-fatty acids, vitamin C, and cereal fiber (data not shown).
Discussion
Over the range of dietary intakes in this population, we found
that total flavonoids, flavanones, and flavones were inversely
associated with IL-18 concentrations and that flavonols were
inversely associated with sVCAM concentrations. The
associ-ated biomarker changes were in the range of 4–11% (Q5 vs. Q1)
and were all independent of a range of other evaluated lifestyle
and dietary determinants of inflammation and endothelial
dysfunction. In addition, intake of citrus fruits, which are rich
sources of flavones and flavanones, was associated with a 20%
lower IL-18 concentration ($2 servings/d vs. ,1 serving/mo)
and intake of grapefruit was associated with a 21% lower CRP
and 8% lower TNF-R2 concentration ($1 servings/d vs. ,1
serving/mo).
Inflammation and endothelial dysfunction are recognized as
important contributors to the development of atherosclerosis
(1,39,40). CRP is a marker of low-grade systemic inflammation
and was an independent predictor of CVD in several studies
(41,42). IL-6 and TNF
a are both proinflammatory cytokines,
which induce hepatic production of CRP and other acute phase
proteins (43). We examined a soluble TNF
a receptor, which is
activated by TNF
a and other cytokines (44). TNFa receptor is a
more stable marker of TNF
a levels (30) and has been related to
obesity and coronary heart disease (45).
Recently, IL-18, a proinflammatory cytokine, was shown to
independently predict type 2 diabetes incidence (46). A 10%
change in IL-18, similar to the associated change of citrus fruit
flavonoids observed in the present study, was associated with an
;3% lower risk of type 2 diabetes in that study (46). The exact
role of IL-18 in diabetes etiology is unclear, but it amplifies the
inflammatory cascade by inducing expression of other
proin-TABLE 2 Estimated intake of total flavonoids and subclasses and their main contributing foods in the NHS1
Flavonoid subclass Median intake, mg/d Main contributing foods2 Total flavonoids 243 Tea (53%), apples (14%), citrus fruits3(12%) Polymeric flavan-3-ols4 141 Tea (61%) and apples (18%)
Flavanones 31 Oranges3(81%), grapefruit3(18%) Monomeric flavan-3-ols 24 Tea (78%) and apples (6%) Flavonols 15 Tea (33%) and apples (10%) Anthocyanidins 10 Berries (62%)
Flavones 2 Oranges3(68%)
1Intakes are derived from 1990 (n = 2012). 2Based on the entire cohort (n = 121,700). 3Including juice.
4Include oligomeric and polymeric proanthocyanidins, theaflavins, and thearubigins.
TABLE 3 Partial Spearman rank correlation coefficients between intake of flavonoid classes and biomarkers of inflammation and endothelial dysfunction in the NHS1–3
Biomarker Flavonols Flavones Flavanones Anthocyanidins
Monomeric flavan-3-ols Polymeric flavan-3-ols Total flavonoids IL-6 0.003 20.009 20.018 20.011 20.012 20.015 20.014 IL-18 20.057 20.069* 20.061* 20.079* 20.057 20.060 20.075* CRP 0.015 20.030 20.039 20.025 0.044 0.043 0.030 sVCAM-1 20.078* 20.009 20.005 0.035 20.030 20.013 20.027 sICAM-1 20.033 20.024 20.049 20.020 20.012 20.0003 20.018 sTNF-R2 20.047 20.031 20.061 0.011 0.033 0.041 0.027 E-selectin 20.016 0.017 20.005 0.0003 0.009 0.008 0.006
1Intakes are derived from 1990.
2Model adjusted for age (,50 y; 50 to ,55 y; 55 to ,60 y; 60 to ,65 y; $65 y), biomarker assay batch (1–5 batches), BMI (continuous),
physical activity (MET h/wk), smoking status (never; past; current,,15 cigarettes/d; current $15 cigarettes/d), alcohol consumption (nondrinker;.0 to ,5, 5 to ,15, $15 g/d), current aspirin use (yes/no), postmenopausal hormone therapy (premenopausal and never, past, current user), energy intake (continuous), coffee intake (,1 cup/mo, 1 cup/mo to 4 cups/wk, 5–7 cups/wk, $2 cups/d).
3Wheren = 1040 (IL-6), 981 (IL-18), 1419 (CRP), 1074 (sVCAM-1), 1074 (sICAM-1), 1069 (sTNF-R2), and 1079 (E-selectin). *P , 0.05.
flammatory mediators and is induced by redox-balance and
TNF
a through the NF-kB activation (47). To our knowledge, no
previous study has investigated associated effects of flavonoid
intake in relation to IL-18.
Cell adhesion molecules, including E-selectin, sICAM-1, and
sVCAM-1, are markers of endothelial dysfunction, which may
be a common pathogenic precursor of CVD and type 2 diabetes
(5,48). E-selectin is a surface leukocyte adhesion molecule,
TABLE 4 Adjusted geometric mean (and 95% CI) plasma concentrations of IL-18 (ng/L) by categories of flavonoid classes in the NHS1
Energy adjusted intake (quintiles)
P-trend2 Q1 Q2 Q3 Q4 Q5 Flavonols, mg/d Median 7.4 11.0 14.8 20.7 35.4 Age-adjusted3 282 (267, 299) 270 (255, 285) 260 (246, 275) 265 (250, 281) 264, (249, 279) 0.18 Multivariate-adjusted4 284 (267, 301) 270 (254, 286) 258 (244, 273) 267 (252, 283) 259, (244, 274) 0.09 Flavones, mg/d Median 0.53 1.0 1.5 2.2 3.2 Age-adjusted 269 (255, 284) 288 (272, 306) 271 (256, 287) 272 (256, 288) 241, (227, 256) 0.002 Multivariate-adjusted 264 (250, 280) 284 (267, 301) 270 (255, 285) 278 (262, 295) 241, (226, 256) 0.019 Flavanones, mg/d Median 5.0 15.6 31.4 49.2 79.2 Age-adjusted 279 (264, 294) 277 (262, 294) 268 (253, 284) 273 (257, 289) 243, (229, 258) 0.001 Multivariate-adjusted 273 (258, 289) 275 (259, 291) 270 (255, 286) 273 (257, 290) 244, (230, 260) 0.011 Anthocyanidin, mg/d Median 2.8 6.0 10.0 15.3 24.6 Age-adjusted 275 (260, 292) 274 (259, 290) 272 (257, 288) 251 (237, 266) 268, (253, 285) 0.22 Multivariate-adjusted 273 (257, 290) 277 (261, 293) 273 (257, 289) 249 (235, 264) 265, (249, 281) 0.14 Monomeric flavan-3-ols, mg/d Median 7.0 14.3 23.6 55.9 153 Age-adjusted 283 (267, 299) 264 (250, 280) 264 (248, 280) 266 (252, 282) 264, (249, 279) 0.34 Multivariate-adjusted 279 (262, 296) 266 (251, 281) 267 (251, 284) 263 (248, 278) 262, (247, 278) 0.29 Polymeric flavan-3-ols, mg/d Median 48.5 91.9 141 235 557 Age-adjusted 272 (258, 288) 274 (258, 290) 269 (254, 285) 263 (248, 278) 263, (248, 278) 0.25 Multivariate-adjusted 271 (255, 288) 277 (260, 294) 266 (251, 282) 262 (247, 277) 261, (246, 276) 0.21 Total flavonoids, mg/d Median 106.5 174.1 242.7 374.9 801.0 Age-adjusted 281 (266, 297) 274 (258, 291) 262 (247, 277) 266 (251, 282) 258, (244, 273) 0.042 Multivariate-adjusted 276 (260, 293) 279 (263, 296) 262 (247, 278) 264 (249, 280) 255, (241, 270) 0.034
1Intakes are derived from 1990.
2P-value from multiple linear regression models where log IL-18 concentration was modeled on medians of intake quintiles entered as a
continuous variable.
3Model adjusted for age (,50 y; 50 to ,55 y; 55 to ,60 y; 60 to ,65 y; $65 y), energy intake.
4Model adjusted for age (,50 y; 50 to ,55 y; 55 to ,60 y; 60 to ,65 y; $65 y), biomarker assay batch (1–5 batches), BMI (continuous),
physical activity (MET h/wk), smoking status (never; past; current,,15 cigarettes/d; current, $15 cigarettes/d), alcohol consumption (nondrinker;.0 to ,5, 5 to ,15, $15 g/d), current aspirin use (yes/no), postmenopausal hormone therapy (premenopausal and never, past, current user), energy intake (continuous), coffee intake (,1 cup/mo, 1 cup/mo to 4 cups/wk, 5–7 cups/wk, $2 cups/d).
TABLE 5 Adjusted geometric mean (and 95% CI) plasma concentrations of sVCAM-1 (mg/L) by categories of intakes of flavonols in the NHS1
Energy adjusted intake (quintiles)
P-trend2 Q1 Q2 Q3 Q4 Q5 Flavonols, mg/d Median 7.4 11.0 14.8 20.7 35.4 Age-adjusted3 578 (561, 595) 591 (572, 609) 573 (555, 592) 561 (545–578) 560 (543–578) 0.027 Multivariate-adjusted4 578 (560, 596) 594 (575, 613) 577 (558, 596) 562 (545–579) 557 (539–575) 0.012
1Intakes are derived from 1990.
2P-value from multiple linear regression models where log sVCAM-1 concentration was modeled on medians of flavonol quintiles entered
as a continuous variable.
3Model adjusted for age (,50 y; 50 to ,55 y; 55 to ,60 y; 60 to ,65 y; $65 y), energy intake, and biomarker assay batch (3 batches). 4Model adjusted for age (,50 y; 50 to ,55 y; 55 to ,60 y; 60 to ,65 y; $65 y), biomarker assay batch (1–5 batches), BMI (continuous),
physical activity (MET h/wk), smoking status (never; past; current,,15 cigarettes/d; current, $15 cigarettes/d), alcohol consumption (nondrinker;.0 to ,5, 5 to ,15, $15 g/d), current aspirin use (yes/no), postmenopausal hormone therapy (premenopausal and never, past, current user), energy intake (continuous), coffee intake (,1 cup/mo, 1 cup/mo to 4 cups/wk, 5–7 cups/wk, $2 cups/d).
whereas sICAM-1 is a soluble leukocyte adhesion molecule.
They are both expressed as a result of inflammatory stimuli of
the endothelium (3). sVCAM-1 is mainly expressed in
athero-sclerotic plaques and has been suggested to be a marker of
advanced atherosclerosis (49). Our finding of lower
concentra-tions of IL-18 and sVCAM-1 with higher intakes of specific
flavonoids and lower CRP and TNF-R2 with intake of citrus
fruits may therefore have implications for the development of
CVD and type 2 diabetes.
Although several epidemiological studies and clinical
inter-vention studies have suggested beneficial effects of
flavonoid-rich foods for inflammation and endothelial dysfunction
bio-markers (18,26,50–53), few studies have directly investigated
flavonoid intakes and none, to our knowledge, using the updated
USDA database from 2007 (9). In the studies conducted to date,
typically only a limited number of flavonoid subclasses or
individual compounds have been examined. In a small
cross-sectional analysis in 344 apparently healthy U.S. women, no
association between intakes of total flavonols and flavones and
plasma CRP and IL-6 concentrations was observed. In contrast,
a large cross-sectional study including 8335 U.S. adults (25)
found significant inverse associations between intakes of
flavo-nols, anthocyanidins, isoflavones, and total flavonoids and
lower CRP concentrations. The inconsistency of the results
may be attributed to the small sample size in the first study,
giving low statistical power to detect any associations, or it may
be due to differences in calculated flavonoid intakes.
Our observation that intakes of the citrus fruit flavonoids
were inversely associated with plasma IL-18 is supported by
results from several laboratory and animal studies showing
effects on biomarkers of inflammation and endothelial
dysfunc-tion (54–57). Moreover, a human intervendysfunc-tion study showed
significantly lower CRP concentrations after consumption of
juice containing oranges and black currents for 28 d compared
with a control beverage (16). In a very recent study,
inflamma-tion induced by a high-fat, high-carbohydrate meal was
signif-icantly reduced in participants consuming orange juice
compared with a glucose control drink (58). In the present
study, we also observed that higher total citrus fruit
consump-tion was associated with lower IL-18 concentraconsump-tions and that
grapefruit consumption was associated with lower CRP and
TNF-R2 concentrations. A cross-sectional study in children
reported a borderline significant inverse association between
intakes of a combination of citrus fruits and melons and CRP
concentration (27), supporting our observations. However,
Chun et al. (25) observed no relationship between citrus fruits,
citrus fruit juice intakes, intake of flavones, or flavanones and
CRP concentrations in adults. The difference in results may be
explained by the fact that participants in the study by Chun et al.
(59) were younger, that different dietary assessment methods
were used, or the intakes of flavanones and flavones were higher
in the present study. The median daily intake of flavanones in the
present study was, e.g., twice as high as the mean intake in the
study by Chun et al. (59).
We observed an inverse association between flavonol intake
and plasma sVCAM-1, but no associations were found between
intakes of tea, onions, or apples, 3 major food sources of
flavonols, and sVCAM-1. This may be due to the rather small
variation in intake of these foods and it may also be due to some
misclassification of apple intake, because apples and pears were
assessed by the same question in the FFQ, although the per
capita availability of apples accounted for 88% of the total
availability of apples and pears in the US in 1990 (37). To our
knowledge, no previous observational study has investigated the
association between flavonol and cellular adhesion molecules.
Flavonoid compounds are structurally diverse and therefore
specific structural characteristics may be responsible for
differ-ent bioactivities. Mounting evidence supports that mechanisms
other than the classical hydrogen-donating antioxidative activity
per se may be responsible for putative antiinflammatory effects
of specific flavonoids (60). Several flavonoids have, e.g., been
shown to inhibit the expression of NF-kB, an important
re-gulator of a number of cytokines and cell adhesion molecules.
NF-kB regulates the activity of the enzyme transforming inactive
pro-IL-18 to active IL-18, and hence citrus flavonoids may in
that way indirectly inhibit the formation of active IL-18, as was
recently suggested for (n-3) fatty acids (61).
Our study has several limitations. First, because of the
cross-sectional design, we cannot infer the causality from our results.
Second, despite extensive adjustments for potential confounding
factors, we cannot rule out that part of the observed associations
might be due to a healthy lifestyle or due to other bioactive
compounds present in flavonoid-rich foods. Third, some
mea-surement errors are likely due to imperfect meamea-surement of food
intake by FFQ, food composition data, and biomarker
mea-surements. For example, it was not possible to differentiate dark
FIGURE 1 Multivariable-adjusted geomet-ric means (95% CI) of plasma concentrations of the inflammation biomarkers IL-18 (A,B), CRP (C,E), and TNF-R2 (D,F) by serving categories of total citrus (oranges + grape-fruit + juices) (A,E,F) and grapefruit (fruit + juice) (B,C,D) in the NHS (n = 1087–1598). Models were adjusted for the same cova-riates as described in Table 3. One serving corresponds to 131 g (oranges), 65.5 g (grapefruit), and 186 g (juices).
chocolate, which is a rich source of monomeric and polymeric
flavan-3-ols, from lighter chocolate. Fourth, we evaluated many
associations, which increases the likelihood of chance findings
and our findings require confirmation in independent studies.
The present study also has several strengths, including the use of
a validated FFQ, which reflect long-term food intake. We also
used an updated flavonoid database containing a large number
of foods that are representative for an American population for
the assessment of 6 flavonoid subclasses. Moreover, 7 different
biomarkers were measured in a large number of individuals,
which allowed us to comprehensively assess the role of
flavo-noids associated with potentially different aspects of
inflamma-tion and endothelial funcinflamma-tion. The analyzed biomarkers have
been proven stable throughout collection and laboratory
processing (31). Because all biomarkers except IL-18 were
analyzed at different occasions over the period of 1994–2004,
we adjusted for batch to take into account potential differences
in losses over time and laboratory drift. Furthermore,
bio-markers used in this study have been shown to be stable within
individuals over long time periods (1–12 y depending on
biomarker) showing that a single sample will represent
indi-viduals’ long-term concentrations with acceptable precision
(62–64).
In summary, this study suggests that higher intakes of selected
subclasses of flavonoids are associated with modestly lower
plasma concentrations of inflammatory biomarkers.
Particu-larly, flavonoids from citrus fruits appear to be consistently
associated with modestly lower concentrations of IL-18.
Acknowledgments
The study was conceived and designed by R.L. and R.M.v.D;
R.L. analyzed the data; C.S.M. was responsible for IL-18
assays; A.C. contributed to the flavonoid database for the NHS;
R.L., Q.S., E.B.R., A.C., A.S., F.B.H., and R.M.v.D. contributed
to the interpretation of the data and critically revised the
manuscript for important intellectual content; and R.L. and
R.M.v.D. wrote the paper. All authors read and approved the
final manuscript.
Literature Cited
1. Ridker PM. Clinical application of C-reactive protein for cardiovascular disease detection and prevention. Circulation. 2003;107:363–9. 2. Libby P. Inflammation in atherosclerosis. Nature. 2002;420:868–74. 3. Ross R. Atherosclerosis: an inflammatory disease. N Engl J Med.
1999;340:115–26.
4. Dandona P, Aljada A, Chaudhuri A, Mohanty P, Garg R. Metabolic syndrome: a comprehensive perspective based on interactions between obesity, diabetes, and inflammation. Circulation. 2005;111:1448–54. 5. Hu FB, Meigs JB, Li TY, Rifai N, Manson JE. Inflammatory markers
and risk of developing type 2 diabetes in women. Diabetes. 2004;53: 693–700.
6. Fischer CP, Perstrup LB, Berntsen A, Eskildsen P, Pedersen BK. Elevated plasma interleukin-18 is a marker of insulin-resistance in type 2 diabetic and non-diabetic humans. Clin Immunol. 2005;117:152–60. 7. Gabay C, Kushner I. Acute-phase proteins and other systemic responses
to inflammation. N Engl J Med. 1999;340:448–54.
8. Erdman JW, Balentine D, Arab L, Beecher G, Dwyer JT, Folts J, Harnly J, Hollman P, Keen CL, et al. Flavonoids and heart health: proceedings of the ILSI North America flavonoids workshop, May 31-June 1, 2005, Washington, DC. J Nutr. 2007;137:S718–37.
9. USDA. Database for the flavonoid content of selected foods. Beltsville (MD): USDA; 2007.
10. Pe´rez-Jime´nez J, Neveu V, Vos F, Scalbert A. Systematic analysis of the content of 502 polyphenols in 452 foods and beverages: an application of the Phenol-explorer database. J Agric Food Chem. 2010;58:4959–69.
11. Scalbert A, Manach C, Morand C, Re´me´sy C, Jime´nez L. Dietary polyphenols and the prevention of diseases. Crit Rev Food Sci Nutr. 2005;45:287–306.
12. Crozier A, Jaganath IB, Clifford MN. Dietary phenolics: chemistry, bioavailability and effects on health. Nat Prod Rep. 2009;26:1001–43. 13. Rotelli AE, Guardia T, Jua´rez AO, de la Rocha NE, Pelzer LE. Comparative study of flavonoids in experimental models of inflamma-tion. Pharmacol Res. 2003;48:601–6.
14. Manach C, Williamson G, Morand C, Scalbert A, Remesy C. Bioavail-ability and bioefficacy of polyphenols in humans. I. Review of 97 bioavailability studies. Am J Clin Nutr. 2005;81:S230–42.
15. Williamson G, Manach C. Bioavailability and bioefficacy of polyphe-nols in humans. II. Review of 93 intervention studies. Am J Clin Nutr. 2005;81:S243–55.
16. Dalga˚rd C, Nielsen F, Morrow JD, Enghusen-Poulsen H, Jonung T, Ho¨rder M, de Maat MPM. Supplementation with orange and black-currant juice, but not vitamin E, improves inflammatory markers in patients with peripheral arterial disease. Br J Nutr. 2009;101:263–9. 17. Hooper L, Kroon PA, Rimm EB, Cohn JS, Harvey I, Le Cornu KA,
Ryder JJ, Hall WL, Cassidy A. Flavonoids, flavonoid-rich foods, and cardiovascular risk: a meta-analysis of randomized controlled trials. Am J Clin Nutr. 2008;88:38–50.
18. Steptoe A, Gibson EL, Vuononvirta R, Hamer M, Wardle J, Rycroft JA, Martin JF, Erusalimsky JD. The effects of chronic tea intake on platelet activation and inflammation: a double-blind placebo controlled trial. Atherosclerosis. 2007;193:277–82.
19. Sung H, Min W-K, Lee W, Chun S, Park H, Lee Y-W, Jang S, Lee D-H. The effects of green tea ingestion over four weeks on atherosclerotic markers. Ann Clin Biochem. 2005;42:292–7.
20. de Maat MPM, Pijl H, Kluft C, Princen HMG. Consumption of black and green tea has no effect on inflammation, haemostasis and endothelial markers in smoking healthy individuals. Eur J Clin Nutr. 2000;54:757–63.
21. Jenkins DJA, Kendall CWC, Connelly PW, Jackson C-JC, Parker T, Faulkner D, Vidgen E. Effects of high- and low-isoflavone (phytoes-trogen) soy foods on inflammatory biomarkers and proinflammatory cytokines in middle-aged men and women. Metabolism. 2002;51: 919–24.
22. Bae S-C, Jung W-J, Lee E-J, Yu R, Sung M-K. Effects of antioxidant supplements Intervention on the level of plasma inflammatory mole-cules and disease severity of rheumatoid arthritis patients. J Am Coll Nutr. 2009;28:56–62.
23. Freese R, Vaarala O, Turpeinen A, Mutanen M. No difference in platelet activation or inflammation markers after diets rich or poor in vegetables, berries and apple in healthy subjects. Eur J Nutr. 2004;43:175–82. 24. Auclair S, Chironi G, Milenkovic D, Hollman PCH, Renard CMGC,
Megnien JL, Gariepy J, Paul JL, Simon A, et al. The regular consumption of a polyphenol-rich apple does not influence endothelial function: a randomised double-blind trial in hypercholesterolemic adults. Eur J Clin Nutr. 2010;64:1158–65.
25. Chun OK, Chung SJ, Claycombe KJ, Song WO. Serum c-reactive protein concentrations are inversely associated with dietary flavonoid intake in US adults. J Nutr. 2008;138:753–60.
26. De Bacquer D, Clays E, Delanghe J, De Backer G. Epidemiological evidence for an association between habitual tea consumption and markers of chronic inflammation. Atherosclerosis. 2006;189:428–35. 27. Qureshi MM, Singer M, Moore L. A cross-sectional study of food group
intake and C-reactive protein among children. Nutr Metab (Lond). 2009;6:40.
28. Song Y, Manson JE, Buring JE, Sesso HD, Liu S. Associations of dietary flavonoids with risk of type 2 diabetes, and markers of insulin resistance and systemic inflammation in women: a prospective study and cross-sectional analysis. J Am Coll Nutr. 2005;24:376–84.
29. Colditz GA. The nurses’ health study: a cohort of US women followed since 1976. J Am Med Womens Assoc. 1995;50:40–4.
30. Pai JK, Pischon T, Ma J, Manson JE, Hankinson SE, Joshipura K, Curhan GC, Rifai N, Cannuscio CC, et al. Inflammatory markers and the risk of coronary heart disease in men and women. N Engl J Med. 2004;351:2599–610.
31. Pai JK, Curhan GC, Cannuscio CC, Rifai N, Ridker PM, Rimm EB. Stability of novel plasma markers associated with cardiovascular dis-ease: processing within 36 hours of specimen collection. Clin Chem. 2002;48:1781–4.
32. Feskanich D, Rimm EB, Giovannucci EL, Colditz GA, Stampfer MJ, Litin LB, Willett WC. Reproducibility and validity of food intake measurements from a semiquantitative food frequency questionnaire. J Am Diet Assoc. 1993;93:790–6.
33. Cassidy A, O’Relly E´, Kay C, Sampson L, Franz M, Forman JP, Curhan GC, Rimm EB. Habitual intake of flavonoid subclasses and incident hypertension in adults. Am J Clin Nutr. 2011;93:.
34. USDA. Database for the proanthocyanidin content of selected foods. Beltsville (MD): USDA; 2004.
35. Gry J, Black L, Eriksen FD, Pilegaard K, Plumb J, Rhodes M, Sheehan D, Kiely M, Kroon PA. EuroFIR-BASIS: a combined composition and biological activity database for bioactive compounds in plant-based foods. Trends Food Sci Technol. 2007;18:434–44.
36. Willett W, Stampfer MJ. Total energy intake: implications for epidemi-ologic analyses. Am J Epidemiol. 1986;124:17–27.
37. Economic Research Service. USDA. Food availability (per capita) data system [cited 2010 Nov 5]. Available from: http://www.ers.usda.gov/ Data/FoodConsumption2010.
38. Wolf AM, Hunter DJ, Colditz GA, Manson JE, Stampfer MJ, Corsano KA, Rosner B, Kriska A, Willett WC. Reproducibility and validity of a self-administered physical activity questionnaire. Int J Epidemiol. 1994;23:991–9.
39. Landmesser U, Hornig B, Drexler H. Endothelial function: a critical determinant in atherosclerosis? Circulation. 2004;109(21 Suppl 1):II-27–33.
40. Zhang C. The role of inflammatory cytokines in endothelial dysfunc-tion. Basic Res Cardiol. 2008;103:398–406.
41. Luc G, Bard J-M, Juhan-Vague I, Ferrieres J, Evans A, Amouyel P, Arveiler D, Fruchart J-C, Ducimetiere P. C-reactive protein, interleukin-6, and fibrinogen as predictors of coronary heart disease: The PRIME study. Arterioscler Thromb Vasc Biol. 2003;23:1255–61.
42. Ridker PM, Hennekens CH, Buring JE, Rifai N. C-Reactive protein and other markers of inflammation in the prediction of cardiovascular disease in women. N Engl J Med. 2000;342:836–43.
43. Yudkin JS, Kumari M, Humphries SE, Mohamed-Ali V. Inflammation, obesity, stress and coronary heart disease: is interleukin-6 the link? Atherosclerosis. 2000;148:209–14.
44. Ware CF. The TNF superfamily 2008. Cytokine Growth Factor Rev. 2008;19:183–6.
45. McDermott MF. TNF and TNFR biology in health and disease. Cell Mol Biol. 2001;47:619–35.
46. Hivert MF, Sun Q, Shrader P, Mantzoros CS, Meigs JB, Hu FB. Circulating IL-18 and the risk of type 2 diabetes in women. Diabetologia. 2009;52:2101–8.
47. Chandrasekar B, Colston JT, de la Rosa SD, Rao PP, Freeman GL. TNF-a TNF-and H2O2induce IL-18 and IL-18Rb expression in cardiomyocytes
via NF-kB activation. Biochem Biophys Res Commun. 2003;303: 1152–8.
48. Meigs JB, Hu FB, Rifai N, Manson JE. Biomarkers of endothelial dysfunction and risk of type 2 diabetes mellitus. JAMA. 2004;291: 1978–86.
49. Blake GJ, Ridker PM. Inflammatory bio-markers and cardiovascular risk prediction. J Intern Med. 2002;252:283–94.
50. Esmaillzadeh A, Kimiagar M, Mehrabi Y, Azadbakht L, Hu FB, Willett WC. Dietary patterns and markers of systemic inflammation among Iranian women. J Nutr. 2007;137:992–8.
51. Gao X, Bermudez OI, Tucker KL. Plasma C-reactive protein and homocysteine concentrations are related to frequent fruit and vegetable intake in Hispanic and non-Hispanic white elders. J Nutr. 2004;134:913–8. 52. Lopez-Garcia E, Schulze MB, Fung TT, Meigs JB, Rifai N, Manson JE, Hu FB. Major dietary patterns are related to plasma concentrations of markers of inflammation and endothelial dysfunction. Am J Clin Nutr. 2004;80:1029–35.
53. Monagas M, Khan N, Andres-Lacueva C, Casas R, Urpi-Sarda M, Llorach R, Lamuela-Raventos RM, Estruch R. Effect of cocoa powder on the modulation of inflammatory biomarkers in patients at high risk of cardiovascular disease. Am J Clin Nutr. 2009;90:1144–50. 54. Garg A, Garg S, Zaneveld LJD, Singla AK. Chemistry and
pharmacol-ogy of the citrus bioflavonoid hesperidin. Phytother Res. 2001;15: 655–69.
55. Bodet C, La VD, Epifano F, Grenier D. Naringenin has anti-inflamma-tory properties in macrophage and ex vivo in human whole-blood models. J Periodontal Res. 2008;43:400–7.
56. Kawaguchi K, Kikuchi S, Hasunuma R, Maruyama H, Yoshikawa T, Kumazawa Y. A citrus flavonoid hesperidin supresses infection-induced endotoxin shock in mice. Biol Pharm Bull. 2004;27:679–83. 57. Yeh C-C, Kao S-J, Lin C-C, Wang S-D, Liu C-J, Kao S-T. The
immunomodulation of endotoxin-induced acute lung injury by hesper-idin in vivo and in vitro. Life Sci. 2007;80:1821–31.
58. Ghanim H, Sia CL, Upadhyay M, Korzeniewski K, Viswanathan P, Abuaysheh S, Mohanty P, Dandona P. Orange juice neutralizes the proinflammatory effect of a high-fat, high-carbohydrate meal and prevents endotoxin increase and Toll-like receptor expression. Am J Clin Nutr. 2010;91:940–9.
59. Chun OK, Chung SJ, Song WO. Estimated dietary flavonoid intake and major food sources of U.S. adults. J Nutr. 2007;137:1244–52. 60. Sies H. Polyphenols and health: update and perspectives. Arch Biochem
Biophys. 2010;501:2–5.
61. Trøseid M, Arnesen H, Hjerkinn EM, Seljeflot I. Serum levels of interleukin-18 are reduced by diet and n-3 fatty acid intervention in elderly high-risk men. Metabolism. 2009;58:1543–9.
62. Danesh J, Wheeler JG, Hirschfield GM, Eda S, Eiriksdottir G, Rumley A, Lowe GDO, Pepys MB, Gudnason V. C-reactive protein and other circulating markers of inflammation in the prediction of coronary heart disease. N Engl J Med. 2004;350:1387–97.
63. Kno¨dler M, Kaiser A, Carle R, Schieber A. Profiling of alk(en) ylresorcinols in cereal by HPLC-DAD-APcI-MSn. Anal Bioanal Chem. 2008;391:221–8.
64. Linkov F, Gu Y, Arslan AA, Liu M, Shore RE, Velikokhatnaya L, Koenig KL, Toniolo P, Marrangoni A, et al. Reliability of tumor markers, chemokines, and metastasis-related molecules in serum. Eur Cytokine Netw. 2009;20:21–6.
![TABLE 1 Characteristics in 1990 according to quintiles of total flavonoid intake in the NHS 1 Total flavonoids 2 Q1, n = 403 Q2, n = 402 Q3, n = 402 Q4, n = 403 Q5, n = 402 Median [IQR], 3 mg/d 107 [47] 174 [31.7] 243 [44.8] 375 [88.9] 801 [455.3] Age, y 5](https://thumb-eu.123doks.com/thumbv2/123doknet/14022708.457532/3.877.144.728.525.974/table-characteristics-according-quintiles-flavonoid-intake-flavonoids-median.webp)