Airline Revenue Management Methods for Less Restricted Fare Structures
By
Richard L. Cleaz-Savoyen
Ingenieur des Arts et Manufactures (ECP 2003)
Submitted to the Department of Aeronautics and Astronautics
in partial Fulfillment of the Requirements for the Degree of Master of Science
in Aeronautics and Astronautics
At the
Massachusetts Institute of Technology
May 2005 A f 2
1st Copy
© 2005 Massachusetts Institute of Technology All Rights Reserved
MASSACHUSES INSTI E OF TECHNOLOGY
JUN 2 3 2005
LIBRARIES
Sig nature of Author
...
...
International Center for Air Transportation
Department of Aeronautics and Astronautics
May 10, 2005
Certified by ...
Dr Peter P. Belobaba
Principal Research Scientist
Department of Aeronautics and A tronautics
TV sisS
pervisorA cce pted by
...
.. ... w \ ...
Jaime Peraire
Professor of Aeronautics and Astronautics
Chair, Committee on Graduate Student
Airline Revenue Management Methods for Less Restricted Fare Structures
By
Richard L. Cleaz-Savoyen
Submitted to the Department of Aeronautics and Astronautics
on May 11, 2005, in partial Fulfillment of the Requirements for the Degree of
Master of Science in Aeronautics and Astronautics
ABSTRACT
Traditional Revenue Management systems were developed to maximize airlines' revenues in restricted fare product environments, based on the assumption of independence of demand by fare class. With the rapid emergence of low-cost carriers in various parts of the world, the pricing environments have changed. The network carriers have had to deal with undifferentiated fare structures, for which demand for each fare class can no longer be assumed to be independent, given that customers systematically buy the lowest fare available in the absence of distinctions between fare products. In these fare structures, traditional Revenue Management systems lead to a "spiral down" of revenues.
The first goal of this thesis is to present two alternatives that address the problem described above, allowing airlines to partially recover from the decrease in revenue which occurs when an airline removes the restrictions in its fare structure. These alternatives are designed for implementation into O&D-Control - or network Revenue
Management - methods. The alternative methods are based on the sell-up
probability, which is the probability that a passenger is willing to buy a higher-fare ticket in case his/her request is denied. One of the methods ("Q-Forecasting") modifies the forecaster by estimating the demand based on the probability of sell-up, while the other ("Fare Adjustment") acts at the booking limit optimizer level, accounting again for the sell-up potential. We focus in this thesis on explaining the processes and mechanisms involved in these two methods, how they are linked and complement each other, but also on their performances based on a simulator which allows us to observe the impact of each method under various characteristics of the booking process.
Thesis Advisor: Dr Peter P. Belobaba
ACKNOWLEDGEMENTS
My first acknowledgements are to my thesis and research advisor, Dr Peter Belobaba, in regards to all his help. He taught me the basics and then the less obvious aspects of airline Revenue Management, as well as the tortuous evolutions of the Passenger Origin Destination Simulator on which this thesis is based. He provided me great support and helped me to correct the mistakes I made.
A special "thank you" to Craig Hopperstad with whom I spent several hours on the phone - at decent hours of the day to satisfy both Boston and Seattle times - to understand the new models implemented in each version of PODS. We only met 4 times, at the PODS conferences, but our discussions have always been dense and interesting. Without the simulator Craig developed at Boeing, I could not have done the simulation part of this thesis.
Then, I would like to thank Thomas Fiig, from SAS, who helped me with the Fare Adjustment method he developed in collaboration with Karl Isler from Swissair. Thomas spent several days in January 2005 in Boston and many hours on the phone
with me - from Copenhagen - to help me understand the subtleties of this new method which represents half of my thesis in terms of both theoretical descriptions and simulation analyses.
Hereafter I present my acknowledgements to the remaining members of the PODS Consortium, composed of Air France-KLM, Air New Zealand, Continental Airlines, Delta Airlines, LAN, Lufthansa, Northwest Airlines, SAS and Swissair. At each PODS conference, their representatives provided comments on my results and guidance in the future research directions. They introduced in my thesis the point of view from the real world, especially regarding the unrestricted environments and the
competition with Low-Cost Carriers.
I would like to thank the amazing student team of the MIT International Center for Air Transportation. Especially: Thomas Gorin, Emmanuel Carrier, Kendell Timmers and Maital Dar - with whom I worked on PODS - who helped me understand the simulator.
Even if Europe and France are maybe a little bit far from Boston, I thank my family for helping me make it to MIT and supporting me every day.
Unless they did not help me to understand Revenue Management, last but not least, I thank all my friends at MIT, but also in Boston, in France, Germany, England,
Russia, Austria, China, and Canada for their support during these two great years in New England.
AUTHOR'S BIOGRAPHY
The author comes from Grenoble, a city in the French Alps, near Lyon, where he did his undergraduate studies in science. In 2000, after a competitive exam, he entered the Ecole Centrale Paris, a French engineering "Grande Ecole", where he specialized in Aeronautics during the third year. At the end of this school, he did a 4-month training at Snecma Moteurs, where he worked as manufacturing engineer on a project related to the high pressure compressor blades of the GE90 aircraft engine. Finally, he entered MIT in September 2003 in the Aero/Astro department as a Graduate student, for a Master of Science. He quickly specialized in flight transportation and took the following classes:
Air Traffic Control (Hansman, Clarke) Airline Industry (Belobaba)
Airline Management (Belobaba)
Logistical and Transportation Planning Methods (Odoni, Barnett, Larson) Airport System Planning, Design and Management (Odoni, DeNeufville) Air Transportation System Architecting (Hansman, Clarke, Murman) Applied Probabilities (Tsitsiklis)
Airline Schedule Planning (Barnhart) - as listener
While at MIT, the author began in January 2004 working as Research Assistant with Dr Peter Belobaba on the Passenger Origin Destination Simulator (PODS) Project. For this research, he attended the PODS conferences in Amsterdam (May 2004), Minneapolis-St Paul (September 2004), Boston (January 2005) and Copenhagen (May 2005). Rapidly, he worked on topics related to unrestricted environments which would become the topic of this thesis due in May 2005. These two years at MIT will hopefully end with the AGIFORS conference in Cape Town (South Africa), a few days before Commencement.
TABLE OF CONTENTS
LIST OF FIGURES
8
LIST OF TABLES
10
LIST OF ABBREVIATIONS
11
1.
INTRODUCTION
12
1.1. Revenue Management 121.2. Changes in Airline Industry and Market Structure 13
1.3. Recently Developed New Approaches 14
1.3.1. Forecasting and Sell-up 14
1.3.2. New Methods: "Q-Forecasting" and "Fare Adjustment" 15
1.4. Goal of the Thesis 15
1.5. Structure of the Thesis 16
2.
LITERATURE REVIEW
17
2.1. Review of Revenue Management's Traditional Assumptions and
Algorithms 17
2.1.1. Overbooking Models 18
2.1.2. Fare Class Mix Models 18
2.1.3. OD Control Models 19
2.2. The Low-Cost Carrier Model 20
2.3. Traditional Revenue Management in Less Restricted Environments: the
"Spiral Down" Effect 21
3.
APPROACH
24
3.1. PODS Overview 24
3.1.1. The Simulator 24
3.1.2. The Network Parameters 26
3.1.3. The Passengers 26
3.1.4. Forecasting and Detruncation 29
3.1.5. Revenue Management - Seat Inventory Control 31
3.2. The Specifics of PODS Related to this Thesis 36
3.2.2. Fare Products
3.3. Sell-up: Introducing Alternatives to Address the Unrestricted
Environments' "Spiral Down" Problem 41
3.3.1. Traditional Sell-up Utilization 41
3.3.2. New Methods to Address Undifferentiated Environments 42
3.4. Q-Forecasting 43
3.4.1. Overview of Processes and Concepts 43
3.4.2. The Sell-up Formulation 44
3.4.3. Sell-up Parameters in PODS 48
3.4.4. The Sell-up Estimator 50
3.5. Fare Adjustment Methods 53
3.5.1. Overview of the Process 53
3.5.2. Formulation 56
3.5.3. PODS parameters 56
3.5.4. Differences with Q-Forecasting 57
4.
SIMULATION RESULTS
62
4.1. Traditional RM in Unrestricted Environments: Spiral-Down Effect 62
4.1.1. Performance in the Single Market Case 62
4.1.2. Performance in Network D 65
4.2. Performance of Q-Forecasting (QF) 66
4.2.1. Input 66
4.2.2. Estimator 74
4.2.3. Conclusion 80
4.3. Performance of Fare-Adjustment Methods (FA) 81
4.3.1. Input Frat5 values 81
4.3.2. Impact of Fare Adjustment Methods on DAVN 82
4.3.3. Sensitivity to Input Frat5 85
4.3.4. Conclusion 88
4.4. Combination of Q-Forecasting and Fare Adjustment Methods 88
4.4.1. Using the same Input Frat5 88
4.4.2. Matrices of inputs 95
4.4.3. Conclusion 100
5.
CONCLUSION AND FUTURE RESEARCH DIRECTIONS
101
5.1. Summary of Findings 101
5.2. Future Research Directions 103
LIST OF FIGURES
Figure 1: Spiral-Down Effect...23
Figure 2: PODS Flow Chart...25
Figure 3: The Two Main Components of PODS ... 26
Figure 4: Arrival Curves by Passenger Type ... 27
Figure 5: Willingness-To-Pay Curves by Passenger Type ... 27
Figure 6: Passenger Choice Model - Process Overview...28
Figure 7: Detruncation/Forecasting Process ... 29
Figure 8: Booking Curve Detruncation Process...30
Figure 9: Projection Detruncation Process...30
Figure 10: EMSR Curve and Booking Limits... 32
Figure 11: The Nested Booking Limits ... 32
Figure 12: Simple 2-legs OD Market ... 33
Figure 13: EMSR Optimization in the GVN Case ... 33
Figure 14: EMSR Curves in the case of HBP ... 35
Figure 15: Single Market ... 36
Figure 16: ALl's Network ... 37
Figure 17: AL2's Network ... 38
Figure 18: AL3 (New Entrant)'s Network... 38
Figure 19: Additional Protection from Sell-up Accounting in the EMSR Optimization 42 Figure 20: Q-Forecasting Process Overview...44
Figure 21: Typical Frat5 Curve ... 45
Figure 22: Probability of Sell-up Curves as a function of the fare ratio ... 46
Figure 23: Probability of Sell-up as a Function of Time-Frame...46
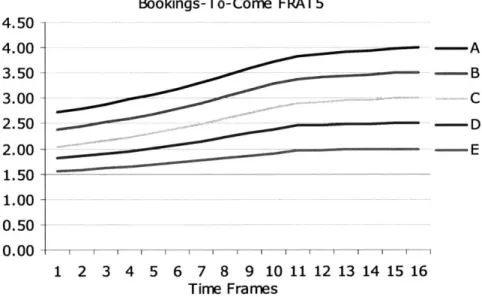
Figure 24: Time-Frame Frat5 as a Function of Time-Frames ... 49
Figure 25: Bookings-To-Come Frat5 as a Function of Time-Frames...49
Figure 26: Sell-up Estimation Process ... 50
Figure 27: Co-existence of distinct fare structures on the same leg ... 54
Figure 28: Decoupling the Fare Structures ... 55
Figure 29: Insertion of MR into the DAVN Process ... 55
Figure 30: Representation of the MR curves as a function of
Q...
57Figure 31: States of the system ... 58
Figure 32: Sell-up data ... 58
Figure 33: Sell-up rate when the RMS are independent...59
Figure 34: Sell-up rate when the RMS are highly correlated ... 60
Figure 35: Insertion of MR and QF into the DAVN process ... 61
Figure 36: Trend in Airline 1 's Revenue when a shock occurs at sample 200 ... 63
Figure 37: Revenue of ALl as a Function of Demand Factor, Without and With Shock ... 6 4 Figure 38: Revenue of ALl With Various RM Methods ... 65
Figure 39: Impact of Q-Forecasting on ALl and AL2 Revenues...67
Figure 40: Impact of Q-Forecasting on AL1, AL2 and AL3 Network Loads...67
Figure 41: Impact of Q-Forecasting on ALl Local Loads in the NEM ... 68
Figure 42: Impact of Q-Forecasting on ALl Passenger Types in the NEM ... 69
Figure 43: Daily Number of Bookings for ALl in Q Class...70
Figure 44: Daily Number of Bookings for ALl in Y Class ... 70
Figure 45: Impact of the LCC's RM on AL1's Revenue Gains Due to QF...71
Figure 46: Impact of QF on ALl and AL3 Local Loads when AL3 uses FT...72
Figure 47: Impact of AL1's RM on the Revenue Gains Due to QF With Respect to EMSRb/EMSRb/EMSRQ2...72
Figure 48: Frat5 sets "B" and "D" as a function of Time-Frame ... 73
Figure 49: Impact of a change in Frat5 on AL1 and AL3 Revenues...74
Figure 50: Performance of the Sell-up Estimator in Terms of Revenues ... 75
Figure 51: Impact of the Estimator on AL1 Local and Connecting Pax in the NEM... .76
Figure 52: AL1 Local Loads in the NEM ... 76
Figure 53: AL1 Connecting Loads in the NEM...77
Figure 54: Estimated Frat5 Compared with Medium Input ... 77
Figure 55: Sensitivity to Demand Factor in terms of Revenues...78
Figure 56: Sensitivity of Demand Factor in terms of Loads ... 79
Figure 57: AL1 Fare Mix Trend as a Function of DF...79
Figure 58: Changes in Frat5 (as a Function of TF) When DF Increases ... 80
Figure 59: Fare Adjustment Frat5 Curves as a Function of Time-Frame ... 81
Figure 60: Impact of the FA Method on AL1 and AL3 Revenues ... 82
Figure 61: Impact of the FA Method on the Local/Connecting Passengers ... 83
Figure 62: Impact of the FA Method on AL1 Local Loads in the NEM ... 84
Figure 63: Impact of the FA Method on AL1 Connecting Loads in the NEM ... 84
Figure 64: AL1 Adjusted Fares in the NEM ... 85
Figure 65: Sensitivity to FA Frat5 ... 86
Figure 66: Adjusted B Fares in the 10 NEM ... 86
Figure 67: Adjusted M Fares in the 10 NEM... 87
Figure 68: Adjusted Q Fares in the 10 NEM... 87
Figure 69: Frat5 Sets Used For Both QF and FA Methods...88
Figure 70: Revenue of AL1 and AL2 When AL1 Uses Frat5 Set "1" For QF and FA .... 89
Figure 71: AL1 and AL3 Local and Connecting Passengers...89
Figure 72: AL1 Local Passengers Fare Class Mix on the 10 Legs ... 90
Figure 73: AL1 Connecting Passengers Fare Class Mix on the 10 Legs...90
Figure 74: Adjusted Fares of AL1 in the 10 NEM ... 91
Figure 75: Evolution of AL1 Revenue When Frat5 Sets Vary From A to L ... 91
Figure 76: AL1 Adjusted B Fares in the 10 NEM ... 92
Figure 77: AL1 Adjusted M Fares in the 10 NEM...92
Figure 78: AL1 Adjusted Fares in the 10 NEM...93
Figure 79: ALl's Revenue Sensitivity to Frat5 When Using FA and Additional Benefits D ue to Q F ... 94
Figure 80: Frat5 sets used as input in the Figure 79...94
Figure 81: QF Time-Frame Frat5 Sets Used in the Matrices ... 95
Figure 82: FA Time-Frame Frat5 Sets Used in the Matrices...95
Figure 83: AL1 Revenue Depending on QF and FA Frat5...96
Figure 84: Impact of a Decrease in Demand (DF=0.9)...97
Figure 85: Impact of an Increase in Demand (DF= 1.1)...98
Figure 86: Impact of a Decrease in the LCC's Capacity (from 30 to 20)...99
Figure 87: Evolution of the Optimal Frat5 Couple with the DF ... 100
LIST OF TABLES
Table 1: Example of Fare Class Structure in the Process of Optimizing the Seat
In ventory ... 3 1 Table 2: Impact of the New Entrant on ALl's network (Source: Gorin4 4
)...39
Table 3 Time-Frames Definitions ... 39
Table 4: Traditional 4 Fare Classes Structure ... 39
Table 5: Unrestricted 4 Fare Classes Structure ... 40
Table 6: Unrestricted 8 Fare Classes Structure ... 40
Table 7: Scale-Down Computation for a 4-fare classes structure ... 47
Table 8: Re-partitioning Computation for a 4 Fare Classes Structure...48
Table 9: 4-Fare-class Price Structure ... 62
Table 10: Restricted Fare Product in the 4-Fare-Class Case ... 63
Table 11: Unrestricted Fare Product in the 4-Fare-Class Case ... 63
Table 12: Revenue Gains of Each RM Method with Respect to FCFS ... 74
Table 13: Values of the FA-Frat5 Sets at TF and TF16-.--... . . . .. . . . .82
LIST OF
ABBREVIATIONS
AT AP BKD BKG BK BTC BP CAP DAVN DN DP DWM EMSR FA FCFS FCYM FT Frat5 GVN HBP KI LCC LFA LP MR NEM OD PAX PODS Pro-BP PUMA QF Ri RM RMS SIC TR TF WTP YMAdaptive (or Accordion) Threshold Advance Purchase Booked Booking(s) Booking Limit Bookings-To-Come Bid-Price Capacity
Displacement Adjusted Virtual Nesting "DP New"
Dynamic Programming
Decision Window Model (by Boeing) Expected Marginal Seat Revenue Fare Adjustment
First Come First Served Fare Class Yield Management Fixed Threshold
Fare Ratio to
Q at which 50% of the passengers accept to buy-up
Greedy Virtual NestingHeuristic Bid-Price Karl Isler Low-Cost Carrier Low-Fare Airline Linear Program Marginal Revenue New Entrant Market(s) Origin-Destination
Passengers
Passenger Origin-Destination Simulator Probabilistic Bid-Price
Pick-Up Moving Average Q-Forecasting
Restriction number i (stronger as i is smaller) Revenue Management
Revenue Management System(s) Seat Inventory Control
Total Revenue Time-Frame Willingness-To-Pay Yield Management
1.
INTRODUCTION
The goal of this thesis is to present and evaluate the performance of recently developed methods for adapting traditional Revenue Management algorithms to less restricted fare structures. Since the end of the 1970's, airlines across the world have developed more and more sophisticated Revenue Management methods to optimize the seat inventory control and therefore maximize their revenue. These airlines based their Revenue Management algorithms on strong assumptions, such as segmentation by price differentiation and independence of demand and behavior by passenger types. The segmentation was achieved by selling the same seat at different fares depending on associated advance purchase requirements and
restrictions - Saturday night stay, change fees and non-refundability of ticket.
These assumptions are now more and more violated, because of the change in consumer behavior, the emergence of the low-cost carriers and the dramatic drop in demand which was seen after the events of September 11, 2001. The traditional carriers are facing new challenges - erosion of differences between passenger types, change in fare products - and are looking for new methods in order to adapt their algorithms to these new demand patterns and new competitors. We will simulate in this thesis the possible revenue gains that can be achieved by implementing two
different Revenue Management alternatives in less restricted fare structures.
The simulation will use the Passenger Origin-Destination Simulator (PODS) developed at the Boeing Company by Hopperstad to simulate as accurately as possible the booking process of an airline in a competitive environment, with various levels of control over the passenger choice model, the environment and the airline Revenue Management methods settings.
1.1. Revenue Management
Revenue Management was born in the 1970s and was at first known as Yield Management (YM). Yield refers to the average fare per passenger mile. Therefore, yield management methods were logically intended to capture as many high yield passengers as possible.
Before the deregulation of the US airline industry in 1978, airline companies had no control over fares, which were determined by the Civil Aeronautics Board (CAB) on a per-mile basis. The board allowed for fare increases to compensate for operating costs and in case of losses. This led to relatively high fares, and a good level of service for those who could afford it, but revenues and loads remained low.
Starting from deregulation, the airline companies entered a competitive environment, and yield management became more and more crucial. The goal for each of them was (and still is) to increase revenue and decrease costs, of course. The airline companies compete on an OD basis, meaning that passengers choose between airlines and products on a city-pair, composed of an Origin and a Destination, generally independent from the itinerary flown in between. Consequently, fares no longer depend on distance, but vary with respect to the OD
market. In order to maximize revenues, the theoretical optimal strategy for airlines is to charge passengers at their maximum Willingness-To-Pay (WTP). In practice, this is difficult to achieve, that is why revenue management was developed, starting from the differential pricing and overbooking strategies initially introduced before deregulation.
Yield Management has been developed over the last 30 years to achieve these goals and has reached high levels of complexity to deal with complicated fare structures established by the pricing departments in each company. The aim of Yield Management remained to attract as many high yield passengers as possible while filling the aircraft and avoiding flying empty seats.
The segmentation was based on restrictions (or fare fences) such as advance purchase requirements, Saturday night stay, round trip purchase requirement, and non or partial refundability. But the complication lies in the arrival process: high yield passengers book late, whereas leisure passengers (lower willingness-to-pay) book early; Revenue Management has therefore to find a means to separate both behaviors. In order to satisfy the two goals described above, an accurate forecast of high yield demand is needed. Then, based on these forecasts, Revenue Management practices are designed to optimize the allocation of seats to a specific fare class with its associated restrictions.
Today, the level of complexity is even higher, and many different seat allocation algorithms have been developed, either flight-leg based or OD-based (most recently developed). We will describe these methods in more detail in the next chapters. Demand forecasting and seat allocation optimization, the two main aspects of Revenue Management, rely strongly on mathematical formulas and modeling approaches. These modeling approaches are changing and this thesis will deal with changes in both aspects of Revenue Management.
1.2. Changes in Airline Industry and Market Structure
Along with the increasing complexity of Revenue Management Methods, the emergence of new air service providers has changed the industry. Unlike the legacy carriers, the low-fare carriers have very low costs although they provide similar services at lower fares. And their strategy appears to be quite successful at this point, as they were among the only companies of the US airline industry to achieve a positive profit at the beginning of 2005 (JetBlue, Southwest and America West). The most visible characteristic of the low-cost carriers compared to the legacy carriers is their simplified fare structure, with very few restrictions or advance purchase requirements. This means that they do not segment demand as much as their competitors. From the consumer point of view, there is a lower number of
products offered by the low-cost carriers, but their prices change as we approach the departure date, whereas in the case of a legacy carrier, the consumer has to choose between different fare products (with distinct restrictions and advance purchase requirements for each fare product).
In the markets where the legacy carriers compete with low-cost carriers, the former have no other choice than matching their competitors to avoid losing too much revenue. They dramatically change their fare products, which means compression of fare ratios and total or partial removal of restrictions and advance purchase requirements. In these new kinds of environments, where the fundamental assumption of traditional Revenue Management - independence of demand by fare class - is violated since there is no longer the possibility to segment the demand, the traditional Revenue Management methods do not perform as well as they used to in restricted environements. As we will see, without any restrictions or advance purchase requirements, the traditional Revenue Management algorithms lead to a "spiral down" effect, and revenues drop very fast. Given the quick expansion of the low-cost carriers, there is today a pressing need for developing new algorithms which can provide an optimal seat inventory control even in these cases.
1.3. Recently Developed New Approaches
From this point forward, we will focus on the cases where the fences - restrictions and advance purchase requirements - have been removed in a series of markets for a given network carrier. We will deal with unrestricted fare product structures, without restrictions or advance purchase requirements.
1.3.1. Forecasting and Sell-up
Forecasting is based on historical data: it is the estimation by fare class and by flight of the unconstrained demand, obtained from the record of the booking process of previous "equivalent" flights - previous Fridays for instance if we try to forecast demand for a future Friday. Forecasts should be as accurate as possible, since it is a crucial step in the process of Revenue Management. In the unrestricted fare product structure, since every passenger is going to buy the lowest fare available (given that there is no distinction between products anymore), it becomes impossible to estimate, based on historical data, a demand for each fare class using traditional methods. When nothing allows us to distinguish between different fare classes, customers indeed purchase the lowest available fare and demand for highest classes does not materialize. And if it is not observed in the historical database, no demand can be forecast for highest fare classes in the future.
The new methods we will present later will deal, in terms of forecasting, with the probability of sell-up, which is the probability that a passenger is willing to buy a higher fare ticket for the same flight in case he (or she) is denied booking for the requested fare product. Accounting for this probability in the forecast and in the optimization process will allow more seats to be protected for higher yield passengers and force them to sell-up when they will be denied booking for their first request. The challenge is to know how to use these sell-up probabilities accurately, and even more difficult, how to estimate them dynamically during the forecast process (they depend on the flight and cannot be optimal if set arbitrarily) in order to include them in the Revenue Management Systems (RMS).
1.3.2. New Methods: "Q-Forecasting" and "Fare Adjustment"
In order to address the problems mentioned above, several developments have occurred in the field of revenue management algorithms for less restricted fare structures, by Belobaba/Hopperstad' on one hand, and by Fiig/Isler2 on the
other hand. Both of these new approaches, respectively called "Q-Forecasting" (QF) and "Fare Adjustment" (FA) methods, have been implemented and tested in the Passenger Origin-Destination Simulator (PODS). Each of them makes use of the probability that a passenger is willing to buy-up at the time of booking, but each deals with a different aspect of the problem. The first addresses the problem of forecasting a less segmented demand in order to feed a traditional optimizer. The second deals with adjusting the fares to incorporate the potential of sell-up into the seat inventory control optimizer.
1.4. Goal of the Thesis
Today, the vast majority of airline companies use leg-based forecasts and optimizers. Nevertheless, there is a slow but inevitable shift towards OD control methods which are proven to increase significantly revenues although expensive to implement. Moreover, many legacy airlines struggle with low-cost carriers in more and more markets. They need to introduce some new features into their Revenue Management Systems in order to account for the presence of low-cost carriers and compete with these airlines in a given set of markets, while keeping traditional fare structures and methods in other parts of their OD sets. Previous studies - Cooper and Homen-de-Mello 3 - have shown the impact of the "do nothing" strategy in
these markets, and have explained the negative impact of traditional forecasting and optimization when the "old" assumptions are violated.
Therefore, in this thesis, we will present and explain the new alternatives, the way they are linked with the remainder of the Revenue Management (RM) process and the seat inventory optimization, mainly in the context of OD control methods. It is the goal of the thesis to present the revenue benefits obtained from the use of both methods, initially with inputs set arbitrarily. The next step presented here, is a way to estimate the required inputs during the forecasting process, in order to make the alternative methods autonomous and dynamically adaptive, which is a required feature given the level of automation reached in the Revenue Management System (RMS) to which they will be added.
All performance evaluations will be done using the Passenger Origin-Destination Simulator (PODS) developed by Hopperstad at the Boeing Company. The simulator will be described in detail in Chapter 3.
BELOBABA and HOPPERSTAD, Q investigations - Algorithms for Unrestricted Fare Classes, PODS presentation, Amsterdam, 2004
1.5. Structure of the Thesis
The thesis consists of 3 main parts: The Literature Review, The Approach to the Problem, and The Analysis of the Simulations.
In Chapter 2, the literature review will present more extensively the history of Revenue Management starting from the 1978 US deregulation, going through the increasingly sophisticated algorithms, and the revenue benefits each major improvement achieved with respect to previously used methods. Then, we will introduce some more detailed analysis done on the change in the airline industry due to the emergence of the low-cost carriers in the United States, but also in other parts of the world. We will discuss the "hybrid" legs in which different fare product structures co-exist, and the "spiral down" effect to which the traditional RMSs lead in unrestricted environments, explaining the need for alternative methods dealing with these new kinds of markets.
Chapter 3 is divided into sections related to the Passenger Origin-Destination Simulator (PODS) on one hand and sections related to the new RM methods on the other hand. The description of PODS is more an overview than a detailed presentation, given that the simulator has been extensively described in previous theses. We will present the fundamental processes, their interactions, the different Revenue Management methods we will refer to during the thesis and the specifics of PODS with respect to the topic of this thesis, such as sell-up inputs and features. Then come the theoretical parts, with at first a more detailed presentation of the sell-up concept and the mechanisms it involves. Both new alternative methods are described after that, given that they are both based on sell-up considerations. Q-Forecasting will come first, and then we will present the Fare Adjustment methods and their links with Q-forecasting. We will describe the methods assuming the required inputs are known and manually set, and we will explain the estimation processes used to dynamically compute the required inputs in the case of the Q-Forecasting method.
In Chapter 4, the simulation results, we will analyze the performance of both methods independently, at first without any estimation, and then using the estimator. Finally, we will combine both Fare Adjustment and Q-Forecasting methods. The point is to quantify the revenue benefits, but more interestingly to focus on the mechanisms involved, analyzing the loads - network wide, or in specified markets, looking at local and connecting passengers - fare mix, booking curves, sell-up curves and adjusted fares.
Finally, the conclusion - Chapter 5 - will summarize the benefits obtained from both methods in unrestricted environments and suggest directions for future work.
2.
LITERATURE REVIEW
This chapter first reviews the work done to this point in Revenue Management, in traditional environments, and then presents the new kinds of environments involving less differentiated fare product structures. The conditions corresponding to this new kind of environments are due to the rapid expansion of low-cost carriers in America, Asia and Europe competing with legacy carriers in a larger and larger number of markets.
2.1. Review of Revenue Management's Traditional
Assumptions and Algorithms
Revenue Management methods deal with the problem of maximizing revenues by optimizing the number of seats made available for each booking class (so-called "Seat Inventory Control", SIC). This means limiting the availability for low-fare, early bookings and simultaneously protecting enough seats for later-booking, higher fare passengers.
The first Revenue Management systems appeared in the early 1980's, and kept improving since that time, adding more and more sophisticated features to the seat inventory control and optimization. They are based on strong assumptions which remained reasonably true until recent years.
3 main techniques have been successively added to the Revenue Management Systems (RMSs): Overbooking, Fare Class Mix and OD Control.
There are two underlying assumptions on which are based the "traditional" RMSs. The first one is the independence of demand (mean and standard deviation) by fare
class for a given flight. This means that the forecast predicts the demand for each fare class independently from other fare classes, based on observations of bookings on previous flights in the same fare class. It implies that the customer is supposed not to consider choosing between different fare classes. The second assumption is that fare structure is determined independently from this process by the pricing
department of the airline (not described in this thesis).
Barnhart, Belobaba and Odoni4, as well as McGill and Van Ryzin5 provide very good summaries and descriptions of the evolution of RMS in the airline industry. As said before, the first RMS appeared in the early 1980's, focusing on the overbooking problem in order to increase revenue. Then, the 2nd generation provided threshold
methods to control the inventory. Later, the 3rd generation added the ability to
forecast and optimize by booking classes for each future flight leg departure. These 3rd generation RMSs are implemented today in the vast majority of the airline companies across the world.
4 BARNHART, BELOBABA, ODONI, Operation Research in the Air Transportation Industry, Transportation Science, Vol 37, No 4, Nov 2003
2.1.1. Overbooking Models
Overbooking models were aimed to reduce the revenue loss due to no-shows (used to represent 15 to 25% of total bookings at date of departure, down to 10%
nowadays). They involve booking more seats than actually available on the aircraft, accounting for the probability of no-shows. Overbooking is a tradeoff (in terms of risks and costs) between denied boarding (airline image) and potential revenue loss from unsold or spoiled seats. These overbooking models include those developed by Simon6, Vikred7 and Rothstein,9
.
2.1.2. Fare
Class
Mix Models
Some significant progress was then achieved regarding the forecasting part of Revenue Management by Littlewood'", L'Heureux", and then further explored by Lee 2. The demand forecasts are then fed into a seat allocation optimizer to
determine the Booking Limits to be applied to each booking class, using serial nesting described in Chapter 3. The idea is not to allocate seats to partitioned classes, but instead to protect seats for higher classes (all available seats in the entire inventory are available to highest fare class during the entire booking process). The nested seat allocation problem has been solved by Littlewood'" for two classes, and then extended to n classes by Belobaba" 4. It is based on the
notion of Expected Marginal Seat Revenue (known as the EMSRb's method, which can be defined as "the average fare of the booking class under consideration multiplied by the probability that demand will materialize for this incremental seat"), and uses heuristic decision rules for nested booking classes. It has become the most commonly used SIC model among airlines' RMSs. The use of fare class mix models allowed an increase in revenue by 2 to 4%14 with respect to judgmental methods. Optimal formulations for the multiple nested class problem have been published by Curry16, Brumelle and McGill'7, and Wollmeri.
6 SIMON, An Almost Practical Solution to Airline Overbooking, J. Transp. Econ. Policy 2, 1968
7 VIKRED, Airline Overbooking: Some Further Solutions, 3. Transp. Econ. Policy 6, 1972
" ROTHENSTEIN, An Airline Overbooking Model, Transportation Science 5, 1971
9 ROTHENSTEIN, Airline Overbooking: Fresh Approaches Needed, Transportation Science 9, 1975 10 LITTLEWOOD, Forecasting and Control of Passenger Bookings, AGIFORS, Israel, 1972
" L'HEUREUX, A New Twist in Forecasting Short-Term Passenger Pickup, AGIFORS,
Bowness-On-Windermere, 1986
" LEE, Airline Reservations Forecasting: Probabilistic and Statistical Models for the Booking Process, PhD
Thesis, MIT, Cambridge, MA, 1990
13 BELOBABA, Air Travel Demand and Airline Seat Inventory Management, PhD Thesis, MIT, Cambridge,
MA, 1987
"4 BELOBABA, Application of a Probabilistic Decision Model To Airline Seat Inventory Control, Operations Research 37, 1989
15 BELOBABA, 1992
16 CURRY, Optimal Airline Seat Allocation with Fare Classes Nested by Origin and Destinations, Transportation Science 24, 1990
17 BRUMELLE and McGILL, Airline Seat Allocation with Multiple Nested Fare Classes, Operations Research 41,1993
18 WOLLMER, An Airline Seat Management Model for a Single Leg Route When Lower Fare Classes Book
2.1.3. OD Control Models
The next step in the development of RMS was to account for network effects and manage the seat inventory by the revenue of the passenger's OD itinerary (instead of according to the fare class request on a flight leg), which became more feasible with the improvements in computer science as the problem became more and more complex. It was very important for airlines which operate large hub and spoke networks. The first OD-Control RMSs used virtual nesting to map itinerary+fare type to a (hidden) virtual class, in order to consider the network value of an ODF instead of just its fare class. They were developed by Belobaba13, Smith and Penn'9,
Williamson20 and Vinod21
,2 2. These RMSs gave preference to longer-haul, connecting passengers with higher fares, but did not address the need in certain cases for giving preference to two local passengers whose fares, when added, are higher than the connecting fare. DAVN (Displacement Adjusted Virtual Nesting) addressed this problem based on the Network Revenue Value, defined as the total itinerary fare minus the revenue displacement that might occur on connecting flight legs if the passenger's request for a multiple-leg itinerary is accepted (other than the legs under consideration). There exist a lot of variations on these methods, especially regarding the clustering process.
A simpler model was developed as well, called "Bid-Price Control" by Smith and Penn", Simpson2 3 and Williamson .In this method, the OD Fare is compared to
a bid-price. The bid-price is an approximate displacement cost equal to the sum of dual prices associated with each crossed leg in the itinerary. The dual prices come from a deterministic LP and are used as marginal values for an incremental seat on different legs. If the bid-price is greater than the OD Fare, the request will be denied, if it is lower, the request will be accepted. These methods will be described more extensively later in the thesis.
The benefits they provide have been evaluated using the Passenger Origin-destination Simulator PODS2
s, by Belobaba and Wilson26
, and quantified as an increase in revenue by 4 to 6% relative to conventional leg-based fare class control. The successive improvements in airline RMS have indeed allowed increasing revenue, accounting for overbooking, fare class mix, and finally network effects. These advances remained nevertheless based on strong assumptions, such as the independence of demand by fare class, which tend to be violated frequently. This translates generally into the inability to recover from revenue loss when competing with a low-cost airline in a set of markets, as explained in the next sections.
'9 SMITH and PENN, Analysis of Alternative Origin-Destination Control Strategies, AGIFORS, New Seabury, MA, 1988
20 WILLIAMSON, Comparison of Optimization techniques for Origin-Destination Seat Inventory Control, Master's Thesis, MIT, Cambridge, MA, 1988
21 vINOD, A set Partitioning Algorithm for Virtual Nesting Indexing Using Dynamic Programming, Internal Technical Report, SABRE Decision Technologies, 1989
22 VINOD, Origin and Destination Yield Management, in The Handbook of Airline Economics, D. Jenkins (ed.), The Aviation weekly Group of the McGraw-Hill companies, New York, New York, 1995
23 SIMPSON, Using Network Flow Techniques to Find Shadow Prices for Market and Seat Inventory Control, Memorandum M89-1, MIT, Cambridge, MA, 1989
24 WILLIAMSON, Airline Network Seat Inventory Control: Methodologies and Revenue Impacts, PhD Thesis, MIT, Cambridge, MA, 1992
25 Boeing PODS, developed by Hopperstad, Berge and Filipowski, 1997
2.2. The Low-Cost Carrier Model
Although the low-cost carriers have existed for decades (Southwest Airlines was founded in 1971), it is only since the beginning of the new century that this kind of airline companies has significantly developed in the US, and also in Europe (Easy Jet, Ryanair), Asia (Air Asia, Tiger) and Oceania (Virgin Blue, Jet Star). Low-cost carriers carry now more than 25% of the domestic passengers in the US.
The effects of the LCC emergence have dramatically changed the airline industry landscape in the world. The main characteristic of these airlines - apart from their very low costs, is their simple fare/restriction product structure, that the legacy carriers are forced to match to avoid losing their market share. But this causes significant drops in revenues due to the fact that the legacy carriers have higher operating costs and their RMSs are based on the restrictions and advance purchase requirements features. As we will discuss later, the legacy carriers face a spiral down effect in their revenues in the attacked markets when restrictions are removed. Weber and Thie127 have presented an analysis of the "Methodological Issues in
Low-Cost Carriers Revenue Management", from which I summarize the main points of the comparison between LCC and legacy carriers:
Low-Cost Carriers /Single
product: no segmentation
/1way fares only
'/No connecting traffic
'/No refund of cancelled tickets
'/Single product offered at different fares
./Booking
(bkg) control via fares offered
/Only
1 fare available at a time
,/Demand
supposedly price-sensitive
'/Time series based forecast does not
reflect price elasticity
/
RM mainly manual or semi-automatic
Legacy Carriers '/Multiple product; segmented ,/Mainly return fares
'/Mainly network traffic
'/Refundable ticket depending on fare
/Fare differentiation according to
product differentiation
'/Bkg control via booking class available '/Several fare products available at a
time
'/Demand supposedly product-sensitive '/Time series based forecast dominates
Revenue Management
/ RM control by fully automatic systems
Of course, all low-cost carriers do not fit exactly in the first column, and there is a very large range of models between the two extremes described above.
But from this, we can point out the number of non-negligible differences between both models. Nevertheless, there are also some points which apply to both low-cost and legacy carriers:
/ The average fare increases as we approach the departure date
/ The low amount of revenue obtained from the lowest fare classes
27 WEBER and THIEL, Methodological Issues in Low-Cost Carriers Revenue Management, Presentation to AGIFORS, Auckland, New Zealand, Jan 2004
Dunleavy and Westerman 28 provide also a good analysis of the low-cost carrier
model compared with the legacy carrier model. They point out the complexity problem the legacy carriers' RM departments have to face regarding the finer and finer segmentation of demand (caused by pricing strategies); whereas in the case of low-cost carriers, a simple single product is offered at a unique price which changes depending only on how close the day-of-departure is to the day-of-booking. Using their advantages - lower costs since they started operations, and avoidance of competition with other LCCs - the low-cost carrier model provides sustainable profitability to these airlines - at least in a short term.
The point is that both models have to co-exist on the same legs, and inevitably, each of them has to incorporate a significant part of the competitor's model in its own model. The low-cost carriers may need some less simple RMS, as well as legacy carriers need to extend their RMS by adding some features allowing them to address the presence of LCCs in some of their markets. We will, in this thesis, focus on the second part.
Along with the emergence of low-cost carriers, a new segregation of demand has arisen. Boyd and Kallesen29 provide an analysis of the differences between
priceable and yieldable demand, also respectively called price-oriented and product-oriented demand. Yieldable demand refers to customers who buy a ticket with respect to the product it represents (with restrictions and advance purchase requirements) and corresponds to the traditional assumptions of Revenue Management. Priceable demand corresponds to customers who buy the lowest available fare, irrespective of restrictions and advance purchase requirements, and it generally refers to markets in which a low-cost carrier entered. In most cases, both types of demand coexist in the same leg, but they cannot be addressed the same way, providing new challenges in modeling, forecasting and optimization for Revenue Management Systems.
2.3. Traditional Revenue Management in Less Restricted
Environments: the "Spiral Down" Effect
The legacy carriers have responded to the entrance of LCCs in some of their legs with major changes in their sets of fare products (in the specified legs). They tend to partially or fully match the LCC in terms of fares products:
/ Lower fares
/ Removal of certain restrictions (Saturday night stay, non-refundability and/or
change fees)
/ Reduced advance purchase requirements
These changes might be quite complex; they might be applied to all fare classes in a market, or only to a reduced number of classes and they might be applied to connecting and local fares or only to local fares.
28 DUNLEAVY and WESTERMAN, Future of Airline Revenue Management, Journal of Revenue and Pricing
Management, Vol 3, No 4, Jan 2005
In these new kinds of hybrid networks, the fundamental assumptions of traditional RMS are in jeopardy:
/ The independence of demand by fare class is no longer valid. Customers are
offered undifferentiated products, so they buy the lowest available fare. Thus demand for highest classes do not materialize, and it becomes impossible to establish forecasts for highest fare classes based on historical data.
/ The customer segmentation rules are violated as well. The differences
between "leisure" and "business" passengers are eroding, business passengers becoming more sensitive to price for instance.
In these conditions, it happens that the traditional RMSs perform quite poorly, as far as they are by definition based on the fare product structure (restrictions + advance purchase requirements). The combination of the violation of the assumptions and the poor performance of traditional RMSs leads to the "buy-down" and "spiral-down" effects - presented below - which translate into severe revenue losses.
Both phenomena have been described based on analysis done with the Passenger Origin-Destination Simulator PODS by Cusano3 0, but also by Ozdaryal and Saranathan".
The buy-down Phenomenon consists of a series of simultaneous processes which, combined, lead to a decrease in the average fare paid per passenger:
/ The removal (total or partial) of the restrictions and advance purchase
requirements leads to the violation of the customer segmentation principles
/ The assumption of demand independence between fare classes is invalidated
/ The excess in capacity caused even more losses when lower class demand
started to materialize close to departure date (violation of the customers' behaviors assumptions)
The Spiral-down Phenomenon is the direct consequence of the buy-down phenomenon. As said, the removal of fare product differentiation led to a decrease in yield. Legacy airlines tried without success to replace these fare rules by new inventory strategies, and were stuck into a cycle leading to lower and lower revenues as shown on Figure 131.
30 CUSANO, Airline Revenue Management Under Alternative Fare Structures, Master's Thesis, MIT,
Cambridge, MA, 2003
31 OZDARYAL and SARANATHAN, Revenue Management in Broken Fare Fence Environment, Presentation
Figure 1: Spiral-Down Effect
When a traditional RMS deals with an unrestricted environment, the excess of capacity (caused for instance by the Sept. 11, 2001 events) leads high-fare passengers to buy-down. This consequently encourages lower forecasts for high-fare demand (given that high-fare demand did not materialize), reducing the protection for high-fare passengers. Finally, this change in booking limits leads to an increase in the number of seats available for lower classes. The cycle then spirals down.
The customer, who is given the choice between buying a ticket to the legacy carrier or to the low-cost carrier, will for sure choose the LCC if the legacy carrier does not match with its competitor. So the legacy carrier has to match, and then, as described earlier, the spiral down effect feeds itself when the airline removes the fences between fare classes. This results in lower revenues for the "attacked" airline.
Cooper and Homen-de-Mello 3 have modeled mathematically the spiral down effect
occurring when using traditional forecasting methods. The purpose of their paper is to study the (more general) effect of a violation of the fundamental assumptions taken for granted in the traditional revenue management algorithms. They define, for the model they have built, precisely under what conditions and how the spiral down effect occurs.
Since 2001, the revenue management world has focused on the spiral-down problem to try to come up with alternatives, but at this point, no one has found the optimal solution in helping the legacy carriers with recovering significantly from revenue loss due to competition with LCC in a set of markets. This thesis will present two complementary alternatives to traditional revenue management methods designed to address the problems raised above.
3.
APPROACH
3.1. PODS Overview
This thesis makes use of PODS, the Passenger Origin-Destination Simulator25,
developed at Boeing by Hopperstad. It simulates realistically the environment of competing airline companies. PODS evolved from the Decision Window Model32 by incorporating major simulation capabilities in addition to schedules, airline image and aircraft types, such as the Revenue Management systems, the fares offered on each flight and path, the restrictions associated with each fare, and the possibility for the passenger to choose between several competing airlines.
PODS simulates for a single day's departures the booking process on a network of flights for one or more airlines which can use different Revenue Management methods. The simulator produces various output files which allow the researcher to analyze the impact of the different revenue management and forecasting methods and/or different fare structures in various environments.
Since PODS has been described several times by Zickus, Gorin and Carrier", the description of the simulator in this thesis will be an overview and the reader should refer to these materials for more detailed descriptions.
3.1.1. The Simulator
PODS will be used to simulate several airlines operating a network of flights in a competitive environment in order to measure the performance of different revenue management methods. The simulator is composed of 4 major elements linked as shown on Figure 2.
32 Decision Window Path Preference Model (DWM), The Boeing Company, Feb 1994
33 ZICKUS, Forecasting for Airline Network revenue Management; Revenue and Competitive Impacts, May 1998
GORIN, Airline Revenue Management: sell-up and Forecasting Algorithms, June 2000
CARRIER, Modeling Airline Passenger Choice: Passenger Preference for Schedule in the Passenger Origin-Destination Simulator (PODS), May 2003
Path/Class Availability
Revenue Management Seat Inventory Control
Path/Class/Bookings/Cancellations
PODS
Passenger
Origin-Destination
Simulator
Figure 2: PODS Flow Chart Source: Hopperstad2
S
The simulation flow begins at the bottom of Figure 2. The booking data from previous flights is collected into the historical database, which, with the current booking status (from the Revenue Management optimizer), is used by the forecaster to estimate the future demand for a given flight. These expected bookings are then fed into the Revenue Management optimizer, which computes the seat protections and availability based on current path and class bookings as well as cancellations. Finally, the availability data is fed into the passenger choice model, which generates future passengers' characteristics and assigns them to available path-fare combinations according to their decision window, budget and preferences. Then all the information is input back into the model again to provide historical data to the Revenue Management optimizer for the next optimizations and future flight departures
In the next paragraphs, only the relevant parameters, with respect to the subject of this thesis, will be described. For a more complete description of the PODS Model, its inputs, fares, restrictions, outputs, various networks, the reader should refer to the works of Zickus, Gorin and Carrier33 which contain complementary and extensive explanations of the different aspects of the simulator. The following is just a brief summary.
PODS is a simulator of the behavior of the passengers, the way they choose between paths, airline companies, and fare products given what the airline companies decided to make available in terms of these fare products. There are therefore two distinguishable components in PODS as shown in Figure 3.
PODS
How Passengers choose How Airlines set their
flights and fares availabilities of paths and
Based on the Passenger fare classes
Choice Model Based on historical data and forecasts Figure 3: The Two Main Components of PODS
One particular run of PODS is comprised of 5 independent trials, each of them being the repetition (600 times generally) of a single departure day (for instance Mondays) called a sample, over and over without cycles or seasonality. The first 200 samples of each trial are burnt to avoid transient effects. In a given trial, the samples are not independent, since they are used for historical purposes. Finally, the results provided are averaged over the 5 trials.
3.1.2. The Network Parameters
At the network level, the inputs include:
/ The number of Airlines
/ The number of Origin-Destination Markets
/ The number of flights per day
/ The departure time and capacity of each flight
/ The number of fare classes and associated fares, advance purchase
requirements and restrictions (like non-refundability, change fee, Saturday night stay)
3.1.3. The Passengers
At the passenger level, the inputs include:
/ The demand by day, OD and Passenger Type (Business, Leisure) are given in
terms of means and standard deviations that vary day after day
/ The arrival curves by passenger types, which typically look like those of
Figure 4. It translates the fact that leisure passengers book early while the
majority of business passengers book during the last days before departure date.
Arrivals, 100% 0%/
Leisur
Business
Booking Period starts Departure dayFigure 4: Arrival Curves by Passenger Type
The Passenger Choice Model.
This model is based on and has evolved from the Boeing Decision Window Model32 (DWM), itself using as input the maximum willingness-to-pay (WTP) curves given by passenger types as shown in Figure 5.
WTP
Q
M (Base Fare) ---- BusinessLeisure
: ... Leisu re$ B Y Fare $For instance, in this 4-fare-classes environment, we notice that only 50% of the leisure passengers are willing to pay for the M fare whereas still 100% of the business passengers are willing to pay for it.
Figure 5: Willingness-To-Pay Curves by Passenger Type
To account for the cost they represent for a given passenger type, the OD fares are also adjusted with the disutility costs associated with the different restrictions Ri:
Total Generalized Cost = OD Fare + IRi(Evaluated Cost of Ri) These features are used and organized in the process shown in Figure 6.
100%
50%
Demand & Arrival Curves
Generate Passenger at time frame TFi (important for Advance Purchase and Availabilities)
Generate WTP for this passenger Generate a Time Window
for this passenger
II || 100% 0180% .2 60% _40% 20% 0% $50 $100 Price $150 $200
Generate Disutility costs for this passenger
Generate the Choice Set for the given OD/Date/pax type based on
previous characteristics 11 il
Delete from Choice Set all
alternatives whose fare > WTP
)
$0 $100 $200 $300
Itineraries Fare class Itinerary 1 Itinerary 2 Itinerary 3 Y B M
Q
Delete from Choice Set allalternatives whose AP req. > TFj
Delete from Choice Set all alternatives not available due to
RM Controls Il ||
Compute the generalized cost among remaining alternatives and
select the alternative with lowest generalized cost
Figure 6: Passenger Choice Model - Process Overview
100% 80%