Analysis and Synthesis of Fricative Consonants
by
Lorin F. Wilde
Submitted to the Department of Electrical Engineering and
Computer Science
in partial fulfillment of the requirements for the degree of
Doctor of Philosophy
at the
MASSACHUSETTS INSTITUTE OF TECHNOLOGY
February 1995
©
Massachusetts Institute of Technology 1995. All rights reserved.
Author
...
Department of Electrical Engineering and Computer Science
February 11, 1995:Th
Certified by....
Kenneth N. Stevens
Clarence J. Lebel Professor of Electrical Engineering
Thesis Supervisor
I½A
Accepted by
irmnan, Departmental Com:
Frederic R. Morgenthaler
mittee on Graduate Students
Lng.
MASSACHISETTS INSTITJTE
OF TFrLpinh! vtv
Cha
Analysis and Synthesis of Fricative Consonants
by
Lorin F. Wilde
Submitted to the Department of Electrical Engineering and Computer Science on February 12, 1995, in partial fulfillment of the
requirements for the degree of Doctor of Philosophy
Abstract
This thesis studies and interprets the -entory of acoustic events associated with the changing vocal-tract configurations .:at characterize fricatives preceding vowels. Theoretical considerations of the articulatory, aerodynamic and acoustic aspects of the production of fricatives provide the foundation for interpreting the acoustic data. Fricative characteristics are considered with respect to the adjacent vowel. All eight English fricatives in six vowel contexts were studied using a controlled database of consonant-vowel sequences recorded by four speakers. There are two separate acoustic analysis components: 1) analysis of formant patterns and 2) analysis of time-varying noise characteristics. In addition, listening tests with utterances containing synthetic fricative consonants are used to determine which acoustic aspects are perceptually important. The acoustic data are applied to modify the theory, where appropriate, and to set the time-varying control parameters in a speech synthesizer.
Detailed acoustic analysis begins by first identifying events or landmarks in the speech signal, such as at consonant-vowel (CV) and vowel-consonant (VC) boundaries. Once landmarks are located, signal processing and analysis can be focused in their vicinity, where change is occurring and information is concentrated. The strategy is to extract appropriate acoustic information in the vicinity of these landmarks, and also in the intervals when the vocal tract is most and least constricted. This thesis takes a kinematic view of the acoustics of fricative consonants, rather than making the more common, stationary assumptions.
In the study of formant onset patterns we focus on the transitions of the second and third formants. Formant transitions at the release from a fricative into a vowel allow the positions of the major articulators to be inferred. It is shown that variability in the acoustic signal at the release of a fricative decreases when production of the fricative places greater constraints on the position of the tongue body.
In the series of studies on the time-varying noise characteristics of fricatives, we further quantify the acoustic attributes of turbulence noise generated in fricatives
the maximum amplitude above 2 kHz in the fricative, normalized relative to vowel amplitude, is 15-20 dB more for /s/ and // than for /f/ and //.
In addition, we use speech-copying techniques to investigate the effects of varying the consonant-vowel ratio and mimicking observed time variations over the duration of the fricative. The objective is to determine the acoustic characteristics that have perceptual importance for speech understanding systems. A significant difference in the production constraints between nonstrident and strident fricatives was compatible with perceptual results using synthetic stimuli. For example, listeners were more tolerant of the manipulations in the consonant-vowel ratio for /f/ than /s/. We failed to demonstrate that listeners are sensitive to time variations in fricative noise when judging naturalness. However, we have shown that listeners reject stimuli with energy at unexpected times and frequencies.
Finally, we conclude by relating what we learned about the acoustics of fricative consonants to the models of the relative timing of the changing vocal-tract config-urations. For example, the spectral differences between strident and nonstrident fricatives suggested that source-filter models, i.e., models of the filtering of the noise source by the cavity in front of the constriction, might be improved if the losses in the vocal tract and location of the noise source were better represented.
Thesis Supervisor: Kenneth N. Stevens
Acknowledgments
It is with great pleasure that I end the writing of this thesis by recognizing the support I've received from the beginning of this endeavor.
Deep gratitude goes to my thesis advisor, Ken Stevens, who supported my con-tinuing education and told me from the outset that graduate school should be fun. It is a privilege and pleasure to be among the diverse set of researchers who have been supervised by Ken. He generously shares his extraordinary insights and enthusiasm, while encouraging independence of ideas.
The contribution of each of my readers cannot be underestimated. Victor Zue provided clarity and perspective, and I always benefitted from his thoughtful advice and questions. Charlotte Reed was always available for discussing how to formulate ideas. And I was fortunate to have Cam Searle as a trustworthy presence on all my committees; he always kept me honest.
Thanks go to my Oral Qualifying Exam committee, Al Grodzinsky, Tom Knight and Cam, who listened to the earliest design of my first speech analysis and synthesis system, and then recommended that I get back in the lab and build it. Thanks also go to my Area Exam committee, Ken, Cam and Larry Frishkopf, who participated in my opportunity to explore auditory modelling.
Bill Peake was inspirational, and an integral part of the learning process. For-mative discussions were ongoing with Jim Glass, Li Deng, Mark Randolph, Yi Xu, and Alice Turk, among other colleagues. Melanie Matthies certainly made statistics comprehensible and enjoyable. Software tool development and collaboration with Mark Johnson, Dan Ellis, Ellen Eide, Nabil Bitar, Hugh Secker-Walker, Noel Massey, Giulia Arman-Nassi and Reiner Wilhems-Tricarico made data analysis possible.
I appreciated the feedback from additional reviewers, including Corine Bickley, Caroline Huang, Marilyn Chen, Sharlene Liu and Suzanne Boyce, and additional listeners, including Stefanie Shattuck-Hufnagel, Joe Perkell, Sharon Manuel and Kelly Poort. Help with formatting came from Jeff Kuo, Karen Chenausky, and from Jane Wozniak for the "figure that wouldn't die". Help above and beyond administrative support came from Arlene Wint, Janice Balzer and Deborah Manning.
I'm grateful for all my friends at and away from MIT. Special recognition goes to my dear comrades Ellen Eide, Dan Ellis, Mark Johnson, Marilyn Chen and Hwa-Ping Chang, who were always there to help, even at the oddest hours. Amy Kronenberg and Sandy Fruean provided their support from a distance, which kept them close.
This task would have been impossible without the unfailing love and support of my parents Edith and Irwin Wilde. Bob and Bobbi Kross and Bubby also brought love and balance to our lives.
Heartfelt thanks go to my husband, Mark Kross, for his humor, music and impro-visional talent at turning my figures into reality. Our mutual support makes our lives together a never-ending gift. And loving thanks go to our daughter Joelle, our finest
Contents
1 Introduction
1.1 Summary of the Problem ... 1.2 Thesis M otivation ...
1.3 Thesis Overview. ...
2 Background: Production Modelling 2.1 Articulation and Aerodynamics. 2.2 Acoustics ...
2.2.1 Estimating sources from aerodynamics 2.2.2 Source spectra. ...
2.2.3 Vocal tract filtering of sources ...
3 Formant Patterns
3.1 Speech Corpus, Recording Procedure and Equipment 3.2 Measurement of Formant Onset Frequencies ... 3.3 Results.
3.3.1 Effects of Vowel Context.
3.3.2 Effects of Place of Articulation ... 3.3.3 Effects of Fricative-Vowel Interaction.
3.4 Inferring Articulatory Movements from Formant Patterns
3.4.1 Effects of Vowel Context.
3.4.2 Effects of Place of Articulation ...
4 Time-varying Noise Characteristics
13 15 18 19 20 21 . . . 30 . . . .. . . 30 . . . 32
... . f32
41 . . . .... . . . 42 ... . . . 43 . . . .... . . . 45 ... . . . 45 . . . .... . . . 47 ... . . . 52 . . . .... . . . 54 . . . .... . . . 54 . . . .... . . . 54 574.1 Statement of the Problem: Difficulty in Frication Analysis 4.2 Literature Review .
4.3 Methodology ... 4.4 Results ...
4.4.1 Gross Spectral Characterist 4.4.2 Quantifying Time-varying I
4.4.3 Quantifying Stridency . 4.5 Summary and Interpretation of Re
5 Applying Acoustic Findings to SI Evaluation 5.1 Introduction.
.
...
61
. ...
64
... . 172
ics ... 72 4oise ... 83 . .. .. .. .. . . . .. . . . .89 sults ... 92peech Synthesis and Perceptual 96
.... . 96
5.2 Baseline Perceptual Testing Using Natural Utterances . 5.3 Synthesis Methods .
5.3.1 General Strategy for Formant Synthesis .
5.3.2 Capturing Time-Variations in Noise Using Copy Synthesis
5.4 Perceptual Tests .
5.4.1 Stimulus Preparation . 5.4.2 Stimuli Presentation .
5.5 Results from Perceptual Evaluation of Synthetic Stimuli . 5.6 Comparing Perceptual Results to Acoustic Findings .
5.6.1 Summary of Main Findings .
6 Conclusions
6.1 Summary and Interpretation of Results . 6.2 Implications .
6.3 Future Work .
A Formant Frequencies for Two Female Speakers
97 98 99 . 101 . 104 . 105 . 106 . 108 . 111 . 113 116 . 116 . 117 . 118 127 57
C Synthesis Parameter (.doc) Files C.1 Synthetic /fe/ . . . C.1.1 Time-varying C.1.2 Steady Noise C.2 Synthetic /afa/ . C.2.1 Time-varying C.2.2 Steady Noise
C.3 Synthetic /s/
.. .
C.3.1 Time-varying C.3.2 Steady Noise C.4 Synthetic /sa/ . . . C.4.1 Time-varying C.4.2 Steady Noise . . . .. 137 Joise . ... ... 137 . . . .140 . . . .142 qoise ... . 142 . . . .145 . . . .148 loise .... ... 148 . . . 151 . . . .153 loise ... . 153 . . . .156 137List of Figures
1.1 Spectrograms of the utterances /isi/ and /izi/ ... 16
2.1 Midsagittal cross-sections of vocal tracts for /f/, /0/, /s/ and //. .. 21 2.2 Midsagittal cross-section and uniform tube model of vocal tract for /s/ 24 2.3 Low-frequency equivalent circuit of vocal-tract model ... 26 2.4 Airflows and pressures with associated trajectories of glottal and
supra-glottal constrictions ... 29 2.5 Schematized trajectories of glottal and supraglottal constrictions and
calculated source amplitudes ... 33 2.6 Measured spectra of sound pressure source for two different flow velocities 34 2.7 Models of the vocal-tract with pressure source for an alveolar fricative 36 2.8 Calculated frication noise, vowel and aspiration spectra ... 40
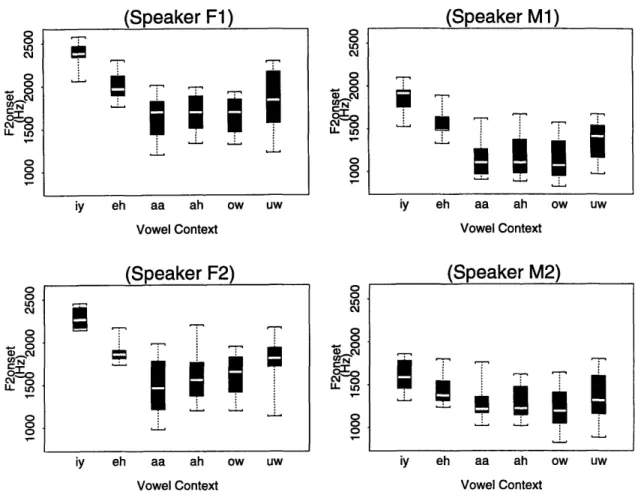
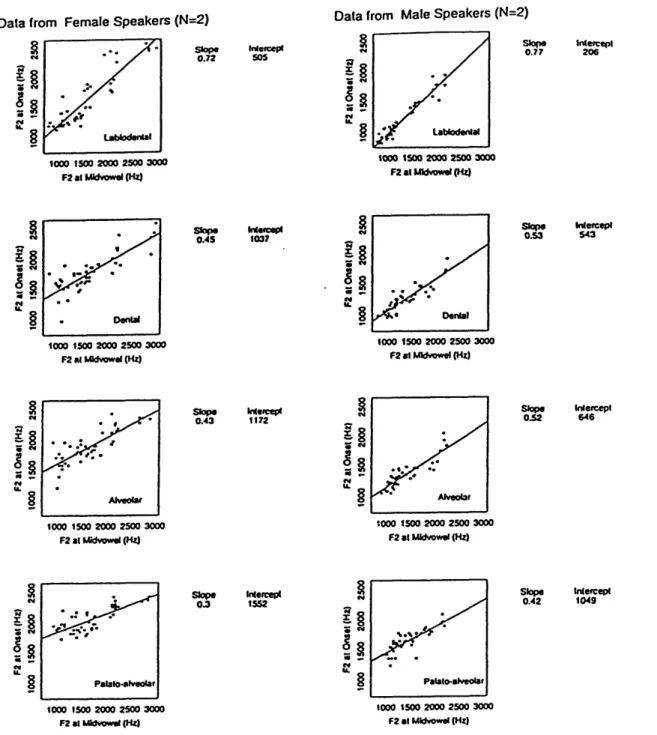
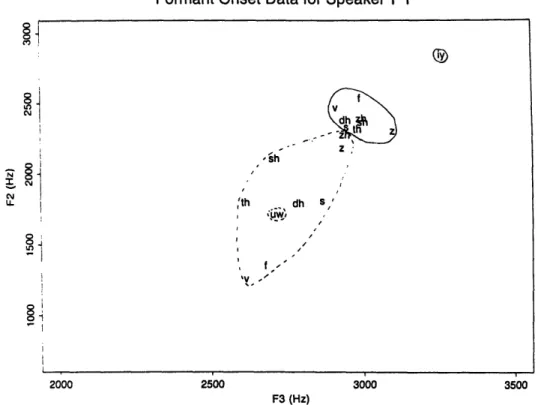
3.1 Examples of spectrogram and spectra for /i/ spoken by a male speaker 44 3.2 Medians and interquartile ranges: vowel context effect on F2onset . . 47 3.3 Locus equations plotted for male and female speakers ... 49 3.4 Medians and interquartile ranges: place of articulation effect on F2onset 51 3.5 Onset values of F2xF3 for one female speaker (F1) ... 52 3.6 Mean F2onset values plotted as a function of vowel context for each
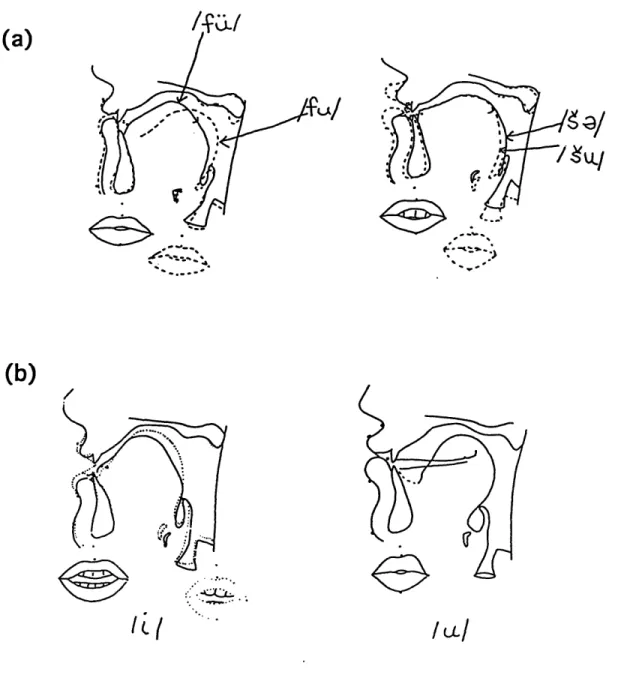
fricatve place of articulation ... 53 3.7 X-ray tracings of vocal tracts during French phrases ... 55
4.3 A time-averaged spectrogram ... . 65 4.4 Averaged spectra of fricative /s/ and following vowel /i/ spoken by one
male speaker (Ml). ... 67 4.5 Time-averaged spectra of the four voiceless fricatives preceding //,
produced by Speaker M. ... 68 4.6 Overview of the system developed for quantifying the time-varying
noise spectra of fricative consonants. ... 70 4.7 Amplitude variations for the five frequency bands aligned with the
spectrogram of the utterance /afc/. ... 71 4.8 Results of band-by-band amplitude normalization of voiceless and voiced
fricatives produced by Speaker M1 ... 74 4.9 Results of band-by-band amplitude normalization of voiceless and voiced
fricatives produced by Speaker F1 ... . 75 4.10 Schematized spectra of voiceless fricatives produced by Speaker M1,
averaged separately for front, back and back-rounded vowel contexts . 78
4.11 Schematized spectra of voiced fricatives produced by Speaker M1,
av-eraged separately for front, back and back-rounded vowel contexts . . 79 4.12 Schematized spectra of voiceless fricatives produced by Speaker F1,
averaged separately for front, back and back-rounded vowel contexts . 80 4.13 Schematized spectra of voiced fricatives produced by Speaker Fl,
av-eraged separately for front, back and back-rounded vowel contexts . . 81 4.14 Amplitude variations for five frequency bands of intervocalic /f/ and
/s/ produced by Speaker M1 ... .... 84 4.15 Medians and interquartile ranges: magnitude of amplitude variations
in Band 3 ... 868...
4.16 Medians and interquartile ranges: magnitude of amplitude variations
in Band 4 ... ... 87
4.17 Medians and interquartile ranges: magnitude of amplitude variations
4.18 Means and standard deviations of normalized amplitudes for voiceless
fricatives ... 90
5.1 Time-varying parameters for synthesizing the utterance /afE/ ... 102 5.2 Spectrograms of synthetic /afe/ for time-varying and steady synthesis
methods ... 103
5.3 Listener preferences for Listening Test 1 ... 109
List of Tables
1.1 The following words and symbols illustrate the sounds of English
frica-tives ... 14
2.1 MRI results for area ranges of supraglottal constrictions ... 23
3.1 F2 ranges: effect of vowel context ... . 46
3.2 Locus equation slopes for fricatives and stops ... 48
3.3 F2 range: effect of place of articulation ... 50
4.1 Means and standard deviations of normalized amplitudes for nonstri-dent and strinonstri-dent voiceless fricatives ... 91
5.1 Stimulus conditions for Listening Test 2 ... 106
5.2 Listener preferences for Listening Test 2 . . . ... 110
5.3 Amplitude differences of natural target utterances of Speaker M1 used for synthesis . . . ... . 112
5.4 Amplitude differences of synthetic fricatives modelled on natural speech of Speaker M1 ... 113
A.1 Formant Frequencies: Speaker F1 (Token 1) ... 128
A.2 Formant Frequencies: Speaker Fl (Token 3) ... 129
A.3 Formant Frequencies: Speaker F2 (Token 1) ... 130
A.4 Formant Frequencies: Speaker F2 (Token 3) ... 131
B.1 Formant Frequencies: Speaker M1 (Token 1) ... 133
B.3 Formant Frequencies: Speaker M2 (Token 1) ... 135
Chapter
1
Introduction
Audible speech is a combination of buzzes, hisses, and clicks. All sounds generated in the vocal tract involve the modulation of air flow. Better models still need to
be developed for the relative timing and contribution of the sources of vocal sound: voicing, the quasi-periodic buzz generated by the vibration of the vocal folds, and the noise sources that involve random fluctuations in airflow at a constriction in the vocal tract. This thesis will focus on the relative contribution and timing of the vocal sources involved in fricative sound production, and the filtering of those sources by the vocal tract.
Fricative consonants are distinguished from other speech sounds by their manner of production. Fricatives are produced by forming a narrow constriction in some region along the length of the vocal tract. Air blown through this constriction becomes turbulent in flow, typically near an obstacle in the airstream or at the walls of the vocal tract. The acoustic result of this turbulence is the generation of noise. This noise is then filtered by the vocal tract, with the acoustic cavity in front of the constriction contributing the greatest influence on the filtering.
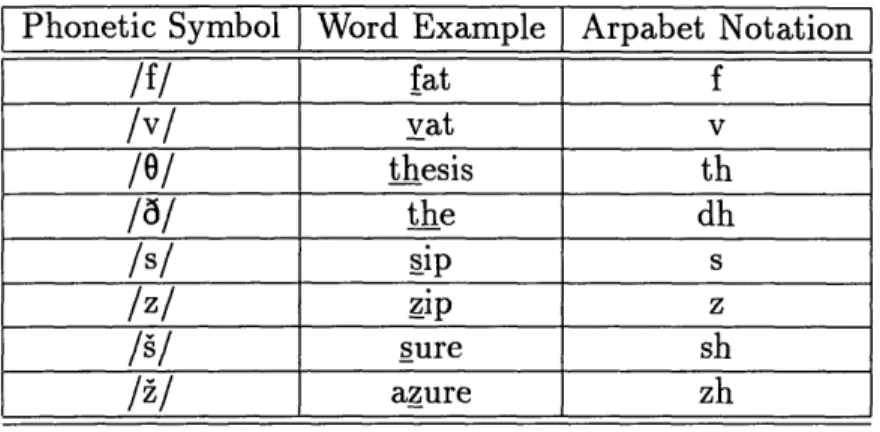
The eight fricatives in English, shown in Table 1.1, are distinguished by the loca-tion of the consonantal constricloca-tion: labiodentals /f, v/, dentals /0, d/, alveolars /s, z/, and palatals /, /. The first of each pair is voiceless and the second is the voiced cognate, in which the voicing source is superimposed on the noise. One approach for characterizing these sounds is to describe them by a set of distinctive features. These
features specify the articulators, such as the tongue, lips and larynx, that are used in producing the sounds, and describe how these articulators are adjusted in forming constrictions in the vocal tract (Jakobson, Fant and Halle, 1965; Chomsky and Halle, 1968; Halle and Stevens, 1991; Stevens and Keyser, 1992).
Table 1.1: The following words and symbols illustrate the sounds of English fricatives.
/f/ fat f /v/ vat v /0/ thesis th /6/ the dh
/s/
sip
s
/z/ ip z // sure sh A/./ azure zhThis thesis takes a kinematic view of the acoustics of fricative consonants, rather than making the more common, stationary assumptions. During spoken communica-tion, the vocal tract alternately opens and closes. The major features that subdivide speech sounds into classes focus on the articulatory and acoustic events that occur at different phases of this opening and closing. Vowels are produced when the vocal tract is least constricted and the vocal folds are positioned so that spontaneous voic-ing occurs. The followvoic-ing acoustic events are associated with fricatives produced in an intervocalic context:
* An interval of frication noise with a spectrum that is shaped by the location of the constriction.
* Formant transitions into adjacent vowels that provide additional place of artic-ulation information.
One convenient way to visualize these acoustic events is to use a spectrographic display. In Figure 1.1 spectrograms of the utterances /isi/ and /izi/ display differences that exist between acoustic realizations of a voiced and voiceless fricative.
The objective of this thesis is to study and interpret the inventory of acoustic events associated with the movement between a fricative and a vowel, and evalu-ate their perceptual importance. Detailed acoustic analysis begins by first identify-ing events or landmarks in the speech signal, such as at consonant-vowel (CV) and vowel-consonant (VC) boundaries. The strategy is to extract appropriate acoustic !information in the vicinity of the landmarks. Despite a rich history of research (e.g., Hughes and Halle, 1956; Strevens, 1960; and Heinz and Stevens, 1961), the unique characterization of each fricative according to its physical quantities remains elusive.
1.1 Summary of the Problem
Shadle (1989) postulates three reasons for current limitations in our characterization of the acoustic mechanism of fricatives: 1) the theory of sound generation due to turbulence is incomplete; 2) the primary sound generation process, unlike vowels, does not include a mechanical vibration that is clearly correlated with the speech signal; and 3) an intrinsically noisy speech signal must be described statistically, rather than analytically. These limitations, which exist even for static vocal-tract configurations, become even more interesting when considered in terms of the kinematics of moving between a consonant and a vowel.
Vowels are characterized by the predomination of low frequencies and periodic voicing. Fricatives are characterized by high frequency aperiodic excitation. What glues together such acoustically different sounds? Formant transitions, which reflect the changing vocal-tract resonances, help capture the movement of the vocal tract from one configuration to another. For fricatives, not only does the shape of formant trajectory depend on place of articulation, but there is a place-dependent interaction with the vowel context. For example, Wilde and Huang (1991) demonstrated that labiodentals, which normally have the lowest formant onset frequencies, show a higher
LSPECTO: 256-pt DFT, smart AGC [LEX.VCV]
6.4-ms Hamming window every 1 ms
IYS IY_KS 8L .· E, 7 6 5 4 3 _ 2 : _" 2 0 100 200 300 400 500 600 TIME (ms) 0 100 200 300 400 500 600 TIME (ms)
LSPECTO: 256-pt DFT, smart AGC
[LEX.VCV]
700 800 900 1000
700 800 900 1000
6.4-ms Hamming window every 1 ms IYZIY_KS
-1-_ X,, d'i f;gQ '
t(- i-~~%~lBlkk ~ · i ldeSf~fld
t
r.'
;,..gI=_______# ____________________
___-Zr~~bi
.
_____--_________________________ 0 100 200 300 400 500 TIME (ms) 0 100 200 300 400 500 TIME (ms) 600 700 800 900 1000 600 700 800 900 1000 Z 80 a 40 : 0 I 7 6 5 4 3 2 N LU EU C-0 I 80 _ 40 0o I V I E t- . ... A=1 = ·- " ;- 0= ·,.---
===
)i= · · · · · _ -,- . I - - - - -. ! -. ' = = I tsecond formant onset than dentals when followed by a high, front vowel. Formant transition information has been shown to be important for discriminating among fricatives when strong spectral cues are absent (Harris, 1958).
Fricatives seem to naturally cluster into two basic groups. Sibilant sounds, such as alveolars and palato-alveolars, have more acoustic energy at higher frequencies than do labiodentals and dentals. Sibilant refers to an acoustic property, "the amount of hissing noise in a sound" and is a primary way to distinguish between alveolar fricatives and dentals (Ladefoged, 1993, p. 43). Strident sounds, such as the alveolar and palatal fricatives, are also "marked acoustically by greater noisiness than their nonstrident counterparts" (Chomsky and Halle, 1968, p. 329). The feature stridency appears to be quite robust for automatic speech recognition (Deng and Sun, unpub-lished data). That is, under quiet conditions, there are relatively few errors that evidence confusion between segments labeled as strident and nonstrident. However, to date, the range of normal variation of stridency has not been systematically quan-tified and there is no accepted threshold that automatically separates sounds along the stridency dimension. While the alveolar and palatal fricatives are unequivocably classified as strident, there has been considerable debate about whether the labioden-tal fricatives (f, v) should be considered strident or be classified as nonstrident along
vith the dental fricatives (0, 6) (McCasland, 1979).
Part of the problem of quantifying the normal variation of stridency is to clarify the definition, as that will determine which acoustic measures are appropriate. Stridency hlas been used to refer to both acoustic and articulatory properties. It has been suggested that the strident quality is achieved by directing a concentrated jet of air against an obstacle. Catford (1977) distinguished between a "channel turbulence" which results from flow through an articulatory channel, and a "wake turbulence" that is generated downstream from an obstacle and contributes high frequencies to the noise spectrum. Shadle (1989) also distinguished two source mechanisms for fricative sound generation: 1) an obstacle source, where sound is primarily generated at a rigid body approximately perpendicular to the airflow, and 2) a wall source, where sound is primarily generated along a rigid wall, which is parallel to the flow.
For /s, z/ and /, z/, the teeth are considered to be the obstacles. The upper lip may form an obstacle for /f, v/.
Models of the articulation of fricatives provide one way to study their acoustic mechanism. If we could model these sounds better, we could also improve the per-formance of speech synthesizers. Fricative consonants have been difficult to optimize in articulatory synthesis and analysis (Sondhi and Schroeter, 1992). The need for further study is also apparent in rule-based speech synthesis where fricatives continue to present intelligibility, as well as naturalness, problems. The results for natural and synthetic fricatives in a study comparing high-quality text-to-speech synthesis with natural speech (Wilde and Huang, 1991) confirmed the need to model better the source changes at fricative-vowel boundaries. The intelligiblity of synthetic labio-dental and labio-dental fricatives was found to be poorer than natural, even when formant transitions appeared to be reproduced accurately. The stronger, more distinctive noise spectra of alveolar and palatal fricatives /s, z, s, / allows them to be synthesized more intelligibly. However, these synthetic fricatives often still sound unnatural.
1.2 Thesis Motivation
It is the speech signal that provides the acoustic link between the production and perception systems. The acoustic signal for fricative consonants has been shown to be rich in cues that distinguish these sounds. One objective of this thesis is to contribute to the quantification of acoustic cues available for the recognition of fricative consonants. These cues will be interpreted in terms of the constraints of the human production and perception systems. The motivation for this work is to evaluate the acoustic characteristics of fricative consonants in the context of the
:1.3 Thesis Overview
The following is a roadmap to the remainder of this thesis. Theoretical considerations of the articulatory, aerodynamic and acoustic aspects of the production of fricatives in intervocalic position (Chapter 2) form the basis for predicting the acoustic patterns expected from the relative timing of the glottal and supraglottal constrictions. The modelling in Chapter 2 provides a foundation for interpreting the acoustic data on fricatives and for specifying strategies for synthesizing these sounds. There are two separate acoustic analysis components (Chapters 3 and 4). Chapter 3 presents a study of formant onset patterns and will serve to provide tables of values for setting relevant
parameters in a formant synthesizer. In Chapter 3, we focus on the transitions of the
second and third formants. That is, we are mainly looking at what is occurring behind the constriction, since it is the back cavity shape that primarily determines the second and third formant frequencies for the fricatives of English. Chapter 4 presents a study of the time-varying noise characteristics of fricatives. A system, using averaging methods, is developed to further quantify the acoustic attributes of fricatives with respect to adjacent vowels. We examine how fricative spectra change with time and we quantify the feature [strident]. Results of Chapter 4 are applied to modify the theory, where appropriate, and to set the time-varying control parameters in a speech synthesizer. In view of the different domains covered in the two acoustic chapters, further description of the relevant literature is presented separately in Chapters 3 and 4. Next, listening tests with utterances containing synthetic fricative consonants are used to determine which acoustic aspects are perceptually important (Chapter 5). In Chapter 5, we use speech-copying techniques to investigate the effects of varying the consonant-vowel ratio and mimicking observed time variations over the duration of the fricative. Finally, we conclude (Chapter 6) by relating what we learned about the acoustics of fricative consonants to the models of speech production and perception.
Chapter 2
Background: Production
Modelling
During speech production, humans perform rapid vocal gymnastics. Speech produc-tion models are attempts to capture the aerodynamic and acoustic consequences of the naturally occurring movements of our articulators. The models are approximate representations which attempt to explain observed behavior in a systematic way. In modelling the production of fricative consonants, our goal is to understand how hu-mans generate these noisy sounds and how computers can simulate the acoustics of natural fricatives. This chapter will present an acoustic theory of fricative production.
One standard way to determine the expected acoustics for a speech sound is in terms of sound sources and filter functions. In the source-filter description of the acoustic theory of speech production (Fant, 1960), the speech wave is the response of a vocal-tract filter to one or more excitation sources. The acoustic theory of speech production represents the vocal tract as an acoustic tube with varying cross-sectional area. An acoustic source can form the excitation of this tube either at the glottal end or at points along its length, and the shape of the tube determines how the source is to be filtered.
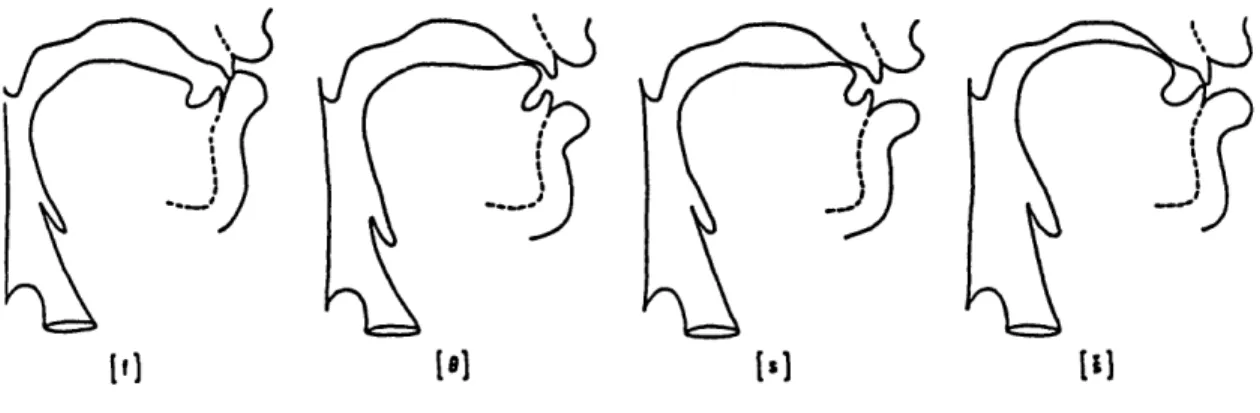
I f] [ e][
Figure 2.1: Midsagittal cross-sections of a vocal tract configured to distinguish be-tween English fricatives according to the location of the consonantal constriction: labiodental /f/, dental /0/, alveolar /s/ and palato-alveolar //. Voiced fricatives /v, 6, z, 2/ would be expected to have similar configurations to those of the voiceless cog-nates. (These schematics were traced by Dennis Klatt from film described in Perkell
(1969).)
then review the aerodynamic conditions that arise when constrictions are made along the vocal tract. Finally, we examine existing models of the acoustic effects governed by the articulatory and aerodynamic processes of speech production.
2.1 Articulation and Aerodynamics
Fricative consonants are formed by making a narrow constriction in the vocal tract at a point above the larynx. The major articulator that forms this narrowing is usually the lips, the tongue blade or the tongue body. Midsagittal views of the vocal tract during the constricted portion are shown in Figure 2.1, and contrast the four places of articulation that distinguish fricatives in English.
At the boundary region between a fricative and vowel, the three most important
articulatory adjustments are the narrowing or widening of the vocal tract for the consonantal constriction, abduction or adduction of the vocal folds for voicing, and changes in the enclosed volume of the vocal tract (Scully et al., 1992).
Data on vocal-tract shape and dimensions are necessary for more complete under-standing of the articulatory processes of speech production. However, direct evidence, especially needed three-dimensional data, is notably lacking. Baer et al.(1991) pro-vide a review of speech production models and measurements that have been made to test existing theory in their paper on the use of magnetic resonance imaging (MRI) to study vocal tract shape and dimensions during vowel production. Much hope has been expressed for MRI to improve our models of speech production.
However, a major drawback of current MRI techniques is the time required to perform the image processing, i.e., tens of seconds to minutes, which restricts study to sustained speech sounds. Additional limitations involve the resolution difficulties, e.g., identifying the teeth, as calcified structures may be indistinguishable from the airway. Trade-offs between temporal and spatial resolution are inherent in the con-temporary choice of non-invasive techniques. At present, therefore, MRI can not be used to directly examine the kinematics involved in moving from one sound to another. Fortunately, the continuant nature of fricatives makes study of sustained production possible.
A recent MRI study of fricative consonants (Narayanan et al., 1994) sustained by four speakers has provided measurements of vocal tract lengths and area functions,
as well as descriptions of tongue shape. Greater inter-speaker differences were noted for nonstrident, as compared to strident, fricatives. Voiced fricatives were observed to have larger pharyngeal volumes, as compared to unvoiced, due to the advancing of the tongue root. Observed ranges of supraglottal minimum cross-sectional areas for the voiceless fricatives are shown in Table 2.1. These cross-sectional areas can be used to make estimates of airflows and pressures during fricative consonant production.
Table 2.1: Area ranges of supraglottal constriction for sustained fricatives produced by four speakers in MRI study by Narayanan et al. (1994).
Fricative Cross-sectional Area (cm2)
/f/ 0.25 - 0.40
/0/ 0.15 - 0.35
/s/ 0.10- 0.30
A// 0.10- 0.30
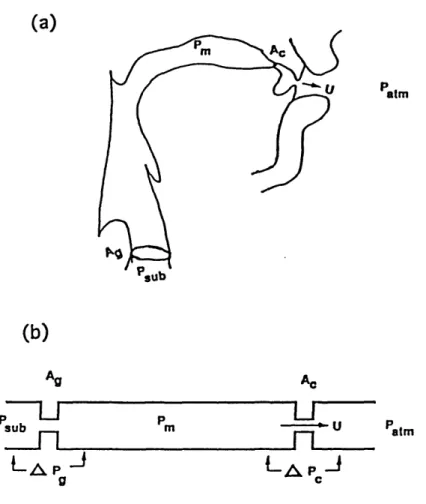
/s/ the tongue tip is right behind the upper teeth, forming a constriction at the alveolar ridge. Figure 2.2(b) depicts the schematized vocal tract, according to the simplifying assumptions of a concatenated tube model with two constrictions: one at the glottis and one at the constriction formed by the supraglottal articulators. The parameters identified allow calculation of the pressure drop across the glottis
A.Pg from the subglottal pressure Psub minus the intraoral pressure in the mouth,
-P = AP, assuming zero atmospheric pressure (Patm),
Psub = APc + APg (2.1)
The pressure drop AP (in dynes/cm2 or cm H20) across a constriction, or resis-tance to airflow, can be determined from the Orifice Equation (Stevens, 1971):
kpU2
AP = 2A2 + viscosity term (2.2)
where
p is the density of air (.00114 g/cm3)
U is the volume velocity in cm3/sec
A is the area of the constriction in cm2
k is a constant that depends on cross-sectional shape of the constriction and on the degree of discontinuity at the inlet and outlet of the constriction.
IWhen the cross-sectional area A is greater than 0.05 cm2 the effects of viscosity can be shown to be less than 10 % of the overall resistance to flow, and therefore can be neglected as a first approximation. When viscosity effects are negligible, as is charac-teristic for the subglottal pressures being considered (6-8 cm H20), Equation 2.2 can
(a) paim Su (b) Ag
P U
subLAp
j
g Pm ACTU
LAPJ
C PalmFigure 2.2: (a) Midsagittal cross-section of a vocal tract as configured for /s/. (b) This vocal tract idealized as a uniform tube with constrictions at the glottis and in the oral region.
b)e interpreted as a dynamic pressure drop across a nonlinear resistance.
When a fricative consonant is produced in intervocalic context, the cross-sectional area of the constriction Ac during the consonant is significantly smaller than the min-imum cross-sectional area of the vocal tract in the adjacent vowels. While there is no easily obtainable method for physically measuring these areas directly in con-nected speech, the values of Ac and Ag can be inferred from the airflow data (Klatt
et al., 1968; Scully et al., 1992). For fricatives in natural speech, the vocal tract is
rarely completely constricted, and complete closure may be viewed as inadvertent overshoot. The range of the area of narrowest vocal-tract constriction for consonants is approximately 0-0.4 cm2. The range for fricatives, as estimated from the MRI data
shown in Table 2.1, may span 0.1-0.4 cm2. However, estimates fronm airflow studies are generally smaller and suggest that a range of 0.05-0.3 cm2 for the minimum con-striction areas during fricatives production may be more typical. For example, data from Scully et al (1992) for /s/ are in the range of 0.05-0.2 cm2. The average glottal opening Ag may range from about 0.1-0.4 cm2 during voiceless fricative production, and may be somewhat smaller during voiced fricative production (Stevens, 1971). The average area of the glottis, usually about 0.03-0.05 cm2 for modal voicing during vowel. production, is generally determined from airflow and also fiberoptic studies.
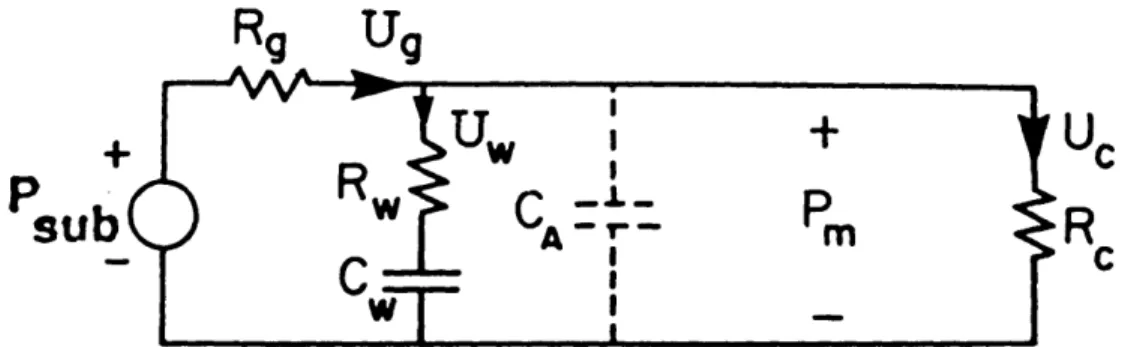
It is useful to represent the concatenated-tube model of Figure 2.2 in its circuit analog, as depicted in Figure 2.3, where pressure is analogous to voltage, and volume velocity is analogous to current. This circuit was discussed by Stevens (1993) for modelling affricates, and is similar to circuits proposed earlier by Rothenberg (1968) and others for modelling the breath stream dynamics of simple stop consonants. ]It represents an aerodynamic model of the average pressures and flows in the vocal tract, given a subglottal pressure Psub. The resistances due to glottal and superglottal constrictions are Rg and Ro, respectively, and the behavior of the vocal-tract walls at
low frequencies is modelled as a resistance Rw in series with an acoustic compliance
(C. As a first approximation, C and R, which play a role in the modelling of rapidly released stop-like consonants, can be neglected when the rates of change of the parameters are slow enough. For example, when a complete closure is made in
Ps+
sub
uc
R
C
Figure 2.3: Low-frequency equivalent circuit of vocal-tract model, for estimating airflows and pressures. The component CA shown by dashed lines is neglected in
calculations of airflow. See text. (From Stevens, 1993, p. 36)
the vocal tract as is the case during production of the stop consonant /p/, there is no airflow out of the mouth; therefore, the value of Rc is infinite and Uc is zero. During the interval of complete closure for a stop consonant, when Uc is zero, the airflow U expands the walls of the vocal tract. In contrast, for a fricative such as /f/, the supraglottal constriction is not complete, and the flow U, through the constriction and out of the mouth is significantly greater than the flow U, which expands the vocal-tract walls.
A quasi-static solution can be obtained when the rates of change of the time-varying resistances, Rg and R,, are sufficiently slow that U., < U, and the capacitor C, can be considered an open circuit. For this quasi-static solution of the circuit, the flow out of the mouth Uc equals the flow through the glottis Ug. The values of the resistances Rg and RC have been empirically determined to be proportional to the inverse of the square of the area of the corresponding constriction. The form of the equation for these kinetic resistances
Rkinetic - 2A2 (2.3)
is related to Equation 2.2. Further, when the viscosity term is negligible and k is assumed to be the same for both constrictions, then there is the following voltage
constrictions:
R,
A2UAP,
-= R + Rg R, ~ - b 1(A)2 Psub (2.4)A + AY
Assuming a constant subglottal pressure, we can compute the build-up of pressure in the mouth Pm = AP,, according to the relative sizes of the time-varying adjustments of the glottal and supraglottal constrictions.
It; is generally observed that the intraoral pressure Pm is higher in the voiceless case, often approaching the subglottal pressure (Klatt et al., 1968). Production of voiced fricatives requires a delicate balance between maintaining enough intraoral pressure to generate frication and maintaining enough pressure drop across the glottis to sustain vocal fold vibration. Devoicing occurs when the pressure drop across the glottis becomes less than a critical amount of approximately 2-3 cm H20 (Titze, 1992). The data presented by Stevens et al. (1992) on devoicing of voiced fricatives are in general agreement with an earlier study by Haggard (1978).
The vocal-tract pressures and flows can be estimated from the low-frequency equivalent-circuit model of Figure 2.3. In this circuit, the resistances Rg and R, vary in time as the areas Ag and A, change. We used a numerical simulation of this equivalent circuit that was developed at Sensimetrics (Stevens et al., in prepara-tion), which incorporates vocal-tract dimensions and tissue properties. The solution is found in terms of the air flow through the vocal tract, the pressure drop (AP) across a kinetic resistance and the cross-sectional area of the constriction, as seen
from solving for U in Equation 2.2:
U = p A (2.5)
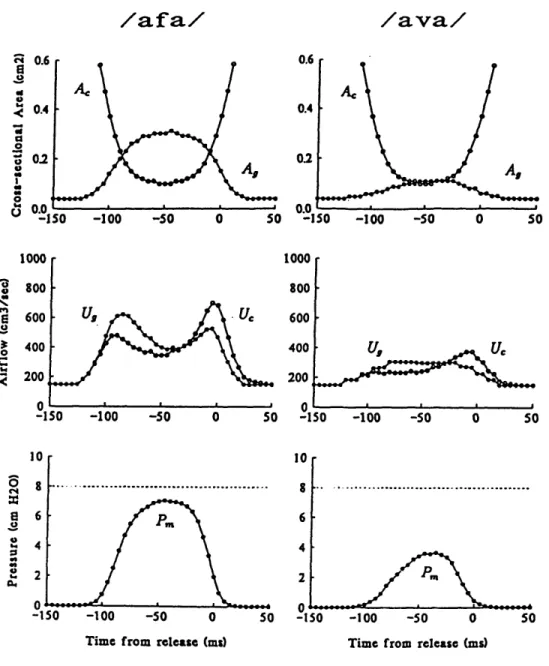
Schematized trajectories of the glottal and supraglottal constrictions as hypoth-e sizhypoth-ed for an inthypoth-ervocalic voichypoth-elhypoth-ess and voichypoth-ed labiodhypoth-ental fricativhypoth-e arhypoth-e shown in thhypoth-e top left and right panels of Figure 2.4 from Stevens et al. (in preparation). The sim-plifying assumption for these plots is that the trajectory for the supraglottal opening 1, is the same fr the voiced and voiceless cognates, while the glottal area Ag remains
wider for the voiceless fricative. The calculated flows and pressures that correspond to the time-varying area functions for intervocalic labiodental fricatives are given in the middle and bottom panels. The buildup of intraoral pressure Pm is shown to be greater for intervocalic voiceless fricatives (bottom left) as compared to voiced fricatives (bottom right).
The plots of airflow in Figure 2.4 illustrate the double peaks and large volume for intervocalic fricatives (Klatt, et al., 1968) relative to the adjacent vowels. The double peak in airflow is determined by the relative timing of the laryngeal and articulator movements. Consider the consequences of these relative movements for the calculated flows for the following example: /afa/. During the /a/, the glottis begins to open, even as the vocal folds continue to vibrate. The consequence of opening the glottal area is that airflow through the glottis Ag increases. Then when the upper teeth begin to come in contact with the lower lip, the following consequences occur: a constriction is formed resulting in a rise in the pressure in the mouth Pm causing an abrupt cessation of vocal-fold vibration. The supraglottal articulators continue to constrict during the /f/ until flow resistance reaches a local maximum and flow reaches a local minimum. Then the articulators begin to move apart in anticipation of the following /a/: flow resistance lowers and the airflow through the glottis increases. As a consequence of the reduction in intraoral air pressure and the action of adducting muscles, the vocal folds begin to approximate and vocal-fold vibration begins. These adducting glottal movements increase the total flow resistance, and the flow drops to the expected value for the vowel.
A similar flow pattern is expected for intervocalic voiced fricatives. However,
during voicing, there is increased laryngeal resistance with the result that airflow is reduced and the peaks are less pronounced for voiced fricatives than for their voice-less cognates. Still when pressure conditions allow vocal fold vibration to continue throughout a fricative, the flow remains higher for the voiced fricative than it would for a vowel. As U, was found to be relatively small in these outputs, we will ignore
/afa/
R 0.6 0 _. 0.4 Can 0.0°-Iso -100 -50 0 50 0.6 0.4 02 -1/ava/
50 -100 -50 50A SO -100 -50 0 50 U, U._··;
-50 o 50ofPm
-100 -50 0 50Time from release (ms) Time from release (ms)
Figure 2.4: Airflows and pressures are shown with associated trajectories of the glottal (solid circles) and supraglottal (open circles) constrictions, A, and A, as hypothe-sized for intervocalic voiceless (left) and voiced (right) labiodental fricatives. The difference between the flow through the glottis U, (solid circles) and flow through the supraglottal constriction U, (open circles) is the contribution of the wall flow U,. Intraoral pressure Pm (solid circles) and a fixed subglottal pressure (dashed line) are shown in the bottom panel (From Stevens et al., in preparation).
1000 a m .0 '4 .2
-t
800 200 UU 800 600 400 200 a 0 0 m4 m *1S 1 0 IU 8 6 4 2 V -150 S U.f\lr rum__^ ---. s nun I 600 400 -I 50 -100 -50 0 so Al I I :150 -100 I _ . A I eA rrr I _ _the relative timing, or mistiming, of the glottal and oral articulator movements during VCV production can result in area trajectories that are quite asymmetrical; these asymmetries would be reflected in the resulting pressures and flows. The effects of the area trajectories on the relative amplitudes of the sound sources will be discussed in the following section.
2.2 Acoustics
There are three primary sources of sound that may be varied to produce fricatives. Two are at or near the glottis: 1) the quasi-periodic vocal fold vibration for voicing and 2) the generation of aspiration noise; and one is at the consonantal constriction: 3) the generation of frication noise. In some cases, a transient source is observed at the release of the constriction.
2.2.1
Estimating sources from aerodynamics
The turbulent noise sources are generated by random fluctuations in the velocity of air flow, superimposed on an average flow. Shadle (1985, 1990) related results of experiments with mechanical models to improving descriptions of the noise source characteristics. Pastel (1987), motivated by Shadle's work, reviewed a transmission line model of the vocal tract and explained how the airstream for aspiration or frica-tion can be modelled as a turbulent jet. The Reynolds number, a dimensionless constant used in flow analysis, gives a measure of the turbulence of the airflow. A noise source generated by air impinging on an obstacle (i.e., zero velocity) can be modelled as a sound pressure source (called a dipole source). Obstacles often extend into the main jet stream, where velocity is higher and the source magnitude is propor-tional to the cross-secpropor-tional area interacting with the jet. In addition to the pressure source, there can be fluctuations in flow through the constriction resulting from ir-regularities further upstream. Turbulence noise used to signal a phonetic distinction
Estimates of the time-variations of the amplitudes of the voicing and noise sources can be made if the pressures across the constrictions are known. It has been shown that the amplitude of the source from vocal-fold vibration is proportional to (Pm - PsUb)l5
(Isshiki, 1964) and the amplitude of the frication noise source is proportional to
P A° 5 (Stevens, 1971; Shadle, 1985). This relation for frication noise has recently been confirmed for one subject in a study by Badin et al. (1994) using enhanced Elec-tropalatography to measure constriction size and shape during production of sustained fricatives and whispered vowels. The equation for amplitude of the aspiration noise is
assumed to have the same form as frication noise. However, as discussed above, the overall amplitude of the noise source may depend on the presence of obstacles in the airstream and the effect of obstacles may be different for the two kinds of turbulent noise sources.
Asymmetries in the noise amplitude of fricatives have been observed in our acous-tic analysis (and by Behrens and Blumstein, 1988 and Shadle et al., 1992). One :factor in observed asymmetries for intervocalic fricatives is the relative timing of the glottal and supraglottal trajectories, and consequently, how much aspiration noise is superimposed on the frication noise. Two hypothetical time courses relating the area of the glottal opening Ag and the area of the supraglottal constriction Ac are shown in the top panels of Figure 2.5 (Stevens, in preparation). Asymmetries in the breath-iness observed in the vowels at vowel-fricative and fricative-vowel boundaries have suggested that the schematized area trajectories shown in the top left panel of Fig-ure 2.5 can be modified to show a more abrupt increase in Ag at the vowel offset and more gradual decrease in Ag at the vowel onset, as shown in the right panel. These movements are slow enough to warrant consideration of the quasi-static solution to the circuit shown in Figure 2.3. The calculated amplitudes of the noise sources Ng and NC in the vicinity of the glottal and supraglottal constrictions, respectively, are shown in the bottom panels. The relative contributions of the noise source are shown to change as the relative movement of the articulators is varied. One characteristic result is that the frication noise source amplitude remains relatively constant during the consonantal interval and another is that another is that aspiration noise persists
for a longer time interval at the fricative-vowel boundary.
2.2.2
Source spectra
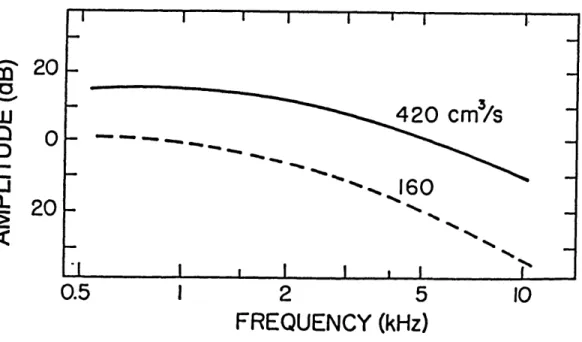
As discussed above, one way to examine the characteristics of a turbulent sound source is to model it mechanically. Stevens (1971) reviews studies of the sound source generation by turbulent flow at an obstruction, called a spoiler, in a pipe. The frequency distribution f from the fluctuation in the force is centered on a frequency that is proportional to flow velocity V divided by the cross-dimension d of the spoiler. Shadle (1985) used a mechanical model to derive source functions for turbulence, including far-field sound measurements produced when airflow through a constriction hits an obstacle. The measured spectrum of the sound-pressure source that results from turbulence at an obstacle tends to have a broad peak centered at a frequency that is proportional to V/d, and then falls off slowly above this frequency. The relative amplitudes of measured spectra associated with two different flow velocities are shown in Figure 2.6 for sound-pressure sources used to model the obstacle case. In these spectra the frequency of the broad peak is shown to increase as the rate of flow increases. During fricative production, typical ranges for rates of flow are 300-600 cm3/sec.
2.2.3 Vocal tract filtering of sources
The spectrum of the sound radiated from the lips during fricative production can be considered to be the product of three spectra: 1) the spectrum of the noise source, 2) the transfer function from the sound pressure source to the volume velocity at the lips, which is determined by the vocal tract shape, and 3) the radiation characteristic at the lips. Therefore, another way to study the noise source characteristics of fricatives is to start with natural speech and account for the filtering effects of the vocal tract. In this approach, inverse filtering, the noise source is modelled as a series pressure source
E 0 C1r 0 0 W T Cl) U,
0
cc 0 U)0
C.) 2 O ' O '--' uu I~EL00TIME RELATIVE To RELEASE (M
Figure 2.5: (Top) Schematized trajectories of the glottal and supraglottal
constric-tions
(A and A) as hypothesized for an intervocalic fricative, during which themovement of Ac in the right panel is advanced 50 ms with respect to the movement of Ag as shown in the left panel. (Bottom) The amplitudes of the noise sources N and Nc near the glottal and supraglottal constrictions, respectively, are calculated as-suming quasi-static conditions. The subglottal pressure is assumed to be 8 cm H20. The vertical marks in the curves A and N show estimated times of offset and onset of vibration of the vocal folds (From Stevens, in preparation).
C;_
I
sc 20
-L
o.
20
<
0.5
1
2
5
10
FREQUENCY (kHz)
Figure 2.6: Measured spectra of sound pressure source for two different flow velocities. From Stevens (in preparation).
The filtering function of the vocal tract can be considered in terms of its pole-zero decomposition. A pole frequency is a frequency for which a small excitation at the input produces an infinite response at the output. That is, the poles are the natural resonances of the entire system under consideration. A zero frequency is a frequency for which even a large input to the system produces zero output.
A series of models for the voiceless alveolar fricative /s/, as shown in Figure 2.7, will be used to introduce the effect of the vocal-tract filtering function. When the constriction Ac is very narrow compared to the cross-sectional area of the concate-nated tubes shown at the top left, it is assumed that the coupling between the cavity
behind the constriction and the cavity in front of the constriction is negligible. That is, the constriction can be replaced by a rigid wall, as shown on the top right. For this approximation, the only resonances that appear in the output spectrum are those due
Another description is that the zeroes of the back cavity cancel the corresponding system poles. In the following calculations, we will also assume that there is a single pressure source at a fixed location, rather than a spatially distributed source, and we will neglect losses. We can then specify the transfer function Tn of the system shown at the bottom of Figure 2.7:
Um U1 Um (2.6)
Tn- p ~ - , x U (2.6)
We can use the solution to the one-dimensional wave equation (e.g., as derived in Beranek (1954)) in order to solve the right-hand side of Equation 2.6. The first factor can be shown in terms of the impedances Z1 and Z2 seen to the right and the left of the pressure source:
U, 1 (2.7)
P,
Z1 + Z2 where pcZ1 = j Ptan kll ,
A PC and W 27rf c cThe second factor is given by
U 1 (2.8)
U1 cos k1
Equation 2.6 reduces to
A sin kl2
(a)
-1
I It; Um
A PsI
H
2 1 I (b) 0 Um Z2 Z1Figure 2.7: Models of the vocal-tract for an alveolar fricative, in which a pressure source P, is located at a fixed position in front of the constriction. (a) When A is sufficiently small, the constriction is modelled as a rigid wall. (b) The impedances Z and Z2 seen to the right and the left of the pressure source are shown.
where
=
11
+12.To find the pole frequencies, fp,,, the denominator of Tn is set to zero. Therefore, the poles of the system occur when
coskl = 0
which yields
c 3c 5c
41 41 4 ' (2.10)
T'o find the zero frequencies, f,,, the numerator of Tn is set to zero. Therefore, the ze roes of the system occur when
sin kl2 = 0
which yields
C C
= 02, ,.. (2.11)
122 ( .
In summary, the system shown in Figure 2.7 can be decomposed into a quarter-wave resonator representing the cavity in front of the constriction, which contributes the system poles, and a half-wave resonator representing the portion of the vocal tract
between the constriction and the pressure source, which contributes the zeroes. That is, the zeroes depend on the location of the source.
For example, we can calculate the poles and zeroes of the following configuration: a front cavity of length 2 cm with the pressure source located 1 cm in front of the constriction. The first pole of the system in front of the constriction is the first resonance of the quarter-wave resonator: 4425 Hz (c/41 where c, the speech of sound, is 35,400 cm/sec and length is 2 cm). The zeroes are contributed by the
half-wave resonator: the zero frequencies for the whole system are the same as the pole frequencies for the half-wave resonator in this simulation. There is a zero at 0 Hz, and one at 17,700 Hz (c/212, where 12= 1 cm).
In order to determine the contribution of the transfer function Tn of this vocal-tract configuration, we derive the magnitude of the transfer function at the formant frequency given by the above pole at 4425 Hz. The peak-to-valley ratio (in dB) of To
is given by
2S
(2.12)
7rB
where
S is the spacing between the formants in Hz B is the formant bandwidth in Hz.
The bandwidths at the frequency ranges we are considering for the frication noise are mostly due to radiation losses. Given a spacing of 8850 Hz (i.e, twice the lowest natural frequency) and bandwidths in the range of 500-1000 Hz, we get a peak-to-valley ratio due to the system poles of 15-21 dB. In addition, the combined effect of the first two system zeroes, as discussed above, is to bring down the spectrum about 3 dB at a frequency of 4425 Hz, and to further reduce the spectrum amplitude at
lower frequencies.
The calculated spectrum of the fricative output is shown as the curve labeled "FRIC." in Figure 2.8. The frication spectra is shown for an alveolar consonant, such as /s/. There is a high frequency peak in the frication spectrum which reflects the filtering of the pressure source by the short cavity in front of the constriction at the alveolar ridge, i.e. a tube with a first resonance of approximately 4500 Hz. As discussed above, there may also be a contribution from a volume velocity source, but this small, predominantly low-frequency effect is neglected in our model of production. The radiation resistance increases with frequency; i.e., there are increased losses as frequency increases. Therefore, the effect on the overall spectrum of speech is to widen
neutral vowel, in which formants are regularly spaced in frequency. Recall that the noise source for aspiration is at the glottis, i.e., at one end of the tube model of the vocal tract. Therefore, resonance peaks in the aspiration spectrum correspond to the formants in the adjacent vowel. However, because of the losses at the glottis which are maximum at low frequencies, the lower formants, especially the first formant is
considerably damped, and may not be visible in the aspiration output.
Our research will focus on the acoustic consequences of fricative production. Our approach to modelling fricatives will be to be to set the time-varying controls in a speech synthesizer. When we synthesize speech sounds with computers, we are mod-(e lling production. With an analysis-by-synthesis approach (e.g., Scully et al., 1992), model parameters are set to estimated values based on acoustic analysis of naturally-produced fricatives, and then are iteratively adjusted to improved the match. In rule-based synthesis, we seek a set of simple rules, i.e., a model, to gain better under-standing of how natural and intelligible fricatives are generated. We will consider the synthesis of intervocalic fricatives (Chapter 5) after a discussion on the acoustic anal-ysis of natural fricatives (Chapters 3 and 4). The modelling in this chapter provides a basis for interpreting the acoustic data on fricatives and for synthesizing fricatives.
m
8(
0
200 1 2 3 4 5
FREQUENCY (kHz)
Figure 2.8: Calculated frication noise spectrum (FRIC) from a pressure source as might be seen for an alveolar fricative consonant, such as /s/ compared to the spec-tra for a neuspec-tral vowel (VOWEL) and aspiration (ASP). Specspec-tra represent relative sound-pressure levels that might be measured at a distance in front of the mouth opening. Calculations are based on source models and assumptions about vocal-tract configurations for an adult male speaker. From Stevens (in preparation).
Chapter 3
Formant Patterns
The outcome of perceptual experiments on fricative consonants (Harris, 1958) showed that formant transition information is important for discriminating among fricatives when strong spectral cues are absent. Previous studies have focused on examining the acoustic correlates of place of articulation in formant transitions in natural speech (Kewley-Port, 1982) and synthetic speech signals (dating from classical Haskins stud-ies in the 1950's documenting the role of the second-formant transition in signaling stop place of articulation).
The early work describing the articulator position from acoustic properties avail-able at consonant-vowel (CV) syllavail-ables was in response to the locus theory advanced by Delattre et al. (1955), which proposes the presence of a place on the frequency scale to which a formant transition is moving. More recently, slope and y-intercept )parameters of locus equations have been suggested for classifying stop place categories (Sussman et al., 1991; Sussman et al., 1993). Fowler (1994) argues that it is coartic-ulation resistance, i.e., the degree of coarticulatory overlap between consonant and vowel, that is reflected by study of the relationship between formant onset frequencies at a CV boundary and the formant values in the steady portion of the vowel.
In this chapter, it is argued that formant transitions at the release from a fricative into a vowel allow inferring the positions of the major articulators. It is shown that variability in the acoustic signal at the release of a fricative decreases when production of the fricative places greater constraints on the position of the tongue body.
3.1 Speech Corpus, Recording Procedure and
Equip-ment
A database was collected in order to examine in detail the acoustic attributes of frica-tive consonants in the front, back and back-rounded vowel contexts. Three normal speakers of American English, one male and two female, recorded 'CVCV'CVC non-sense syllables. The consonant was one of the eight English fricatives: /f, v, 0, a, s, z,
s, / and the stressed vowels were /i, , ca, A, o, u/. The first and third vowels in an
utterance were the same. The second vowel was always the reduced vowel /a/. Two repetitions of each fricative in pre-stressed position were studied.
The speech was recorded in a sound-treated room using an Altec ominidirectional microphone (Model 684A), which was amplified by a Shure Microphone Preamplifier (Model M67) feeding a Nakamichi tape recorder (Model LX-5). The microphone was located approximately 25 cm in front of the speaker at approximately 5 cm above the speaker's mouth. This placement was chosen so that the airstream was not directed against the microphone diaphragm and also to avoid problems of picking up incorrect relative amplitudes of radiation from the lips and neck, if too close, or reflection of low frequencies from the walls of the room, if too far away.
The recordings were digitized at 16 kHz after being passed through an anti-aliasing filter which had a cut-off frequency of 7.5 kHz. This cut-off frequency was the highest
available at the Speech Communication Laboratory at the time of this study.
One additional male speaker, previously low-pass filtered at 4.8 kHz and digi-tized at 10 kHz by Klatt (unpublished manuscript), was also studied. The combined database of four speakers allowed examination of intra-speaker variability for frica-tives in intervocalic position and was adequate for setting synthesis parameters for stimuli used in the subsequent perceptual experiments.
3.2 Measurement of Formant Onset Frequencies
Formant frequencies were measured for the eight English fricatives preceding the six vowels. (In the later analysis, the data for the different tokens are grouped according to whether the vowels are front /i /, back unrounded / A/ or back rounded /o
u/.) Measurements were made at an identified landmark between the fricative and the vowel, during the vowel and, when possible, in the consonantal interval. Discrete Fourier transforms were computed with a 6.4 ms Hamming window. The window was carefully placed in order to maximize inclusion of the closed portion of the glottal cycle; this placement avoids the widening of formant bandwidths, which may be asso-ciated with introducing acoustic losses at an open glottis, and enhances identification of spectral peaks.
Formant onset frequencies are identified as Flonset, F2onset, and F3onset.
Formant onset times at the CV boundary designate the point when the amplitude of the first formant increases most rapidly. This energy increase could often be detected :from the time waveform, especially at the landmark between voiceless fricatives and the following vowels. The first formant amplitude at each pitch period in the vicinity of the boundary was examined with a short (6.4 msec) window to confirm the land-mark, and to resolve ambiguity, as needed, especially for cases with voiced fricatives. In addition, wide-band spectrograms were used to further confirm the location of the CV boundary. The formant onset frequencies were measured at the first pitch pulse after the CV boundary.
Midvowel formant frequencies are identified as Flvowel, F2vowel, and F3vowel. Formant frequencies were measured and recorded at the first pitch pulse 70 ms after the CV boundary. In Figure 3.1 example spectra illustrate the reported formant measures for the utterance /6i/ spoken by one of the male speakers. For this particular utterance, formants can be easily tracked throughout the entire CV. However, the difficulty of assigning a single point as the CV boundary between voiced fricatives and vowels is also evident.