HAL Id: hal-02621444
https://hal.inrae.fr/hal-02621444
Submitted on 26 May 2020
HAL is a multi-disciplinary open access
archive for the deposit and dissemination of
sci-entific research documents, whether they are
pub-lished or not. The documents may come from
teaching and research institutions in France or
abroad, or from public or private research centers.
L’archive ouverte pluridisciplinaire HAL, est
destinée au dépôt et à la diffusion de documents
scientifiques de niveau recherche, publiés ou non,
émanant des établissements d’enseignement et de
recherche français ou étrangers, des laboratoires
publics ou privés.
Copyright
Adherence to the french eating model is inversely
associated with overweight and obesity: results from a
large sample of french adults
Pauline Ducrot, Caroline Méjean, France Bellisle, Benjamin Allès, Serge
Hercberg, Sandrine Péneau
To cite this version:
Pauline Ducrot, Caroline Méjean, France Bellisle, Benjamin Allès, Serge Hercberg, et al.. Adherence
to the french eating model is inversely associated with overweight and obesity: results from a large
sample of french adults. British Journal of Nutrition, Cambridge University Press (CUP), 2018, 120
(2), pp.231-239. �10.1017/S0007114518000909�. �hal-02621444�
Adherence to the French Eating Model is inversely associated with overweight
and obesity: results from a large sample of French adults
Pauline Ducrot
1*, Caroline Méjean
2, France Bellisle
1, Benjamin Allès
1, Serge Hercberg
1,3and Sandrine Péneau
11Equipe de Recherche en Epidémiologie Nutritionnelle (EREN), Centre de Recherche en Epidémiologie et Statistiques (CRESS),
Institute for Health and Medical Research (INSERM, U1153), Institute for Health and Medical Research (INSERM, U1153), Institute for Agricultural Research (INRA, U1125), Conservatoire National des Arts et Métiers (Cnam), Université Paris 13, COMUE Sorbonne Paris Cité, 93000 Bobigny, France
2MOISA, Université Montpellier, INRA, CIRAD, CIHEAM-IAMM, Montpellier SupAgro, 34060 Montpellier, France 3Département de Santé Publique, Hôpital Avicenne, 93000 Bobigny, France
(Submitted 10 August 2017– Final revision received 2 March 2018 – Accepted 13 March 2018)
Abstract
The‘French Eating Model’ characterised by structured meals and conviviality has received little attention, although it has been suggested as a potential explanation of the French paradox. This study aims at assessing the adherence to this model in French adults and whether it is associated with weight status. Eating behaviour and, in particular, number of meals per day, snacking frequency, meal time, meal duration, number of courses, position (standing, sitting), presence of others and pleasure experienced was assessed in 2014, in 47 219 participants of the NutriNet-Santé study. A global score of adherence to the French Eating Model was computed on the basis of eating behaviour components. Prevalence of the model was assessed on a sample weighted according to Census data. Associations between adherence to the model (and its components) and overweight and obesity were assessed using logistic regression analyses adjusted for individual characteristics. Most individuals followed the French Eating Model: three meals a day, at set times, sitting at a table with other people and considering meals as a moment of pleasure. Individuals who exhibited higher adherence to the model were less likely to be overweight (OR= 0·89; 95 % CI 0·87, 0·92 or obese (0·76; 95 % CI 0·74, 0·79). Similar trends were found for the following components: number of meals per day, snacking frequency, meal time, meal duration and pleasure experience, whereas an opposite trend was observed for the eating with others component. Although prospective studies are needed to conclude on a causal relationship, these results suggested the potential role of the French Eating Model, which is still prevailing in France, in obesity prevention.
Key words:Eating behaviours: French Eating Model: Overweight: Cross-sectional studies
Obesity has reached epidemic prevalence worldwide, and therefore represents a major public health challenge(1). In France, although recent data described stable rates between 2006 and 2015(2), the prevalence of overweight and obesity remain important (49·0 % and 17·2 % of the French adults, respectively). Therefore, it is important to identify potential levers to reduce the incidence of overweight on health.
The nutritional quality of the diet has been shown to be a predictor of a healthy weight status(3–6). Besides the intrinsic quality of foods, elements of eating patterns, such as the daily number of eating occasions or meal duration, have been suggested to act as potential modulators of food choices and intake(6,7) with a possible impact on body weight status(8). However, such elements remain poorly investigated and gene-rally evaluated separately.
In France, the so-called‘French Eating Model’ is characterised by structured meals and conviviality(9–11). More precisely, three meals are generally eaten per day, at set times, and snacking remains relatively low. Main meals (lunch and dinner) include three courses – starter, main course and dessert – and are taken seated at a table. In addition, meals are pleasurable moments shared with other people and therefore last a relatively long time. This pattern con-trasts with data from other countries where the three-meal pattern is less frequent(12), more snacking is reported(12,13), meals are less synchronised(14) and last for a relatively short duration(15). In addition, although French individuals value the social experience of eating, people from other countries, and in particular Americans, focus more largely on the health effects of eating(13,16).
Over the past decades, some authors have described a simplification or de-structuration of the traditional eating model
Abbreviation: CU, consumption unit.
* Corresponding author: P. Ducrot, email p.ducrot@eren.smbh.univ-paris13.fr
in France(17–19), thus raising the issue of the maintenance of such practices nowadays. One recent study conducted on a representative sample of the adult population living in Paris area has shown that the three-meal pattern is still dominant, although other meal patterns co-exist(20,21). However, no recent study has evaluated the components of the French Eating Model (e.g. pleasure, time spent on meal) through the entire French territory.
The maintenance of this model is important as it is believed to have beneficial effects on health. It has been proposed as an explanation for the ‘French paradox’ (i.e. low cardiovascular mortality despite a high intake of dietary fats)(9,13), and the relatively low frequency of obesity in France(22). However, there is limited evidence to support this assumption. A recent study emphasised that the French Eating Model was associated with adherence to nutritional guidelines for fruit and vegetable, as well as dairy product consumption(20), but no study has addressed weight status. However, a number of studies have informed about components of the French Eating Model. According to a recent review, a greater number of daily eating occasions (including meals and snacking occasions) is consistently associated with higher energy intake(6). However, results on weight status are contrasted. Cross-sectional studies report that the daily number of eating occasions is positively related to BMI, waist circumference(23), overweight and obesity(24), whereas a review examining experimental works found no significant effect of the daily number of eating occasions on weight status(25). A recent review on snacking concluded that no consensus can be established on the basis of the current knowledge(26). Besides, beneficial effects of regular times of food intake have been reported on metabolism(27,28) and weight status(29). In addition, more time spent eating has been associated with a lower BMI(30). However, longer meal duration may be owing to the presence of other people(31), which is associated with increased food intake(32,33)particularly when these persons are friends or family(34,35), and therefore could potentially result in a higher BMI. Meal duration can also be influenced by environmental parameters and in particular television viewing, which is also likely to influence food intake(35–37). Finally, there is a paucity of evidence regarding the associations between other components of the French Eating Model such as the pleasure experienced or the number of courses eaten during the meal, and weight status.
The aims of this study were therefore to assess adherence in 2014 to the French Eating Model and its components in a sample of adults of the general French population and to evaluate the associations with weight status.
Methods Study population
The NutriNet-Santé study (https://info.etude-nutrinet-sante.fr) is an ongoing web-based prospective observational cohort study launched in France in May 2009 with a scheduled follow-up of 10 years. It aims to investigate the relationship between nutrition and chronic disease risk, as well as the determinants of dietary beha-viour and nutritional status. The study was implemented in the
French general population (internet-using adult volunteers, aged ≥18 years). The rationale, design and methodology of the study have been fully described elsewhere(38). In brief, to be included into the study, participants have to complete a baseline set of self-administered, web-based questionnaires assessing dietary intake, physical activity, anthropometric characteristics, lifestyle, socio-economic conditions and health status. As part of the follow-up, participants are asked to complete the same set of questionnaires each year. Moreover, each month, all participants are invited by e-mail tofill in optional questionnaires related to dietary intake, determinants of eating behaviours and nutritional and health sta-tus. This study is conducted in accordance with the Declaration of Helsinki, and all procedures were approved by the Institutional Review Board of the French Institute for Health and Medical Research (IRB no. 0000388FWA00005831) and the Commission Nationale de l’Informatique et des Libertés (nos 908450 and 909216). All participants provided informed consent with an electronic signature. This study is registered in EudraCT (no. 2013-000929-31).
Data collection
Eating behaviour questionnaire. Adherence to the French Eating Model was assessed by means of an optional ques-tionnaire evaluating eating behaviour, launched in the NutriNet-Santé cohort study in April 2014. The questionnaire was administered once to participants and was available during a period of six months.
Although potential benefits have been attributed to the French Eating Model, there is, to our knowledge, no clear definition for it. On the basis of the data in the literature(9–11) and the expertise of scientists specialised in eating behaviour, we defined the French Eating Model according to its two main characteristics: structured meals and conviviality. Therefore, eight components were taken into account: (1) number of meals eaten per day other than snacking (i.e. breakfast, lunch, afternoon snack break, dinner) (one, two, three, four); (2) snacking frequency (every day, at least 3 times/d; every day, 1–2 times/d; 4–6/week; 1–3/week; <1/week; never); (3) meal time of lunch and dinner (different 1-h slots were proposed depending on the meal, lunch: 11.00–12.00, 12.00–13.00, 13.00–14.00, 14.00–15.00 hours; dinner: 17.00–18.00, 18.00–19.00, 19.00–20.00, 20.00–21.00, 21.00–22.00 hours, as well as the following modalities: another time, irregular times, skipping meal (individuals who reported meal skipping were exempted to respond to the next questions regarding the corresponding meal)); (4) meal duration (<5 min, 5–15 min, 15–30 min, 30–45 min, 45–60 min, >60 min); (5) number of courses per meal (one, two, three, four); (6) position during the meal (seated at table, seated but not at table, standing); (7) presence of other people during meal (family, friends, colleagues, alone); and (8) the pleasure experienced (meal is a pleasurable moment, meal is a moment like others, meal is an unpleasant moment). Apart from the components on the number of meals and snacking frequency, all questions were asked for three different contexts: weekday lunch, weekday dinner and weekend lunch. For each context, participants had to report their habitual practices.
Details on computation of the French Eating Model score are presented in Table 1. In brief, for each of these components, points were attributed to the participant’s answer reflecting adherence to the French Eating Model (no adherence= 0, partial adherence = 0·5, total adherence = 1) based on the literature(9–11) and the expertise of researchers in thefields of nutrition and epidemiology.
Practices in total adherence with the French Eating Model were as follows: having three meals per day, having snacking episodes less than once a week, eating at regular times– that is, between 12.00 and 14.00 hours for lunch and between 19.00 and 21.00 hours for dinner– spending at least 30 min on meals, having three or four courses per meal, having meals seated at a table, having meals with others and considering meals as a pleasurable moment. For com-ponents assessed in three different contexts (meal time, meal duration, number of courses per meal, position during meal, pre-sence of guests, pleasure experienced), a score was calculated as the sum of the points weighted according to the context (i.e. a coefficient of 5 was affected to weekday lunch and dinner, and a coefficient of 2 was affected to weekend lunch). Each of the eight components ranged from 0 to 1. The global score of adherence to the French Eating Model was then computed as the sum of the eight components and ranged from 0 to 8 (the higher the score, the higher the adherence to the model).
Individuals who reported usually skipping at least two meals among the three contexts evaluated were excluded from the analyses as they had missing data, which made it difficult to esti-mate a level of adherence to the French Eating Model. Individuals who reported skipping one meal only were included in the ana-lysis but were given zero points for the corresponding context.
Anthropometric data. Height and weight were assessed by using an anthropometric questionnaire, which was self-administered online, at baseline and each year thereafter(39,40). For each parti-cipant, the closest available data to the eating behaviour ques-tionnaire were used for the analysis. BMI (in kg/m2) was calculated as the ratio of weight to height squared. Participants were classified in one of the three following categories: normal weight (18·5 kg/ m2< BMI < 25 kg/m2), overweight excluding obesity (25 kg/m2≤ BMI< 30 kg/m2) and obesity (BMI≥ 30 kg/m2) defined according to WHO reference values(1).
Socio-demographic and economic characteristics. At base-line and annually thereafter, participants in the NutriNet-Santé study are asked to provide socio-demographic data, including sex, age (18–29, 30–49, 50–64, ≥65 years), area of residence (Paris area, Parisian basin, center-east area, east area, Medi-terranean area, north area, western area, south-western area) and city size (recoded as follows: rural commune, urban com-mune of <20 000 inhabitants, urban commune of 20 000– 200 000 inhabitants and urban commune of more than 200 000 inhabitants), educational level (up to secondary, some college or university degree), presence of children in the household (yes, no), familial status (alone, in couple), history of dieting to lose weight during the past year (no, yes) and monthly income (<1200 €, 1200–1799 €, 1800–2699 € and ≥2700 € per consumption unit (CU)). Monthly household income was calculated per‘CU’, where one CU is attributed for the first adult in the household, 0·5 CU for other individuals aged 14 years or older and 0·3 CU for children under 14 years, according to national statistics methodology and guidelines(41). Physical activity level (low, moderate, high) was assessed using a short form of the French version of the International Physical Activity Questionnaire(42). The weekly energy expenditure expressed in metabolic equivalent task minutes per week was estimated, and
Table 1. Score computation evaluating adherence to the eight components of the French Eating Model
Points attributed Number of meals per day
1 0
2 0·5
3 1
4 or more 0·5
Snacking frequency
Every day, at least 3 times/d 0
Every day, 1–2 times/d 0
4–6 times/week 0·5
1–3 times/week 0·5
Less than once a week 1
Never 1
Weekdays Weekend
Lunch Dinner Lunch
Meal time 11.00–12.00 hours 0·5 0·5 12.00–13.00 hours 1 1 13.00–14.00 hours 1 1 14.00–15.00 hours 0·5 0·5 Another hour 0·5 0·5 Irregular hours 0 0 Skipping meal – – 17.00–18.00 hours 0·5 18.00–19.00 hours 0·5 19.00–20.00 hours 1 20.00–21.00 hours 1 21.00–22.00 hours 0·5 Another hour 0·5 Irregular hours 0 Skipping meal – Meal duration <5 min 0 0 0 5–15 min 0 0 0 15–30 min 0·5 0·5 0·5 30–45 min 1 1 1 45–60 min 1 1 1 >60 min 1 1 1
Number of courses per meal
1 0 0 0
2 0·5 0·5 0·5
3 1 1 1
4 1 1 1
Position during meal
Sitting at a table 1 1 1
Sitting but not at a table 0·5 0·5 0·5
Standing 0 0 0 Presence of guests Family 1 1 1 Friends 1 1 1 Colleagues 1 1 1 Alone 0 0 0 Pleasure experienced
Meal is pleasurable moment 1 1 1
Meal is a moment like others 0·5 0·5 0·5
3 scores of physical activity were constituted (i.e. low (<30 min/d), moderate (30–59 min/d) and high (≥60 min/d)) according to the French guidelines for physical activity(43). For each participant, the closest available data to the eating behaviour questionnaire were used for the analysis.
Statistical analysis
A total of 54 197 participants from the NutriNet-Santé study completed the eating behaviour questionnaire. Among them, we excluded 1 454 pregnant women, twenty other individuals who had missing data for height or weight, 210 individuals who reported skipping at least two of the meals assessed in the study, 2939 individuals who had missing data required for the weighting procedure and 2355 because they were underweight (BMI< 18·5 kg/m2). Thus, ourfinal sample comprised 47 219 individuals. Included and excluded participants were compared using χ2 tests and Student’s t tests, as appropriate. Normal weight, overweight and obese participants were compared using Mantel–Haenszel tests. Eating behaviour was described in the three different contexts (i.e. weekday lunch and dinner, and weekend dinner). Global score of adherence to the French Eating Model was assessed across different socio-demographic and lifestyle characteristics, and compared using linear contrast tests. All descriptive data were weighted according to the French population socio-demographic distribution. Weighting was calculated separately for each sex using an iterative pro-portionalfitting procedure and the 2009 national Census data on age, educational level, area of residence and whether or not the household included any children(44). Multinomial logistic regression model was used to evaluate the association between a one-point increase of the global score of adherence to the French Eating Model (ranging from 0 to 8) and overweight and obesity. Secondary analyses were performed to assess the associations between a one-point increase of the different components of the French Eating Model (ranging from 0 to 1) and overweight and obesity. All models were adjusted for sex(20), age(20), educational level(20), monthly income(20), city size, presence of children in the household(20), familial situation(20), history of dieting to lose weight(45)and physical activity level(46). To avoid collinearity, the presence of children in the household and the familial situation were removed from the model based on the presence of guest’s component. Potential interaction effect of the context (weekday v. weekend) was also assessed.
As participants who reported skipping meals had zero points to the corresponding context, sensitivity analyses were per-formed in individuals who did not report skipping any meal.
Missing covariate data (i.e. monthly income per CU, history of dieting to lose weight and physical activity level) were imputed using the multiple imputation method. All tests of significance were two-sided, and a P value<0·05 was considered significant. Statistical analyses were performed using SAS software (version 9.4; SAS Institute Inc.).
Results
Compared with excluded individuals, included individuals were more often men, were older, had lower educational level, had
higher monthly income, were less physically active, were less likely to have children living in the household, were more likely to live in a larger city, to have a history of a diet to lose weight and to be overweight or obese (all P< 0·0001). No significant differences were observed for familial situation.
In our sample, 26·9 % of the participants were overweight and 12·8 % obese. Characteristics of the sample according to weight status are presented in Table 2. Both overweight and obese individuals were older, had lower educational level, lower income, lived more often with a partner, in smaller cities and had more often a history of dieting to lose weight com-pared with normal-weight individuals. Overweight participants were more often men, whereas obese participants were more often women compared with normal-weight individuals. Finally, obese participants included a higher percentage of individuals living without children and were less physically active compared with the other groups.
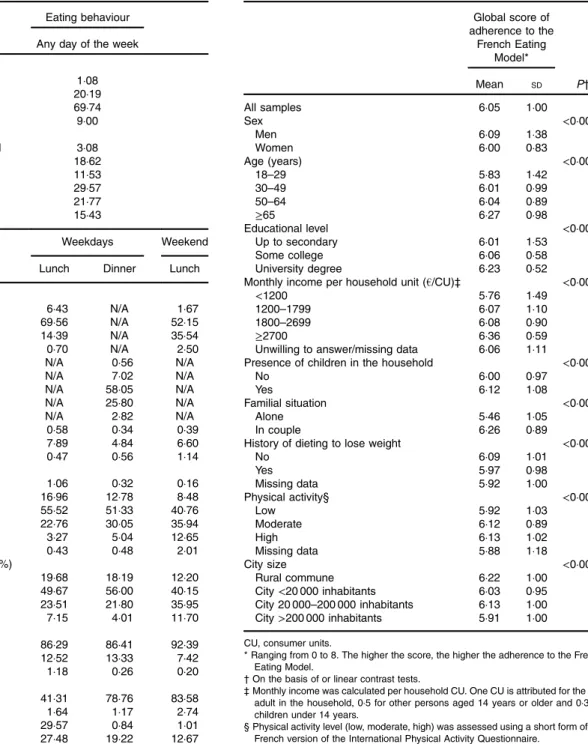
Eating behaviour of the participants during weekdays (lunch and dinner) and weekends (lunch) is described in Table 3. Overall, most of the participants reported consuming three meals a day (about 70 %), and snacking (about 85 %). Weekday meals are relatively synchronised, with about two-thirds of the participants having their lunch between 12.00 and 13.00 hours and almost 60 % having their dinners between 19.00 and 20.00 hours during weekdays. During weekends, almost 90 % of the individuals reported having their lunch between 12.00 and 14.00 hours. More than half of the participants spent 15–30 min on weekday meals, whereas this proportion was close to 40 % on weekends. In comparison with weekday meals, weekend meals lasted longer. Regardless of the context, around half of the participants reported having two courses per meal, whereas the traditional three-course pattern was more frequent during the weekend lunch. Overall, about 90 % of the indivi-duals had their meals seated at a table. Meals were mainly shared with others and in particular family (and colleagues during week lunch specifically). Finally, meals were mostly considered pleasurable moments, and particularly weekend lunch (for about 80 % of the individuals).
The global score of adherence to the French Eating Model across subgroups is presented in Table 4. In the whole sample, the global score was 6·05 (SD1·00), indicating good adherence to the French Eating model (ranging from 0 to 8). Overall, individuals showing higher scores (corresponding to a higher adherence to the model) were more often men, were older, had a higher educational level, had a higher income, had more often children living in the household, lived more often with a partner, had less history of diet were more physically active and lived more often in a rural commune.
The associations between the score of adherence to the French Eating Model, its components and overweight and obesity are presented in Table 5. A one-point increase in the global score (corresponding to an improved adherence to the French Eating model) was associated with lower odds of being overweight and obese. In addition, greater adherence to the following components of the French Eating Model was associated with lower odds of being overweight or obese: number of meals per day, snacking frequency, meal time, meal duration and pleasure experienced. A greater adherence
to the presence of guests’ component was associated with greater odds of being overweight only. No association was found for the number of courses per meal and position during meal components. Sensitivity analyses in individuals who did not report skipping any meal showed similar results. Finally, no significant interaction of the context (weekday v. weekend) was observed.
Discussion
The present findings indicate that the French Eating Model is still dominant in French adults in 2014, although some diver-gences appear for a number of components including less time devoted to meals and a prevailing two-course meal pattern. Our data showed that individuals having greater adherence to the French Eating Model were less likely to be overweight or obese. In addition, individuals reporting greater adherence to components of the French Eating Model, such as number of
meals per day, snacking frequency, meal time, meal duration and pleasure experienced, were less likely to be overweight or obese, whereas those showing a greater adherence to the presence of guests’ component were more likely to be overweight.
In accordance with previous data(11,20,21,47–49), we found that the three-meal-a-day pattern is still the prevailing pattern in France and that people generally had their meals at set times. However, in our sample many individuals had only two meals a day (i.e. 20 %) in agreement with data of a previous study focusing on the Paris area(21). Our results are also consistent with the French national surveys showing a simplification of the meal structure towards two courses(11,49). Most of the indivi-duals in our study had their meals seated at a table. To our knowledge, no study in the literature has focused on this characteristic. The time spent on lunch and dinner meals reported in our sample (15–30 min for most of the participants) diverges from the French Eating Model, which is typically
Table 2. Individual characteristics of 47 219 individuals according to weight status categories; data weighted according to French Census (NutriNet-Santé study, 2014) BMI< 25 kg/m2 (n 30 866) 25≤ BMI < 30 kg/m 2 (n 11 644) BMI≥ 30 kg/m 2 (n 4709) P * Sex (%) <0·0001 Men 44·79 56·58 42·32 Women 55·21 43·42 57·68 Age (years) (%) <0·0001 18–29 22·46 5·87 4·71 30–49 37·54 35·15 29·52 50–64 22·81 29·89 39·42 ≥65 17·19 29·09 26·35 Educational level (%) <0·0001 Up to secondary 68·69 82·52 89·75 Some college 14·53 8·77 5·80 University degree 16·77 8·71 4·45
Monthly income per household unit (€/CU) (%)† <0·0001
<1200 20·79 20·22 26·16
1200–1799 26·40 29·65 26·22
1800–2699 20·62 21·97 19·77
≥2700 15·46 13·95 9·00
Unwilling to answer/missing data 16·73 14·21 18·84
Presence of children in the household (%) <0·0001
No 62·84 62·91 67·06
Yes 37·16 37·09 32·94
Familial situation (%) <0·0001
Alone 30·23 20·92 23·29
In couple 69·77 79·08 76·71
History of dieting to lose weight (%) <0·0001
No 75·27 57·16 40·23 Yes 23·29 41·29 58·40 Missing data 1·43 1·55 1·38 Physical activity (%)‡ <0·0001 Low 19·35 19·45 32·19 Moderate 33·34 28·43 26·02 High 33·05 37·56 24·12 Missing data 14·26 14·56 17·67 City size (%) <0·0001 Rural commune 24·13 26·34 26·61 City<20 000 inhabitants 16·70 17·32 16·19 City 20 000–200 000 inhabitants 15·18 17·09 21·36 City>200 000 inhabitants 44·00 39·25 35·84
CU, consumer units.
* On the basis of Mantel–Haenszel tests (categorical variables).
† Monthly income was calculated per household CU. One CU is attributed for the first adult in the household, 0·5 for other persons aged 14 years or older and 0·3 for children under 14 years.
characterised by a long time spent on main meals(9), and from results of a previous French study showing that the average time spent on meals was 2 h 22 min per d (stable since 1986)(48). Divergences might be owing to the additional time spent on breakfast and snacking in the latter study. Regarding commensality, our results highlighted that most meals were
taken with family, and in particular weekday dinners and weekend lunch. Fewer individuals reported having their meals alone (weekday lunch: 27·5 %, weekend lunch: 12·7 %). By contrast, in another study including younger individuals (21·5 % were aged 18–29 years v. 5·0 % in our sample), meals were as much taken alone as with family(20). Finally, our data emphasise that meals were mainly considered pleasurable moments. In agreement, eating was viewed by French individuals as ‘a necessary thing to live’ but also as ‘a tasting pleasure’ and ‘a good time to share with others’, suggesting the importance of shared enjoyment(49). The greater importance attached to the pleasure
Table 3. Eating behaviour of 47 219 individuals according to the context; data weighted according to French Census (NutriNet-Santé study, 2014)
Eating behaviour Any day of the week Number of meals per day (%)
1 1·08
2 20·19
3 69·74
4 or more 9·00
Snacking frequency (%)
Every day, at least 3 times/d 3·08
Every day, 1–2 times/d 18·62
4–6 times/week 11·53
1–3 times/week 29·57
Less than once a week 21·77
Never 15·43
Weekdays Weekend
Lunch Dinner Lunch
Meal time (%)
11.00–12.00 hours 6·43 N/A 1·67
12.00–13.00 hours 69·56 N/A 52·15
13.00–14.00 hours 14·39 N/A 35·54
14.00–15.00 hours 0·70 N/A 2·50
17.00–18.00 hours N/A 0·56 N/A
18.00–19.00 hours N/A 7·02 N/A
19.00–20.00 hours N/A 58·05 N/A
20.00–21.00 hours N/A 25·80 N/A
21.00–22.00 hours N/A 2·82 N/A
Another hour 0·58 0·34 0·39 Irregular hours 7·89 4·84 6·60 Skipping meal 0·47 0·56 1·14 Meal duration (%) <5 min 1·06 0·32 0·16 5–15 min 16·96 12·78 8·48 15–30 min 55·52 51·33 40·76 30–45 min 22·76 30·05 35·94 45–60 min 3·27 5·04 12·65 >60 min 0·43 0·48 2·01
Number of courses per meal (%)
1 19·68 18·19 12·20
2 49·67 56·00 40·15
3 23·51 21·80 35·95
4 7·15 4·01 11·70
Position during meal (%)
Sitting at a table 86·29 86·41 92·39
Sitting but not at a table 12·52 13·33 7·42
Standing 1·18 0·26 0·20 Presence of guests (%) Family 41·31 78·76 83·58 Friends 1·64 1·17 2·74 Colleagues 29·57 0·84 1·01 Alone 27·48 19·22 12·67 Pleasure experienced (%)
Meal is a pleasurable moment 63·92 72·96 78·56
Meal is a moment like others 34·62 25·94 20·64
Meal is an unpleasant moment 1·46 1·10 0·81
N/A, not applicable.
Table 4. Global score of adherence to the French Eating Model across subgroups of individuals (n 47 219; NutriNet-Santé study, 2014)
Global score of adherence to the French Eating Model* Mean SD P† All samples 6·05 1·00 Sex <0·0001 Men 6·09 1·38 Women 6·00 0·83 Age (years) <0·0001 18–29 5·83 1·42 30–49 6·01 0·99 50–64 6·04 0·89 ≥65 6·27 0·98 Educational level <0·0001 Up to secondary 6·01 1·53 Some college 6·06 0·58 University degree 6·23 0·52
Monthly income per household unit (€/CU)‡ <0·0001
<1200 5·76 1·49
1200–1799 6·07 1·10
1800–2699 6·08 0·90
≥2700 6·36 0·59
Unwilling to answer/missing data 6·06 1·11
Presence of children in the household <0·0001
No 6·00 0·97
Yes 6·12 1·08
Familial situation <0·0001
Alone 5·46 1·05
In couple 6·26 0·89
History of dieting to lose weight <0·0001
No 6·09 1·01 Yes 5·97 0·98 Missing data 5·92 1·00 Physical activity§ <0·0001 Low 5·92 1·03 Moderate 6·12 0·89 High 6·13 1·02 Missing data 5·88 1·18 City size <0·0001 Rural commune 6·22 1·00 City<20 000 inhabitants 6·03 0·95 City 20 000–200 000 inhabitants 6·13 1·00 City>200 000 inhabitants 5·91 1·00
CU, consumer units.
* Ranging from 0 to 8. The higher the score, the higher the adherence to the French Eating Model.
† On the basis of or linear contrast tests.
‡ Monthly income was calculated per household CU. One CU is attributed for the first adult in the household, 0·5 for other persons aged 14 years or older and 0·3 for children under 14 years.
§ Physical activity level (low, moderate, high) was assessed using a short form of the French version of the International Physical Activity Questionnaire.
experienced from food, compared with other countries(13,16), might be one of the reasons for the relative maintenance of the French Eating Model. In addition, the importance attached to conviviality and commensality during meals may explain why meals remain more synchronised compared with other countries(14).
Our results showed that a greater adherence to the French Eating Model was associated with lower odds of being over-weight or obese. Although beneficial effects of the French Eating Model on health have been previously suggested by some authors(9,13,22), to our knowledge, no study has examined the association with health, and particularly weight status. However, some studies have assessed the associations between specific components of the French Eating Model and over-weight. Our results suggested the potential benefit of the three-meal pattern for overweight or obesity, whereas, in the literature, more eating episodes were associated with a lower weight status. More specifically, individuals having fewer than three meals were more likely to be obese(48), whereas those having four or more eating episodes (main meals and snacking) were less likely to be overweight(8). However, no association between the number of meal and weight status was observed in another study(21). Few or no snacking was associated with lower weight status in agreement with the literature(23,24), whereas a review focusing on experimental works found no significant association(25). Differences in the definition of snacking might have led to these discrepancies(26,50). In our sample, individuals who more frequently ate at set times were less likely to be overweight. In agreement, regular eating times have been suggested to exert a positive impact on weight status(29,51), owing to a beneficial influence on metabolism and, in particular, dietary thermogenesis, insulin sensitivity and fasting lipid profiles(27,28). We also observed that spending more time on a meal (more than 30 min) was associated with lower weight status, in agreement with previous data(30). Longer meals might encourage slower eating rates that have been associated
with lower energy intake in comparison with a faster eating rate(52), thus potentially preventing weight gain. In contrast, spending more than 3 h/d for eating (including meals and snacking) has been associated with greater obesity(48), possibly owing to the time spent on snacking. In our sample, individuals who considered meals as pleasurable moments were less likely to be overweight or obese, contrasting with other data showing that pleasure from food can lead to non-homoeostatic con-sumption and consequently to weight gain(53–55). However, pleasure of eating might also be related to Epicurean pleasure, which has been suggested as an ally of eating moderation(56), thus potentially explaining our result. Sharing meals with others (family, friends or colleagues) was associated with higher odds of being overweight, which is in agreement with previous findings indicating the social facilitation of food intake(32–34). Several hypotheses have been advanced to justify this effect, such as the impact of meal duration(33,57), the difficulty to estimate the amount of foods consumed owing to other guests drawing the attention away from food(35,58), the fact that shared meals included more foods(59) and the adjustment of food consumption by comparison with others(59). However, it must be noted that no significant association with obesity was observed. Finally, number of courses per meal and position during meal were not associated with weight status. To our knowledge, there are no data in the literature addressing these issues.
A major strength of our study was the global evaluation of the French Eating Model taking into account 8 components (i.e. number of meals per day, snacking frequency, meal time, meal duration, number of courses, position (standing, sitting), presence of others and experienced pleasure), whereas previous data in the literature had mostly focused on specific components of this model. Another important point was the large sample size that provides high statistical power and gives access to a wide range of socio-demographic and lifestyle profiles. In addition, we used a weighting scheme to be able to apply these results to the
Table 5. Multinomial logistic regression analysis showing the association between adherence to the French Eating Model, its components and overweight/ obesity in 47 219 individuals (NutriNet-Santé study, 2014)
(Odds ratios and 95 % confidence intervals)
Overweight (25 kg/m2≤ BMI < 30 kg/m2) Obesity (BMI≥ 30 kg/m2)
OR 95 % CI P OR 95 % CI P
Global French Eating Model score*† 0·89 0·87, 0·92 <0·0001 0·76 0·74, 0·79 <0·0001
Adherence to the components of the French Eating Model‡
Number of meals per day§ 0·80 0·71, 0·90 0·0003 0·84 0·71, 1·00 0·048
Snacking frequency§ 0·87 0·81, 0·92 <0·0001 0·70 0·64, 0·76 <0·0001
Meal time§ 0·87 0·76, 0·98 0·022 0·70 0·59, 0·82 <0·0001
Meal duration§ 0·80 0·73, 0·88 <0·0001 0·81 0·71, 0·92 0·0013
Number of courses per meal§ 1·08 0·99, 1·19 0·087 1·07 0·94, 1·22 0·31
Position during meal§ 0·97 0·80, 1·16 0·73 0·78 0·61, 1·00 0·053
Presence of guests|| 1·12 1·04, 1·21 0·0023 0·91 0·82, 1·01 0·066
Pleasure experienced§ 0·73 0·65, 0·82 <0·0001 0·44 0·37, 0·51 <0·0001
* The global score evaluating overall adherence to the French Eating Model included eight components relative to meal structure and conviviality and ranged from 0 to 8. Results correspond to the odds of being overweight or obese for an increase of one point of the global French Eating Model score.
† Adjusted for sex, age, educational level, monthly income, presence of children, familial situation, city size, physical activity, history of dieting to lose weight.
‡ Adherence to each component of the French Eating Model was calculated as the weighted mean of points (ranging from 0 to 1) obtained for the three contexts assessed in the study (i.e. weekday lunch/dinner and weekend lunch).
§ Adjusted for sex, age, educational level, monthly income, presence of children, familial situation, city size, physical activity, history of dieting to lose weight and other components of the French Eating Model.
general French population. Despite this strength, caution is nee-ded when generalising our results as participants are volunteers in a nutrition-focused cohort and are therefore more likely to be interested in nutritional and health issues.
The main limitation of this study is the cross-sectional design that does not allow causal links to be demonstrated. Because of the lack of consensual definition of the French Eating Model, the definition used in the present study was based on the literature and expertise of researchers and might therefore be questionable. In addition, all specific meal contexts were not assessed (breakfasts and weekend dinners). Anthropometric data were self-reported by the participants, which may have led to misclassification of the body adiposity status. Nonetheless, a prior validation study of the NutriNet-Santé study demonstrated a good validity of self-reported anthropometric data(39) compared with measured data, with 93 % correct data, suggesting that misclassification should have been limited.
In conclusion, our results emphasise that the French Eating Model is still prevailing in France in 2014, even if some char-acteristics tend to diverge, such as shorter and simpler meals. In addition, individuals complying with this model are less likely to be overweight or obese. Some characteristics of the model appeared to have an important role in this association, by exhibiting a negative association with overweight and obesity (i.e. having three meals a day, having few snacking episodes, eating at set times, taking time when eating and considering meals as moments of pleasure), whereas other characteristics exhibited a positive association with overweight (i.e. eating with others). Although these results should be supported by prospective studies, these data suggest that public health campaigns should integrate messages relative to eating behaviour, in addition to existing guidelines mainly focusing on food choices.
Acknowledgements
The authors thank all scientists, dietitians, technicians and assistants who helped to carry out the NutriNet-Santé study. The authors especially thank the computer scientists Younes Esseddik, Yasmina Chelghoum, Mohand Ait Oufella, Paul Flanzy and Thi Hong Van Duong; the statisticians Veronique Gourlet, Charlie Menard, Fabien Szabo, Nathalie Arnault, Laurent Bourhis and Stephen Besseau; and the dietitians. The authors are grateful to volunteers from the NutriNet-Santé study.
The NutriNet-Santé Study is supported by the French Ministry of Health (DGS), the French Institute for Public Health Sur-veillance (InVS), the French National Institute for Health and Medical Research, the Medical Research Foundation (FRM), the French National Institute for Agricultural Research, the National Conservatory for Arts and Crafts (CNAM), the National Institute for Prevention and Health Education and the University of Paris 13.
P. D. conducted the literature review and drafted the manuscript and performed analyses; C. M., B. A., F. B., S. H. and S. P. were involved in the interpretation of results and critically reviewed the manuscript; and S. H. and S. P. were
responsible for the development of the design and the protocol of the study. All authors read and approved the final manuscript.
The authors declare that there are no conflicts of interest.
References
1. World Health Organization (2000) Obesity: Preventing and Managing the Global Epidemic. Report of a WHO Consulta-tion (WHO Technical Report Series, no. 894). Geneva: WHO. 2. Verdot C, Torres M, Salanave B, et al. (2017) Children and adults body mass index in france in 2015. Results of the Esteban study and trends since 2006. Bull Epidémiol Hebd 13, 234–241.
3. Drenowatz C, Shook RP, Hand GA, et al. (2014) The independent association between diet quality and body composition. Sci Rep 4, 4928.
4. Gao SK, Beresford SA, Frank LL, et al. (2008) Modifications to the Healthy Eating Index and its ability to predict obesity: the Multi-Ethnic Study of Atherosclerosis. Am J Clin Nutr 88, 64–69. 5. Guo X, Warden BA, Paeratakul S, et al. (2004) Healthy Eating
Index and obesity. Eur J Clin Nutr 58, 1580–1586.
6. Leech RM, Worsley A, Timperio A, et al. (2015) Understanding meal patterns: definitions, methodology and impact on nutrient intake and diet quality. Nutr Res Rev 28, 1–21. 7. Nicklas TA, Baranowski T, Cullen KW, et al. (2001) Eating
pat-terns, dietary quality and obesity. J Am Coll Nutr 20, 599–608. 8. Ma Y, Bertone ER, Stanek EJ III, et al. (2003) Association
between eating patterns and obesity in a free-living US adult population. Am J Epidemiol 158, 85–92.
9. Holdsworth M (2008) The French paradox: fact or fiction? – how important are differences in national eating habits in France? Dialog Cardiovasc Med 13, 200–208.
10. Marenco C (1992) Manière de table, modèles de moeurs. Cachan: Editions de l’ENS-Cachan.
11. Mathé T, Tavoularis G & Pilorin T (2009) La gastronomie s’inscrit dans la continuité du modèle alimentaire français (Gastronomy is a Continuation of the French Food Model). Cahier de Recherche du Crédoc no. 267. Paris: Crédoc. 12. Pettinger C, Holdsworth M & Gerber M (2006) Meal patterns
and cooking practices in Southern France and Central England. Public Health Nutr 9, 1020–1026.
13. Rozin P (2005) The meaning of food in our lives: a cross-cultural perspective on eating and well-being. J Nutr Educ Behav 37, S107–S112.
14. Eurostat (2004) How Europeans Spend Their Time-Everyday Life of Women and Men-Data 1998–2002. Luxembourg: Office for Official Publications of the European Communities. 15. Warde A, Cheng S-L, Olsen W, et al. (2007) Changes in the
Practice of Eating. Acta Sociologica 50, 363–385.
16. Rozin P, Fischler C, Imada S, et al. (1999) Attitudes to food and the role of food in life in the U.S.A., Japan, Flemish Belgium and France: possible implications for the diet–health debate. Appetite 33, 163–180.
17. Hébel P & Recours F (2007) Evolution of eating behaviours: generational effects. Cahiers de Nutrition et de Diététique 42, 297–303.
18. Hébel P (2013) Le petit-déjeuner en perte de vitesse (Breakfast in France, a Meal on a Downhill Slide). Consommation & Modes de Vie no. 259. Paris: Crédoc.
19. Poulain JP (2002) The contemporary diet in France: ‘de-structuration’ or from commensalism to ‘vagabond feeding’. Appetite 39, 43–55.
20. Riou J, Lefevre T, Parizot I, et al. (2015) Is there still a French eating model? A taxonomy of eating behaviors in adults living
in the Paris metropolitan area in 2010. PLOS ONE 10, e0119161.
21. Lhuissier A, Tichit C, Caillavet F, et al. (2013) Who still eats three meals a day? Findings from a quantitative survey in the Paris area. Appetite 63, 59–69.
22. Tavoularis G & Mathé T (2010) The French dietary pattern helps to limit the risk of being fat. Consomm Modes Vie 232, 1–4.
23. Murakami K & Livingstone MB (2014) Eating frequency in relation to body mass index and waist circumference in British adults. Int J Obes (Lond) 38, 1200–1206.
24. Murakami K & Livingstone MB (2015) Eating frequency is positively associated with overweight and central obesity in U.S. adults. J Nutr 145, 2715–2724.
25. Raynor HA, Goff MR, Poole SA, et al. (2015) Eating frequency, food intake, and weight: a systematic review of human and animal experimental studies. Front Nutr 2, 38.
26. Bellisle F (2014) Meals and snacking, diet quality and energy balance. Physiol Behav 134, 38–43.
27. Farshchi HR, Taylor MA & Macdonald IA (2004) Regular meal frequency creates more appropriate insulin sensitivity and lipid profiles compared with irregular meal frequency in healthy lean women. Eur J Clin Nutr 58, 1071–1077. 28. Farshchi HR, Taylor MA & Macdonald IA (2005) Beneficial
metabolic effects of regular meal frequency on dietary ther-mogenesis, insulin sensitivity, and fasting lipid profiles in healthy obese women. Am J Clin Nutr 81, 16–24.
29. Garaulet M & Gomez-Abellan P (2014) Timing of food intake and obesity: a novel association. Physiol Behav 134, 44–50. 30. Zick CD, Stevens RB & Bryant WK (2011) Time use choices
and healthy body weight: a multivariate analysis of data from the American Time Use Survey. Int J Behav Nutr Phys Act 8, 84. 31. Feunekes GI, de GC & van Staveren WA (1995) Social
facil-itation of food intake is mediated by meal duration. Physiol Behav 58, 551–558.
32. de Castro JM (1995) Social facilitation of food intake in humans. Appetite 24, 260.
33. de Castro JM (1990) Social facilitation of duration and size but not rate of the spontaneous meal intake of humans. Physiol Behav 47, 1129–1135.
34. de Castro JM (1994) Family and friends produce greater social facilitation of food intake than other companions. Physiol Behav 56, 445.
35. Hetherington MM, Anderson AS, Norton GN, et al. (2006) Situational effects on meal intake: a comparison of eating alone and eating with others. Physiol Behav 88, 498–505. 36. Bellisle F, Dalix AM & Slama G (2004) Non food-related
environmental stimuli induce increased meal intake in healthy women: comparison of television viewing versus listening to a recorded story in laboratory settings. Appetite 43, 175–180. 37. Blass EM, Anderson DR, Kirkorian HL, et al. (2006) On the road to obesity: television viewing increases intake of high-density foods. Physiol Behav 88, 597–604.
38. Hercberg S, Castetbon K, Czernichow S, et al. (2010) The Nutrinet-Sante Study: a web-based prospective study on the relationship between nutrition and health and determinants of dietary patterns and nutritional status. BMC Public Health 10, 242. 39. Lassale C, Peneau S, Touvier M, et al. (2013) Validity of web-based self-reported weight and height: results of the Nutrinet-Sante study. J Med Internet Res 15, e152.
40. Touvier M, Mejean C, Kesse-Guyot E, et al. (2010) Comparison between web-based and paper versions of a self-administered anthropometric questionnaire. Eur J Epidemiol 25, 287–296.
41. INSEE - The National Institute of Statistics and Economic Studies (2016) Definitions, methods and quality - Consump-tion unit definition. https://www.insee.fr/en/metadonnees/ definition/c1802
42. Hagstromer M, Oja P & Sjostrom M (2006) The International Physical Activity Questionnaire (IPAQ): a study of concurrent and construct validity. Public Health Nutr 9, 755–762. 43. Hercberg S, Chat-Yung S & Chaulia M (2008) The French
National Nutrition and Health Program: 2001–2006–2010. Int J Public Health 53, 68–77.
44. INSEE - The National Institute of Statistics and Economic Studies (2014) Definitions, methods and quality - Population census. https://www.insee.fr/en/metadonnees/source/s1156# champ-operation
45. Fuglestad PT, Jeffery RW & Sherwood NE (2012) Lifestyle patterns associated with diet, physical activity, body mass index and amount of recent weight loss in a sample of successful weight losers. Int J Behav Nutr Phys Act 9, 79. 46. Wareham NJ, van Sluijs EM & Ekelund U (2005) Physical
activity and obesity prevention: a review of the current evidence. Proc Nutr Soc 64, 229–247.
47. Anses - The French Agency for Food, Environmental and Occupational Health & Safety (2009) The Individual and National Study on Food Consumption 2 (INCA 2) 2006–2007. Maisons-Alfort. https://www.anses.fr/fr/system/ files/PASER-Ra-INCA2.pdf (in French).
48. De Saint Pol T & Ricroch L (2012) Le temps de l’alimentation en France. INSEE Première, no. 1417. https://www.insee.fr/fr/ statistiques/1281016.
49. Escalon H, Bossard C & Beck F (2009) Baromètre santé nutrition 2008. Saint-Denis: coll. Baromètres santé.
50. Drummond S, Crombie N & Kirk T (1996) A critique of the effects of snacking on body weight status. Eur J Clin Nutr 50, 779–783.
51. Ekmekcioglu C & Touitou Y (2011) Chronobiological aspects of food intake and metabolism and their relevance on energy balance and weight regulation. Obes Rev 12, 14–25.
52. Robinson E, Almiron-Roig E, Rutters F, et al. (2014) A systematic review and meta-analysis examining the effect of eating rate on energy intake and hunger. Am J Clin Nutr 100, 123–151.
53. Blundell JE & Finlayson G (2004) Is susceptibility to weight gain characterized by homeostatic or hedonic risk factors for overconsumption? Physiol Behav 82, 21–25.
54. Finlayson G, King N & Blundell JE (2007) Liking vs. wanting food: importance for human appetite control and weight regulation. Neurosci Biobehav Rev 31, 987–1002.
55. Mela DJ (2006) Eating for pleasure or just wanting to eat? Reconsidering sensory hedonic responses as a driver of obesity. Appetite 47, 10–17.
56. Cornil Y & Chandon P (2016) Pleasure as an ally of healthy eating? Contrasting visceral and Epicurean eating pleasure and their association with portion size preferences and wellbeing. Appetite 104, 52–59.
57. Pliner P, Bell R, Hirsch ES & Kinchla M (2006) Meal duration mediates the effect of‘social facilitation’ on eating in humans. Appetite 46, 189–198.
58. Bellisle F & Dalix AM (2001) Cognitive restraint can be offset by distraction, leading to increased meal intake in women. Am J Clin Nutr 74, 197–200.
59. Herman CP (2015) The social facilitation of eating. A review. Appetite 86, 61–73.