HAL Id: hal-00302943
https://hal.archives-ouvertes.fr/hal-00302943
Submitted on 4 Jul 2007HAL is a multi-disciplinary open access
archive for the deposit and dissemination of sci-entific research documents, whether they are pub-lished or not. The documents may come from teaching and research institutions in France or abroad, or from public or private research centers.
L’archive ouverte pluridisciplinaire HAL, est destinée au dépôt et à la diffusion de documents scientifiques de niveau recherche, publiés ou non, émanant des établissements d’enseignement et de recherche français ou étrangers, des laboratoires publics ou privés.
Asian dust storm influence on North American ambient
PM levels: observational evidence and controlling factors
T. L. Zhao, S. L. Gong, X. Y. Zhang, D. A. Jaffe
To cite this version:
T. L. Zhao, S. L. Gong, X. Y. Zhang, D. A. Jaffe. Asian dust storm influence on North American am-bient PM levels: observational evidence and controlling factors. Atmospheric Chemistry and Physics Discussions, European Geosciences Union, 2007, 7 (4), pp.9663-9686. �hal-00302943�
ACPD
7, 9663–9686, 2007Asian sand and dust storm and North American ambient PM T. L. Zhao et al. Title Page Abstract Introduction Conclusions References Tables Figures ◭ ◮ ◭ ◮ Back Close
Full Screen / Esc
Printer-friendly Version Interactive Discussion
Atmos. Chem. Phys. Discuss., 7, 9663–9686, 2007 www.atmos-chem-phys-discuss.net/7/9663/2007/ © Author(s) 2007. This work is licensed
under a Creative Commons License.
Atmospheric Chemistry and Physics Discussions
Asian dust storm influence on North
American ambient PM levels:
observational evidence and controlling
factors
T. L. Zhao1, S. L. Gong1,2, X. Y. Zhang2, and D. A. Jaffe3 1
Air Quality Research Division, Science and Technology Branch, Environment Canada, 4905 Dufferin Street, Toronto, Ontario, M3H 5T4, Canada
2
Centre for Atmosphere Watch and Services of CMA, Chinese Academy of Meteorological Sciences, Beijing 100081, China
3
University of Washington-Bothell, 18115 Campus Way NE BOTHELL, WA 98011-8246, USA Received: 5 April 2007 – Accepted: 20 June 2007 – Published: 4 July 2007
ACPD
7, 9663–9686, 2007Asian sand and dust storm and North American ambient PM T. L. Zhao et al. Title Page Abstract Introduction Conclusions References Tables Figures ◭ ◮ ◭ ◮ Back Close
Full Screen / Esc
Printer-friendly Version Interactive Discussion
Abstract
New observational evidence of the trans-Pacific transport of Asian dust and its contribu-tion to the ambient particulate matter (PM) levels in North America was revealed, based on the interannual variations between Asian dust storms and the ambient PM levels in western North America from year 2000 to 2006. A high correlation was found between
5
them with an R2value of 0.83. From analysis of the differences in the correlation be-tween 2005 and 2006, three factors explain the variation of trans-Pacific transport and influences of Asian dust storms on PM levels in western North America. These were identified by modeling results and the re-analysis data. They were 1) Strength of frontal
cyclones from Mongolia to north eastern China: The frontal cyclones in East Asia not
10
only bring strong cold air outbreaks, generating dust storms in East Asia, but also lift Asian dust into westerly winds of the free troposphere for trans-Pacific transport; 2)
Pattern of transport pathway over the North Pacific: The circulation patterns of
west-erlies over the North Pacific govern the trans-Pacific transport pattern. Strong zonal airflow of the westerly jet in the free troposphere over the North Pacific favor significant
15
trans-Pacific transport of Asian dust; 3) Variation of precipitation in the North Pacific: The scavenging of Asian dust particles by precipitation is a major process of dust re-moval on the trans-Pacific transport pathway; therefore, variation of precipitation in the North Pacific could affect trans-Pacific transport of Asian dust.
1 Introduction
20
Dust aerosols transported from Asia to North America have been observed at surface observation stations and by satellites (Jaffe et al., 1999; McKendry et al., 2001; Pros-pero et al., 1989; Wilkening et al., 2000). On 15 April 1998, a dust storm in Asia pro-duced a huge atmospheric dust cloud that was transported across the Pacific Ocean and which caused elevated aerosol concentrations over much of the Pacific Coast of
25
North America (Husar et al., 2001). In spring 2001, a number of dust episodes gen-9664
ACPD
7, 9663–9686, 2007Asian sand and dust storm and North American ambient PM T. L. Zhao et al. Title Page Abstract Introduction Conclusions References Tables Figures ◭ ◮ ◭ ◮ Back Close
Full Screen / Esc
Printer-friendly Version Interactive Discussion
erated in Asia were also transported to North America and were captured by many studies during the ACE-Asia campaign (Arimoto et al., 2006; Gong et al., 2003; Hue-bert et al., 2003). The 2001 dust storms resulted in the greatest mass of Asian dust transported to North America in at least the past 20 years and contributed significantly to surface PM levels across the U.S. (Jaffe et al., 2003).
5
The occurrence and transport of Sand Dust Storms (SDS) is controlled by a number of factors, including the surface conditions and wind speeds in the source regions and the strength of prevailing westerly jets. The mechanisms for regional and long-range transport under different climate conditions also vary. The regional-scale transport of Asian dust is dominated by northerly surface winds of the Asian winter monsoon
10
(Zhang et al., 1999), and the surges of cold air associated with the monsoon circula-tion historically increase in strength and frequency from the west during relatively cold and severe climate conditions. Similarly, the increased dust transported from northern sources in Asia are mainly associated with relatively warm and humid climate condi-tions (Zhang et al., 1997). These regional effects are in contrast to the global-dispersal
15
of dust, which is associated with transport by upper-level westerly jets and is mainly the result of desert dust storms during both glacial and interglacial conditions (Zhang et al., 1997). Due to the interannual variations of these conditions, the frequency and strength of SDS in Asia and its trans-Pacific transport changes from year to year and links to many climate variables (Gong et al., 2006a).
20
Using the Interagency Monitoring of Protected Visual Environments (IMPROVE) data from 1989 to 1998, VanCuren and Cahill (2002) analyzed the fine Asian dust aerosol frequency and intensity to mid-latitude North America. Their results indicated that the transport of Asian dust to the eastern Pacific and western North America is consistent and frequent in spring, and contributes between 0.2 and 1.0 µg m−3to PM
2.5. High
fre-25
quency was found in spring, which is consistent with the frequency of SDS occurrences in Asia (Zhou, 2001b). However, one question that remains unsolved concerning the Asian SDS is the relationship between the frequency and strength of SDS in Asia and the frequency and strength of dust aerosol transported to North America, especially for
ACPD
7, 9663–9686, 2007Asian sand and dust storm and North American ambient PM T. L. Zhao et al. Title Page Abstract Introduction Conclusions References Tables Figures ◭ ◮ ◭ ◮ Back Close
Full Screen / Esc
Printer-friendly Version Interactive Discussion
those severe episodes.
This paper presents a study using the observational data from both Asia and North America between 2000 and 2006 to elucidate the correlation between them, and uses model simulations to characterize the linkage between Asian SDS and its transports to North America. Factors controlling the production, transport and removal processes of
5
dust aerosols are analyzed to explain the differences in the mechanism of trans-Pacific transports between 2005 and 2006.
2 Observational evidence
Prior to the year 2000, records of SDS in China were registered in each observa-tion staobserva-tion as dusty days (Zhou, 2001a) for three types of SDS: blowing dust storms
10
(BLDS), sand/dust storms (SDS), and severe SDS (SSDS). For the last half century, this data set has provided valuable records of SDS history and has been used in many studies on the trends of SDS in China (Sun et al., 2001; Zhang et al., 2003; Zhao et al., 2004, 2006). However, the standards for SDS days vary from station to station and do not reflect the systematic features of dust concentrations over larger areas or
15
regions. In 2000, the concept of an SDS process was introduced, providing a definition using certain standards and criteria after considering the synoptic weather patterns (Yang et al., 2007). For example, based on the distribution of existing regular weather stations across the northeast Asia, the number of observing stations that can spot the sand-dust phenomenon under a defined resolution is used to determine the sphere of
20
influence. A blowing dust process is made up of five or more observed blowing dust phenomena over an area, at a given observing hour, under the same weather pattern. By this definition, the total number of SDS processes including BLDS, SDS and SSDS observed in China was 16, 18, 12, 7, 15, 9 and 19 from 2000 to 2006 (Yang et al., 2007). Spring 2006 was one of the most prolific SDS seasons in the last 10 years in
25
China with 19 dust storm processes recorded (Yang et al., 2007; Zhou et al., 2007). To evaluate how the frequency of Asian SDS influences the concentration of dust
ACPD
7, 9663–9686, 2007Asian sand and dust storm and North American ambient PM T. L. Zhao et al. Title Page Abstract Introduction Conclusions References Tables Figures ◭ ◮ ◭ ◮ Back Close
Full Screen / Esc
Printer-friendly Version Interactive Discussion
in North America, data from the IMPROVE network of particulate monitoring sites in the U.S. (Malm et al., 1994) were used. The IMPROVE sites measure aerosols in two size ranges, with a size cut at 2.5 µm diameter (seehttp://vista.cira.colostate.edu/ IMPROVE/). On the fine fraction (PM2.5), a detailed chemical analysis is made along with the aerosol mass concentration. On the coarse fraction, only the aerosol mass
5
concentration is measured (PM10). Measurements are made approximately two times
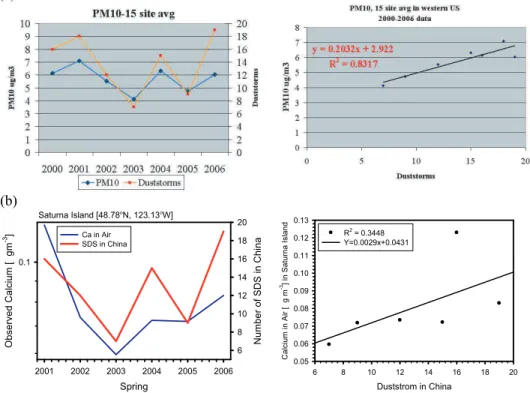
per week for a 24 h period. For this analysis, 15 sites in the western U.S. were chosen, and we examined the correlation between the annual spring (March-May) fine soil con-centration and coarse mass concon-centration with the number of Asian SDS processes, where the soil concentration is given by 2.20*Al + 2.49*Si + 1.63*Ca + 2.42*Fe +
10
1.94*Ti. These sites were chosen so as to minimize the influence of local pollution as well as local dust sources. Note that as of the time of this writing, fine aerosol chem-ical data is available through spring 2004, whereas the coarse mass data is available through the spring of 2006. Figure 1a shows a time series of the annual spring mean PM10 concentration at these 15 sites, along with the total SDS process numbers in
15
China each year and a scatter plot of these variables. The R2 value for the correla-tion between the spring mean PM10 concentration with the number of Chinese SDS is
0.83 (7 years) and the R2 value for the correlation between the spring mean fine dust concentration with the process number of Chinese SDS is 0.68 (5 years). This type of correlation was also observed with the surface Ca measurements at the Canadian
20
CAPMon station on Saturna Island (Fig. 1b) with a smaller R2 value of 0.34 (6 years). The results imply that the number of Chinese SDS has a significant control on the variability in background PM over much of western North America.
One interesting phenomenon in Fig. 1 is the difference in the relationship between the SDS numbers and the PM10(Ca) concentrations in North America. It is evident that
25
dust aerosols were transported to North America in greater amounts during 2005 than in 2006. Factors controlling the interannual variations were further investigated with a modeling study and re-analyzed meteorological data.
ACPD
7, 9663–9686, 2007Asian sand and dust storm and North American ambient PM T. L. Zhao et al. Title Page Abstract Introduction Conclusions References Tables Figures ◭ ◮ ◭ ◮ Back Close
Full Screen / Esc
Printer-friendly Version Interactive Discussion
3 Model simulations of SDS in 2005 and 2006
In order to analyze the difference in production and transport of SDS between 2005 and 2006, model simulations were performed for the spring of both years. The model used in this study is the Northern Aerosol Regional Climate Model (NARCM), which has been used extensively in simulating dust storms during ACE-Asia (Gong et al.,
5
2003) and 44–year climatology of Asian dust aerosol and trans-Pacific transport (Gong et al., 2006b; Zhao et al., 2006). It is shown that NARCM captured most of the Asian dust mobilization and produced reasonable distributions of the dust concentrations over source regions and downwind areas from east China to western North America.
The spatial distribution and sources of SDS in East Asia were obtained from
ob-10
servational data from the monitoring network and the routine meteorological station network of CMA (China Meteorological Administration) from 2004 and 2006 (Wang et al., 2007; Yang et al., 2007). The comparisons of modeled surface dust concentra-tions in north China between spring 2005 and 2006 coincide reasonably well with the interannual variation of Asian dust storms (Fig. 2a) with higher PM10 concentrations at
15
most stations in 2006. The surface dust concentrations in both springs were compara-ble with the measured PM10 in north China (Fig. 2b). Figure 3 shows the differences
of Asian dust emissions modeled by NARCM between spring 2006 and 2005. It was found that SDS occurred more frequently in most source regions, but less in east Mon-golia and north eastern China, in spring 2006 than observed in spring 2005 (Zhou et
20
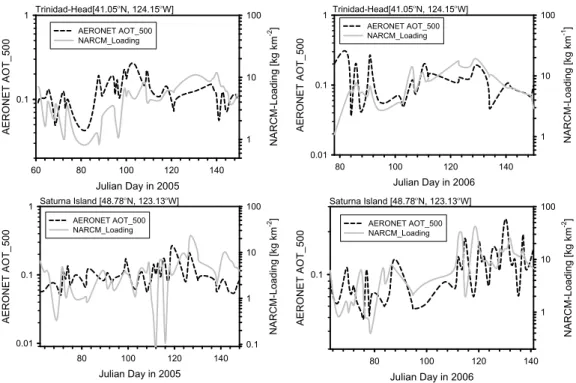
al., 2007). Comparison of the optical depth from AERONET (Aerosol Robotic Network: http://aeronet.gsfc.nasa.gov/) with the simulated dust column loading was performed to evaluate the long-range transported Asian dust to North America. Good agreement between daily variations of modeled dust loading and AERONET AOT500was achieved
(Fig. 4), especially for the SDS episodes.
25
Based on the NARCM-simulations, Table 1 lists the budgets of Asian dust emissions, dry and wet deposition, during its trans-Pacific transport in spring 2005 and 2006. Dust aerosol of 83 Mt and 100 Mt was emitted from the source regions in East Asia in spring
ACPD
7, 9663–9686, 2007Asian sand and dust storm and North American ambient PM T. L. Zhao et al. Title Page Abstract Introduction Conclusions References Tables Figures ◭ ◮ ◭ ◮ Back Close
Full Screen / Esc
Printer-friendly Version Interactive Discussion
2005 and 2006, respectively. After removal from dry and wet deposition to the East Asian subcontinent and the North Pacific, it was estimated from Table 1 that about 9% and 8% Asian dust were engaged in trans-Pacific transport into North America in spring 2005 and 2006, respectively.
4 Analysis of the anomaly of trans-Pacific transport between 2005 and 2006
5
Asian dust involved in trans-Pacific transport is governed by both the Asian dust source strengths and circulation patterns over the North Pacific (Gong et al., 2003b). Dust con-centration variability appears to be dominated by transport variability and/or transport and source covariance rather than source strength variability (Mahowald et al., 2003). Based on the analysis on trans-Pacific transport of Asian dust in spring 2005 and 2006,
10
three factors controlling on Asian dust trans-Pacific transport and its contribution to PM levels in North America are discussed below:
4.1 Frontal cyclones in East Asia
Climatologically, Asian dust storms are closely associated with the activity of frontal cyclones in East Asia. The most favourable atmospheric circulation pattern for Asian
15
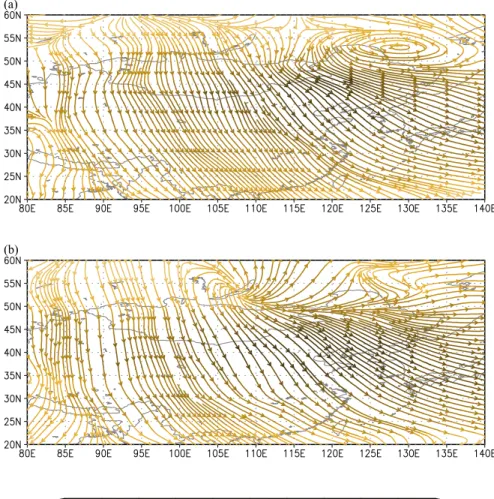
dust storms is when intense cold fronts associated with cyclones sweep across Mon-golia and northern China (Chun et al., 2001; Qian et al., 2002). The regional-scale transport of Asian dust from the desert regions to East Asian offshore regions near the west Pacific mostly occurred below 3 km, dominated by dust emission sources and northwesterly winds from cold frontal activity in East Asia (Zhao et al., 2006). Figure 5
20
shows such a regional-scale transport pattern at 3 km for both spring 2005 and 2006. In spring 2005 a strong cyclone existed in north eastern China (Fig. 5a), while in spring 2006 a divergence center persisted near Lake Baikal in the Siberian region, which could entrain the frequent cold air outbreak and cause more dust storms (Fig. 5b). It is observed that spring 2006 featured noticeably increased SDS in East Asia (Yang et al.,
ACPD
7, 9663–9686, 2007Asian sand and dust storm and North American ambient PM T. L. Zhao et al. Title Page Abstract Introduction Conclusions References Tables Figures ◭ ◮ ◭ ◮ Back Close
Full Screen / Esc
Printer-friendly Version Interactive Discussion
2007). During the regional-scale transport, Asian dust is lifted to the free troposphere over 3 km and carried by the mid-latitude westerlies for long range transport. The verti-cal transport fluxes of Asian dust averaged in spring 2005 and 2006 characterized the major uplift (with the negative values in Fig. 6) of Asian dust at 3 km in east Mongolia and north eastern China (Fig. 6). Although the distributions of vertical transport fluxes
5
in spring 2005 (Fig. 6a) and 2006 (Fig. 6b) were rather similar, considering the variation of Asian spring dust emission from 83 mt in 2005 to 100 mt in 2006 in Table 1, more fraction of emitted dust was raised from the lower to the free troposphere by cyclonic circulation for trans-Pacific transport in spring 2005 than in 2006. The stronger uplift associated with cyclones in north eastern China in 2005, compared to 2006, brought
10
a smaller dry deposition fraction and therefore increased precipitation for a more wet removal fraction over East Asia, as shown in Table 1.
4.2 Trans-Pacific transport pathway
Most trans-Pacific transport of Asian dust aerosol could be expected to be zonal, gov-erned by the prevailing westerly jet in the mid-latitude free troposphere in spring (Jaffe
15
et al., 1999; McKendry et al., 2001; Prospero et al., 1989; Wilkening et al., 2000). Therefore, the zonal dust transport flux can be used to investigate the pathway of Asian dust trans-Pacific transport. The seasonally averaged transport fluxes of Asian dust indicate that most Asian dust trans-Pacific transport occurs in the free troposphere be-tween 3 km and 10 km for both spring 2005 and 2006. The different pathways of Asian
20
trans-Pacific transport for spring 2005 and 2006 are found in Fig. 7. In spring 2005, the trans-Pacific pathway extended zonally across the North Pacific from East Asia to North America with strong zonal airflows over the North Pacific, which could provide more effective trans-Pacific transport of Asian dust (Husar et al., 2001); in spring 2006 the trans-Pacific transport was formed into two pathways: an eastward zonal path over
25
the North Pacific and a meridional path north-eastwards from East Asia to the high-latitudes. The transport pattern caused by the significant meridional flow in East Asia and the west Pacific in spring 2006 weakened the strength of zonal dust transport
ACPD
7, 9663–9686, 2007Asian sand and dust storm and North American ambient PM T. L. Zhao et al. Title Page Abstract Introduction Conclusions References Tables Figures ◭ ◮ ◭ ◮ Back Close
Full Screen / Esc
Printer-friendly Version Interactive Discussion
across the North Pacific.
The correlation analysis of the trans-Pacific transport of Asian dust with various cli-mate indices, based on 44-year interannual variability (Gong et al., 2006) examined the connections of the predominance of zonal or meridional circulation over the North Pacific and trans-Pacific transport. It was confirmed that strong zonal flows of the
west-5
erly jet in the free troposphere over the North Pacific favours significant trans-Pacific transport of Asian dust.
4.3 Scavenging by precipitation in North Pacific
Over the source regions of Asian dust, dry deposition is the dominant removal process, while wet deposition as a function of precipitation is the major process of dust aerosol
10
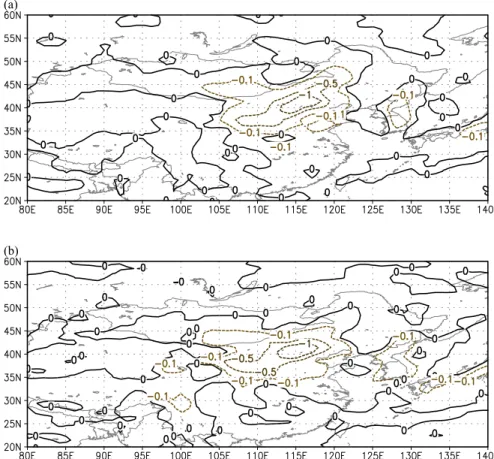
removal from the atmosphere to the ocean in the North Pacific (Zhao et al., 2003). Table 1 shows an apparent difference in wet deposition into the North Pacific between spring 2005 and 2006. In spring 2006, more than 12% of Asian dust was removed by wet deposition over the North Pacific (Table 1). The greater wet deposition in spring 2006 than in 2005 mostly appeared on the pathway in the west and mid-Pacific (Fig. 8).
15
The differences in dust wet deposition (Fig. 8) were consistent with that of the season-ally averaged precipitation between spring 2006 and 2005, especiseason-ally over the west and mid-Pacific, where more precipitation fell in spring 2006 than 2005 (Fig. 9). As the scavenging of Asian dust particles by precipitation is a major process of dust removal on the trans-Pacific transport pathway, the variation of precipitation in the North Pacific
20
has a significant impact on the on trans-Pacific transport of Asian dust.
5 Conclusions
The observational fact of Asian dust trans-Pacific transport and contribution to the am-bient PM levels in North America was revealed, based on the connections of interan-nual variations between Asian dust storms and the ambient PM levels in western North
ACPD
7, 9663–9686, 2007Asian sand and dust storm and North American ambient PM T. L. Zhao et al. Title Page Abstract Introduction Conclusions References Tables Figures ◭ ◮ ◭ ◮ Back Close
Full Screen / Esc
Printer-friendly Version Interactive Discussion
America. The results imply that the number of Chinese SDS has significant control on the variability in background PM over western North America. The difference in the connections between the process numbers and the PM10 (Ca) concentrations in
North America in spring 2005 and 2006 were analysed with NARCM simulations. The interannual variability of springtime PM levels in western North America was controlled
5
by covariance of Asian dust source and trans-Pacific transport. From investigation of Asian dust trans-Pacific transport in spring 2005 and 2006, three major controlling factors on variations of Asian trans-Pacific transport and contribution to PM levels in western North America were identified:
1. Strength of frontal cyclones from Mongolia to north eastern China: The most
10
favourable atmospheric circulation pattern for Asian dust storms is when intense cold fronts associated with cyclones sweep across Mongolia and northern China. The frontal cyclones not only bring strong surface north westerly winds from cold frontal activity for dust storms in East Asia, but also raise Asian dust with their upward current into the westerly winds of the free troposphere for trans-Pacific
15
transport.
2. Pattern of transport pathway over the North Pacific: The circulation patterns of westerlies over the North Pacific govern the trans-Pacific transport pattern. The evolution of zonal or meridional circulation patterns in the mid-latitudes could re-sult in variations of transport pathways across the North Pacific. Strong zonal
20
airflows of the westerly jet in the free troposphere over the North Pacific favour significant trans-Pacific transport of Asian dust.
3. Variation of precipitation in the North Pacific: Over the source regions of Asian dust, dry deposition is the dominant removal process, while the scavenging of Asian dust particles by precipitation is the major process of dust removal on the
25
trans-Pacific transport pathway; therefore, interannual variability of precipitation in the North Pacific clearly has an impact on trans-Pacific transport of Asian dust.
ACPD
7, 9663–9686, 2007Asian sand and dust storm and North American ambient PM T. L. Zhao et al. Title Page Abstract Introduction Conclusions References Tables Figures ◭ ◮ ◭ ◮ Back Close
Full Screen / Esc
Printer-friendly Version Interactive Discussion
Acknowledgements. The authors wish to thank for the financial supports from the
Na-tional Basic Research Program (973) (2006CB403703 and 2006CB403701) and the MOST (2004DIB3J115) of China for this project.
References
Arimoto, R., Kim, Y. J., Kim, Y. P., Quinn, P. K., Bates, T. S., Anderson, T. L., Gong, S.
5
L., I. Uno, M. C., Huebert, B. J., Clarke, A. D., Shinozuka, Y., Weber, R. J., Anderson, J. R., Guazzotti, S. A., Sullivan, R. C., Sodeman, D. A., Prather, K. A., and Sokolik, I.: Characterization of Asian Dust during ACE-Asia, Global Planet. Change, 52, 23–56, doi:10.1016/j.gloplacha.2006.02.013, 2006.
Chun, Y., Boo, K.-O., Kim, J., Park, S.-U., and Lee, M.: Synopsis, transport and physical
10
characteristics of Asian dust in Korea, J. Geophys. Res., 106, 18 461–18 469, 2001.
Gong, S. L., Zhang, X. Y., Zhao, T. L., McKendry, I. G., Jaffe, D. A., and Lu, N. M.: Charac-terization Of Soil Dust Distributions In China And Its Transport During ACE-ASIA 2. Model Simulation and Validation, J. Geophys. Res., 108, 4262, doi:10.1029/2002JD002633, 2003. Gong, S. L., Zhang, X. Y., Zhao, T. L., Zhang, X. B., Barrie, L. A., McKendry, I. G., and Zhao,
15
C. S.: A Simulated Climatology of Asian Dust Aerosol and its Trans-Pacific Transport 2. Interannual Variability and Climate Connections, J. Climate, 19, 104–122, 2006a.
Gong, S. L., Zhang, X. Y., Zhao, T. L., Zhang, X. B., Barrie, L. A., McKendry, I. G., and Zhao, C. S.: A simulated climatology of Asian dust aerosol and its trans-Pacific transport. Part II: Interannual variability and climate connections, J. Climate, 19, 104–122, 2006b.
20
Huebert, B. J., Bates, T., Russell, P. B., Shi, G., Kim, Y. J., Kawamura, K., Carmicheal, G., and Nakajima, T.: An overview of ACE-Asia: Strategies for quantifying the relation-ships between Asian aerosols and their climatic impacts, J. Geophys Res., 108, 8633, doi:10.1029/2003JD003550, 2003.
Husar, R. B., Tratt, D. M., Schichtel, B. A., Falke, S. R., Li, F., Jaffe, D., Gass ´o, S., Gill,
25
T., Laulainen, N. S., Lu, F., Reheis, M. C., Chun, Y., Westphal, D., Holben, B. N., Guey-mard, C., McKendry, I., Kuring, N., Feldman, G. C., McClain, C., Frouin, R. J., Merrill, J., DuBois, D., Vignola, F., Murayama, T., Nickovic, S., Wilson, W. E., Sassen, K., Sugi-moto, N., and Malm, W. C.: Asian dust evens of April 1998, J. Geophys. Res., 106, 18317, doi:10.1029/2000JD900359, 2001.
ACPD
7, 9663–9686, 2007Asian sand and dust storm and North American ambient PM T. L. Zhao et al. Title Page Abstract Introduction Conclusions References Tables Figures ◭ ◮ ◭ ◮ Back Close
Full Screen / Esc
Printer-friendly Version Interactive Discussion Jaffe, D. A., Anderson, T., Covert, D., Kotchenruther, R., Trost, B., Danielson, J., Simpson, W.,
Berntsen, T., Karlsdottir, S., Blake, D., Harris, J., Carmichael, G., and Uno, I.: Transport of Asian air pollution to North America, Geophys. Res. Lett., 26, 711–714, 1999.
Jaffe, D. A., Snow, J., and Cooper, O.: The April 2001 Asian dust events: Transport and sub-stantial impact on surface particulate matter concentrations across the United States, EOS
5
Transactions, 18 November, 2003.
Mahowald, N., Luo, C., del Corral, J., and Zender, C. S.: Interannual variability in atmospheric mineral from a 22-year model simulation and observational, J. Geophys. Res., 108, 4352, doi:10.1029/2002JD002821, 2003.
Malm, W. C., Sisler, J. F., Huffman, D., Eldred, R. A., and Cahill, T. A.: Spatial and seasonal
10
trends in particle concentration and optical extinction in the United States, J. Geophys. Res., 99, 1347–1370, 1994.
McKendry, I. G., Hacker, J. P., Stull, R., Sakiyama, S., Mignacca, D., and Reid, K.: Long-range transport of Asian dust to the Lower Fraser Valley, British Columbia, Canada, J. Geophys. Res., 106, 18 361–18 370, 2001.
15
Prospero, J. M., Uematsu, M., and Savoie, D. L.: Mineral aerosol transport to the Pacific Ocean, in: Chemical Oceanography, edited by: Riley, J. P., Chester, R., and Duce, R. A., Academic, San Diego, CA, 188–218, 1989.
Qian, W., Quan, L., and Shi, S.: Variability of the dust storm in China and climatic control, J. Climate, 15, 1216–1229, 2002.
20
Sun, J. M., Zhang, M. Y., and Liu, T. S.: Spatial and temporal characteristics of dust storms in China and its surrounding regions, 1960–1999: Relations to source area and climate, J. Geophys. Res., 106, 10 325–10 333, 2001.
VanCuren, R. A. and Cahill, T. A.: Asian aerosols in North America: Frequency and concentra-tion of fine dust, J. Geophys. Res., 107, 4804, doi:10.1029/2002JD002204, 2002.
25
Wang, Y. Q., Zhang, X. Y., Gong, S. L., Zhou, C. H., Hu, X. Q., Liu, H. L., Niu, T., and Yang, Y. Q.: Surface observation of sand and dust storm in East Asia and its application in CUACE/Dust forecasting system, Atmos. Chem. Phys. Discuss., accepted, 2007.
Wilkening, K. E., Barrie, L. A., and Engle, M.: Trans-Pacific air pollution, Science, 290, 65–67, 2000.
30
Yang, Y. Q., Hou, Q., Zhou, C. H., Liu, H. L., Wang, Y. Q., and Niu, T.: A Study on Sand/dust Storms over Northeast Asia and Associated Large-Scale Circulations in Spring 2006, Atmos. Chem. Phys. Discuss., accepted, 2007.
ACPD
7, 9663–9686, 2007Asian sand and dust storm and North American ambient PM T. L. Zhao et al. Title Page Abstract Introduction Conclusions References Tables Figures ◭ ◮ ◭ ◮ Back Close
Full Screen / Esc
Printer-friendly Version Interactive Discussion Zhang, X. Y., An, Z. S., and Cao, J. J.: Dust emission from Chinese desert sources linked to
variations in atmospheric circulation, J. Geophys. Res., 102, 28 041–28 047, 1997.
Zhang, X. Y., Arimoto, R., and An, Z. S.: Glacial and interglacial patterns for Asian dust trans-port, Quart. Sci. Rev., 18, 811–819, 1999.
Zhang, X. Y., Gong, S. L., Zhao, T. L., Arimoto, R., Wang, Y. Q., and Zhou, Z. J.: Sources of
5
Asian dust and role of climate change versus desertification in Asian dust emission, Geo-phys. Res. Lett., 30, 2272, doi:10.1029/2003GL018206, 2003.
Zhao, C., Dabu, X., and Li, Y.: Relationship between climatic factors and dust
storm frequency in the Inner Mongolia of China, Geophys. Res. Lett., 31, L01103, doi:10.1029/2003GRL018206, 2004.
10
Zhao, T. L., Gong, S. L., Zhang, X. Y., Blanchet, J. P., McKendry, I. G., and Zhou, Z. J.: A sim-ulated climatology of Asian dust aerosol and its trans-Pacific transport. Part I: Mean climate and validation, J. Climate, 19, 88–103, 2006.
Zhou, C. H., Gong, S. L., Zhang, X. Y., Wang, Y. Q., Niu, T., Liu, H. L., Zhao, T. L., Yang, Y. Q., and Hou, Q.: Development and Evaluation of an Operational SDS Forecasting System for
15
East Asia: CUACE/Dust Atmos. Chem. Phys. Discuss., 7, 7987–8015, 2007,
http://www.atmos-chem-phys-discuss.net/7/7987/2007/.
Zhou, Z. J.: Blowing-sand and sandstorm in China in recent 45 years. Quaternary Research (Chinese) 21, 9-17 (in Chinese), 2001a.
Zhou, Z. J.: Blowing dust and sand/dust storm processes in last 45 years, J. Quaternary Study
20
ACPD
7, 9663–9686, 2007Asian sand and dust storm and North American ambient PM T. L. Zhao et al. Title Page Abstract Introduction Conclusions References Tables Figures ◭ ◮ ◭ ◮ Back Close
Full Screen / Esc
Printer-friendly Version Interactive Discussion Table 1. Asian Dust Emission and Removal by Dry and Wet Deposition (in megatons) and
Percentage of Deposition relative to Dust Emission in Spring 2005 and 2006.
Groups Spring 2005 Spring
2006
East Asian dust emission 82.88 99.78
East Asian subcontinent Dry deposition 48.79(58.87%) 58.89(59.02%)
Wet removal 9.52
(11.49%)
10.38 (10.40%)
North Pacific Dry deposition 9.15(11.04%) 10.37(10.39%)
Wet removal 8.26
(9.97%)
12.24 (12.26%) Remaining after removal by Dry and Wet
Deposition over East Asia and North Pacific
7.16 (8.63%) 7.90 (7.93%)
ACPD
7, 9663–9686, 2007Asian sand and dust storm and North American ambient PM T. L. Zhao et al. Title Page Abstract Introduction Conclusions References Tables Figures ◭ ◮ ◭ ◮ Back Close
Full Screen / Esc
Printer-friendly Version Interactive Discussion (b) Saturna Island [48.78oN, 123.13oW] Spring 2001 2002 2003 2004 2005 2006 O b se rv e d C a lc iu m [ g m -3] 0.1 N u mb e r o f SD S i n C h in a 6 8 10 12 14 16 18 20 Ca in Air SDS in China Duststrom in China 6 8 10 12 14 16 18 20 C a lc iu m i n A ir [ g m -3] in Sa tu rn a I sl a n d 0.05 0.06 0.07 0.08 0.09 0.10 0.11 0.12 0.13 R2 = 0.3448 Y=0.0029x+0.0431 (a)
Fig. 1. (a)Time series of spring mean PM10concentration at 15 sites in the western U.S. and the total SDS (sand and dust storms) process numbers in China from spring 2000 to 2006 (left) and a scatter plot of both variables (right). The 15 sites are Bliss State Park, CA; Bridger Wilderness, WY; Columbia River, WA; Crater Lake, OR; Craters of the Moon, ID; Lassen, CA; Mt. Rainier, WA; Pinnacles, CA; Redwood NP, CA; Sawtooth NF, ID; Snoqualimie Pass, WA; Sula Peak, MT; Three Sisters, OR; Yellowstone, WY; and Yosemite, CA. (b). Same as in Fig. 1a but for spring mean Ca concentration at Saturna Island, Canada from 2001 to 2006.
ACPD
7, 9663–9686, 2007Asian sand and dust storm and North American ambient PM T. L. Zhao et al. Title Page Abstract Introduction Conclusions References Tables Figures ◭ ◮ ◭ ◮ Back Close
Full Screen / Esc
Printer-friendly Version Interactive Discussion Observation Station in North China
0 1 2 3 4 5 6 7 8 9 10 11 12 13 14 15 16 17 18 M o d e le d D u st C o n ce n tra ti o n [μ g m -3 ] 0 200 400 600 800 1000 Spring 2005 Spring 2006 μ μ
Fig. 2a. Comparisons of modeled surface dust concentrations at 17 observation stations in North China between spring 2005 and 2006.
ACPD
7, 9663–9686, 2007Asian sand and dust storm and North American ambient PM T. L. Zhao et al. Title Page Abstract Introduction Conclusions References Tables Figures ◭ ◮ ◭ ◮ Back Close
Full Screen / Esc
Printer-friendly Version Interactive Discussion 7 18 μ NARCM-Simulation [μg m-3] 0 200 400 600 800 1000 1200 O b se rve d PM1 0 [μ g m -3 ] 0 200 400 600 800 1000 1200 R2 = 0.6421 y=0.6321x+135.53
Fig. 2b. Shows the correlations of the modeled surface dust concentrations with observed PM10at the 17 stations for spring 2005 and 2006.
ACPD
7, 9663–9686, 2007Asian sand and dust storm and North American ambient PM T. L. Zhao et al. Title Page Abstract Introduction Conclusions References Tables Figures ◭ ◮ ◭ ◮ Back Close
Full Screen / Esc
Printer-friendly Version Interactive Discussion Fig. 3. Differences of simulated Asian dust emission (tons km−2) between spring 2006 and
2005.
ACPD
7, 9663–9686, 2007Asian sand and dust storm and North American ambient PM T. L. Zhao et al. Title Page Abstract Introduction Conclusions References Tables Figures ◭ ◮ ◭ ◮ Back Close
Full Screen / Esc
Printer-friendly Version Interactive Discussion Trinidad-Head[41.05οN, 124.15οW] Julian Day in 2005 60 80 100 120 140 AER O N E T AO T _ 5 0 0 0.1 1 N AR C M-L o a d in g [ kg km -2] 1 10 100 AERONET AOT_500 NARCM_Loading Trinidad-Head[41.05οN, 124.15οW] Julian Day in 2006 80 100 120 140 AER O N ET AO T _ 5 0 0 0.01 0.1 1 N AR C M-L o a d in g [ kg km -1] 1 10 100 AERONET AOT_500 NARCM_Loading Saturna Island [48.78οN, 123.13οW] Julian Day in 2005 80 100 120 140 AER O N ET AO T _ 5 0 0 0.01 0.1 1 N AR C M-L o a d in g [ kg k m -2] 0.1 1 10 100 AERONET AOT_500 NARCM_Loading Saturna Island [48.78οN, 123.13οW] Julian Day in 2006 80 100 120 140 A E R O N ET AO T _ 5 0 0 0.1 N A R C M -L o a d in g [ kg k m -2 ] 1 10 100 AERONET AOT_500 NARCM_Loading
Fig. 4. Comparisons of the modeled column dust loading (kg km−2) with the optical depth of AERONET AOT500 in Trinidad-Head and Saturna Island in spring 2005 and 2006.
ACPD
7, 9663–9686, 2007Asian sand and dust storm and North American ambient PM T. L. Zhao et al. Title Page Abstract Introduction Conclusions References Tables Figures ◭ ◮ ◭ ◮ Back Close
Full Screen / Esc
Printer-friendly Version Interactive Discussion
(a)
(b)
Fig. 5. Seasonally mean streamlines of dust transport fluxes (µg m−2s−1) at 3000 m over the Asian region in spring (a) 2005 and (b) 2006.
ACPD
7, 9663–9686, 2007Asian sand and dust storm and North American ambient PM T. L. Zhao et al. Title Page Abstract Introduction Conclusions References Tables Figures ◭ ◮ ◭ ◮ Back Close
Full Screen / Esc
Printer-friendly Version Interactive Discussion
(a)
(b)
Fig. 6. Seasonal averages of vertical dust transport fluxes (µg m−2s−1) at 3000 m over the Asian region in spring (a) 2005 and (b) 2006.
ACPD
7, 9663–9686, 2007Asian sand and dust storm and North American ambient PM T. L. Zhao et al. Title Page Abstract Introduction Conclusions References Tables Figures ◭ ◮ ◭ ◮ Back Close
Full Screen / Esc
Printer-friendly Version Interactive Discussion
(a)
(b)
Fig. 7. Seasonally averaged distributions of zonal dust transport fluxes (µgm−2s−1) at 5000 m in spring (a) 2005 and (b) 2006.
ACPD
7, 9663–9686, 2007Asian sand and dust storm and North American ambient PM T. L. Zhao et al. Title Page Abstract Introduction Conclusions References Tables Figures ◭ ◮ ◭ ◮ Back Close
Full Screen / Esc
Printer-friendly Version Interactive Discussion Fig. 8. Differences of modeled wet depositions (ton km−2) between spring 2005 and 2006.
ACPD
7, 9663–9686, 2007Asian sand and dust storm and North American ambient PM T. L. Zhao et al. Title Page Abstract Introduction Conclusions References Tables Figures ◭ ◮ ◭ ◮ Back Close
Full Screen / Esc
Printer-friendly Version Interactive Discussion Fig. 9. Differences of the seasonally averaged precipitation (mm day−1) from CMAP (CPC
(Climate Prediction Center of NOAA) Merged Analysis of Precipitation) data between spring 2005 and 2006.