HAL Id: inserm-02633642
https://www.hal.inserm.fr/inserm-02633642
Submitted on 27 May 2020
HAL is a multi-disciplinary open access
archive for the deposit and dissemination of
sci-entific research documents, whether they are
pub-lished or not. The documents may come from
teaching and research institutions in France or
abroad, or from public or private research centers.
L’archive ouverte pluridisciplinaire HAL, est
destinée au dépôt et à la diffusion de documents
scientifiques de niveau recherche, publiés ou non,
émanant des établissements d’enseignement et de
recherche français ou étrangers, des laboratoires
publics ou privés.
dendritic cells in humanized mice
Giorgio Anselmi, Kristine Vaivode, Charles-Antoine Dutertre, Pierre
Bourdely, Yoann Missolo-Koussou, Evan Newell, Oliver Hickman, Kristie
Wood, Alka Saxena, Julie Helft, et al.
To cite this version:
Giorgio Anselmi, Kristine Vaivode, Charles-Antoine Dutertre, Pierre Bourdely, Yoann
Missolo-Koussou, et al.. Engineered niches support the development of human dendritic cells in humanized
mice. Nature Communications, Nature Publishing Group, 2020, 11 (1), pp.2054.
�10.1038/s41467-020-15937-y�. �inserm-02633642�
Engineered niches support the development of
human dendritic cells in humanized mice
Giorgio Anselmi
1,2,7
, Kristine Vaivode
1,2
, Charles-Antoine Dutertre
3
, Pierre Bourdely
1,2
,
Yoann Missolo-Koussou
4
, Evan Newell
3
, Oliver Hickman
1,2,8
, Kristie Wood
5,9
, Alka Saxena
5
, Julie Helft
4
,
Florent Ginhoux
3
& Pierre Guermonprez
1,2,6
✉
Classical dendritic cells (cDCs) are rare sentinel cells specialized in the regulation of adaptive
immunity. Modeling cDC development is crucial to study cDCs and harness their therapeutic
potential. Here we address whether cDCs could differentiate in response to trophic cues
delivered by mesenchymal components of the hematopoietic niche. We
find that
mesenchymal stromal cells engineered to express membrane-bound FLT3L and stem cell
factor (SCF) together with CXCL12 induce the speci
fication of human cDCs from CD34
+hematopoietic stem and progenitor cells (HSPCs). Engraftment of engineered mesenchymal
stromal cells (eMSCs) together with CD34
+HSPCs creates an in vivo synthetic niche in the
dermis of immunode
ficient mice driving the differentiation of cDCs and CD123
+AXL
+CD327
+pre/AS-DCs. cDC2s generated in vivo display higher levels of resemblance with
human blood cDCs unattained by in vitro-generated subsets. Altogether, eMSCs provide a
unique platform recapitulating the full spectrum of cDC subsets enabling their functional
characterization in vivo.
https://doi.org/10.1038/s41467-020-15937-y
OPEN
1Centre for Inflammation Biology and Cancer Immunology, The Peter Gorer Department of Immmunobiology, King’s College London, London, UK.2Cancer Research UK, King’s Health Partners Cancer Centre, King’s College London, London, UK.3Singapore Immunology Network (SIgN), A*STAR,
Singapore, Singapore.4Paris-Sciences-Lettres University, Institut Curie Research Center, INSERM U932 & SiRIC, Translational Immunotherapy Team, Paris, France.5National Institute of Health Research Biomedical Research Centre at Guy’s and St Thomas’ Hospital and King’s College London, London, UK. 6Université de Paris, Centre for Inflammation Research, CNRS ERL8252, INSERM1149, Paris, France.7Present address: MRC Molecular Hematology Unit,
MRC Weatherall Institute of Molecular Medicine, Radcliffe Department of Medicine, University of Oxford, Oxford, UK.8Present address: Drug Target
Discovery Team, Division of Breast Cancer Research, Institute of Cancer Research, London, UK.9Present address: Labcyte Ltd, Norton Canes, Cannock,
Staffordshire, UK. ✉email:[email protected]
123456789
C
lassical human dendritic cells (cDCs) are sentinels of the
immune system with a unique ability to regulate the
func-tion of T lymphocytes
1. Dendritic cells (DCs) can induce
immune tolerance
2or drive the development of immunity
3.
The analysis of blood circulating subsets has revealed that cDCs
consist in two major subtypes: CD141
+XCR1
+Clec9A
+DCs
(cDC1) and CD1c
+CD11c
+CD172a (SIRPα)
+DCs (cDC2s)
4–6.
Both cDC1s and cDC2s arise from a bone marrow committed
progenitor
7or from early IRF8
+multipotent progenitors
8,9, which
generate a common circulating precursor
10that progressively
diverge in pre-cDC1s and pre-cDC2s
10–12. Type 1 DCs are
con-served between mouse and human, and they share the expression of
specific surface markers such as Clec9A
13and XCR1
5, as well as the
transcription factor (TF) IRF8, which is essential for the
develop-ment of murine cDC1s
4–6,13–15. Conversely, human CD1c
+type 2
DCs have been shown to express the IRF4 TF
16, which controls the
development of their phenotypic equivalent in the mouse
model
16,17. This rather simple picture is complicated by the
diversity of CD1c
+cells, which encompass migratory DCs and
CD14
intinflammatory DCs recruited during inflammation
18,19.
More recently, unbiased approaches have uncovered a deeper
complexity in the DC network with the identification of two types
of cDC2s with distinct transcriptional profiles and the identification
of AXL
+CD11c
+CD1c
+cells, which have been proposed to act as a
precursor for cDCs
12,20.
Human hematopoietic progenitors reside in the stem cells
niche of the bone marrow. Genetic studies in the murine model
identified three essential factors supporting HSPCs homeostasis:
the membrane-bound form of stem cell factor (SCF/KITL)
21,22,
the C-X-C motive chemokine 12 (CXCL12)
23,24and
thrombo-poietin (TPO)
25,26. In the bone marrow, perivascular
mesench-ymal stromal cells have been described as the main source of SCF
and other niche factors
27. At steady state, Flt3-ligand (FLT3L) is
delivered as a membrane-bound precursor expressed on
radio-resistant stromal cells
28–30. After egressing from the bone
mar-row, DC precursors circulate in the blood and seed the peripheral
tissues
31. In the lymph node, stromal
fibroblastic reticular cells
provide FLT3L
32and FLT3-dependent proliferation of cDC in
periphery is required for their maintenance
33,34.
Modeling the development of cDCs in culture systems is
instrumental to better understand their ontogeny and define their
immunological function. Pioneer work from Banchereau et al.
35have identified that granulocyte–macrophage colony-stimulating
factor (GM-CSF) and tumor necrosis factor-α (TNF-α) cooperate
to produce CD1a
+cells with features of Langerhans cells from
CD34
+hematopoietic stem and progenitor cells (HSPCs).
Sal-lusto et al.
36have shown that GM-CSF and interleukin (IL)-4
induce the differentiation of CD1c
+CD1a
+inflammatory DCs
from CD14 monocytes. More recent work has demonstrated that
FLT3L (with TPO or with SCF/KITL, GM-CSF, and IL-4) is
instrumental in generating CD141
+cDC1s aligning
phenotypi-cally and functionally with cDC1s
7,8,37–39. This is in line with the
crucial role of FLT3L, engaging the Flt3 receptor tyrosine
kinase
40,41in controlling DC homeostasis both in mice
31,33,42,43and humans
10,28,44,45. Moreover, the activation of Notch
signal-ing pathway has been shown to further improve the in vitro
differentiation of both human and mouse cDC1s
46,47. Despite the
successes in modeling cDC1 differentiation in vitro, CD1c
+cells
found in culture of CD34
+HSPCs either align poorly with
bona
fide blood circulating cDC2s
38or were not extensively
characterized
46,47.
Recapitulating human cDC development in vivo has the
potential to greatly improve our understanding of DC biology
and facilitate its translational applications. Human cDCs have
been found in stably reconstituted humanized mice treated
with supraphysiological concentration of human FLT3L
28,48,49.
However, the generated CD11c
+CD141
+and CD11c
+CD1c
+cells were poorly characterized and their dissemination to
per-ipheral tissues has rarely been assessed
50.
Here we aimed at modeling human cDC development by
providing physiological factors associated to hematopoietic
niches. We found that engineered mesenchymal stromal cells
(eMSCs) expressing a combination of membrane-bound FLT3L
and SCF/KITL together with CXCL12 provide a scaffold for
human cDC differentiation. Engraftment of eMSCs along with
CD34
+HSPCs leads to the local development of cDCs in
immunodeficient mice. This in vivo system recapitulates the
differentiation of not only pDCs, cDC1s, and cDC2s but also pre/
AS-DCs, and reaches an unmatched level of similarity of the
generated cDC2s with their blood counterparts.
Results
Transmembrane FLT3L drives human DC differentiation
in vitro. We hypothesized that the interaction of hematopoietic
progenitors with membrane-bound factors expressed by stromal
cells of the niche would promote the specification of the cDC
lineage.
To test this, we engineered a bone marrow-derived murine
mesenchymal cell line (MS5)
7,51to stably and homogeneously
express the transmembrane form of human FLT3L (MS5_F) as
probed by
flow cytometry (Fig.
1
a). Co-culture of MS5_F with
CD34
+HSPCs drives the appearance of cDC1-like Clec9A
+CD141
+and cDC2-like CD14
−CD1c
+cells. Importantly, MS5_F
is more efficient than recombinant soluble FLT3L (MS5 + recFL)
in generating cDC-like cells (Fig.
1
b).
In contrast, OP9
52hematogenic stromal cells stably
expres-sing membrane-bound FLT3L (OP9_F) were less efficient than
MS5_F in driving cDC differentiation (Fig.
1
c). Besides, MS5_F
also promoted the appearance of CD123
+CD303/4
+cells
resembling either pDCs or pre/AS-DCs
12,20(Supplementary
Fig. 1a, b).
Next, we wanted to test whether cell-to-cell interactions
mediate the differentiation of cDCs driven by FLT3L-expressing
MS5 stromal cells. Using transwell permeable to soluble factors
but preventing cognate interactions, we found that direct contact
is required to support efficiently cDC differentiation (Fig.
1
d).
Collectively, these data show that membrane FLT3L expression
in stromal cells provide an improved platform to trigger the
differentiation of cDC-like cells from CD34
+HSPCs in vitro via
cell-to-cell contact.
CXCL12 and SCF improve FLT3L-driven DC differentiation.
Next, we sought to improve the efficiency of cDC production in
MS5_F by co-expressing additional niche factors. We focused on
SCF, CXCL12, and TPO because of their essential role in
sup-porting HSPCs maintenance in the bone marrow niche
21,23–26,53.
SCF had also been extensively used in previously published DC
culture protocols
7,38,39,54.
To this end, we generated a collection of MS5 stromal cells
stably expressing either one, two, three, or four human factors by
combining CXCL12, TPO, and membrane-bound SCF/KITL,
with or without membrane-bound FLT3L (Supplementary
Fig. 2a).
We screened this collection of eMSC lines based on their ability
to support human cDC differentiation from cord blood-derived
CD34
+HSPCs.
At day 15, only FLT3L-expressing eMSCs successfully
supported the differentiation of CD141
+Clec9A
+and CD14
−CD1c
+cells (Fig.
2
a and Supplementary Figs. 2b and 3a). We
conclude that FLT3L is necessary for the differentiation of cDCs
using eMSCs. Besides, optimal cDC production was obtained in
a
d
55.8 43.7 DAPI– CD45+ CD14– CD16– MS5_CTRL MS5_F MS5+recFLb
c
MS5_CTRL MS5_F MS5+recFL DAPI– CD45+ CD14– CD16– 2.11 6.20 3.29 94.0 5.77 69.9 29.6*
*
Upper well Lower well CD34+ – MS5_F CD34+ – MS5_F 0 2 4 6 8 # CD141 +Clec9A + (x10 4) Upper well Lower well CD34+ – MS5_F CD34+ – MS5_F 0 2 4 6 8 % CD141 +Clec9A + (in CD45 +) Upper well Lower well CD34+ – MS5_F CD34+ – MS5_F 0 2 4 8 # CD14 –CD1c + (x10 5) Upper well Lower well CD34+ – MS5_F CD34+ – MS5_F 0 10 20 30 40 % CD14 –CD1c + (in CD45 +) 6 Upper well Lower well CD34+ – MS5_F CD34+ – MS5_F 0.0 0.5 1.0 2.5 # CD45 + (x10 6) 1.5 2.0 % CD141 +Clec9A + (in CD45 +) 0 2 4 6***
MS5_CTRL MS5_F MS5+recFL % CD14 –CD1c + (in CD45 +) 0 5 10 15 20 25**
0.0 0.5 1.0 1.5 # CD141 +Clec9A + (x10 4) 0.0 2.0 4.0 6.0 8.0 # CD14 –CD1c + (x10 4) MS5_CTRL MS5_F MS5+recFL**
*
CD141-PE-Cy7 Clec9A-PE 0 10 4 105 105 104 0 10–3 MS5_CTRL MS5_F MS5 GFP huFlt3L-APC-Cy7 0 104 105 103 0 104 105 103 103 10–3 103 CD1c-APC HLA-DR-BV510 0 10 4 105 105 104 0 10–3 103 10–3 103 0 2 4 6 8 % CD141 +Clec9A + (in CD45 +) 0 5 10 15 20 25 % CD14 –CD1c + (in CD45 +) MS5_CTRL MS5_F OP9_CTRL OP9_F 0 1 2 3 4 5 # CD45 + (x10 5) MS5_CTRL MS5_F OP9_CTRL OP9_F 0.0 0.5 1.0 1.5 2.0 2.5 # CD141 +Clec9A + (x10 4) 0 2 4 6 8 # CD14 –CD1c + (x10 4) MS5_CTRL MS5_F OP9_CTRL OP9_F*
*
*
*
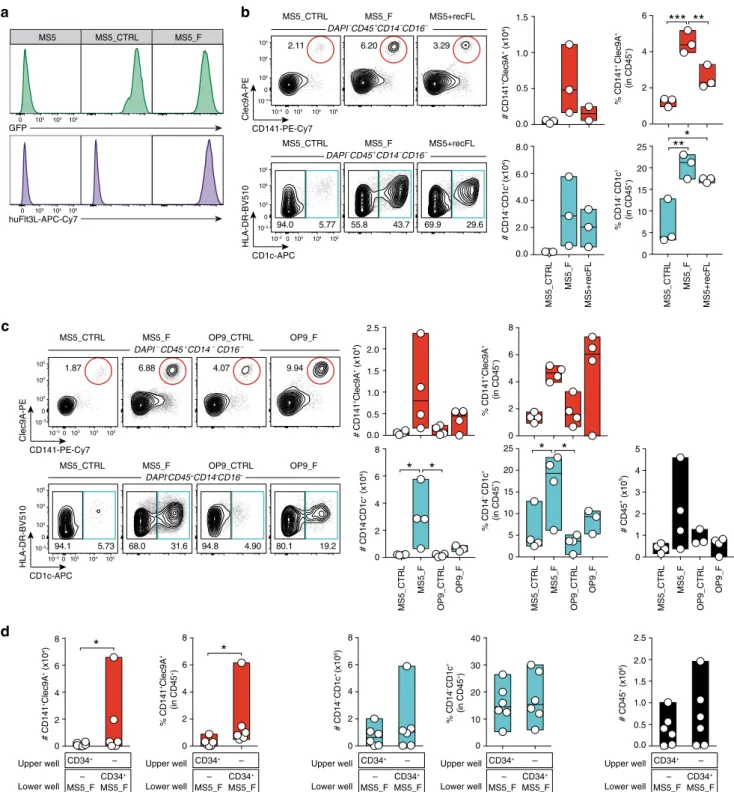
DAPI–CD45+CD14–CD16– 94.1 5.73 68.0 31.6 94.8 4.90 80.1 19.2 MS5_CTRL MS5_F OP9_CTRL OP9_F DAPI–CD45+CD14–CD16– 1.87 6.88 4.07 9.94 MS5_CTRL MS5_F OP9_CTRL OP9_F CD141-PE-Cy7 Clec9A-PE 0 10 4 105 105 104 0 10–3 103 10–3 103 CD1c-APC HLA-DR-BV510 0 10 4 105 105 104 0 10–3 103 10–3 103Fig. 1 Transmembrane FLT3L drives human DC differentiation in vitro. a Expression of membrane-bound FLT3L in mouse bone marrow-derived stromal cells engineered to express human FLT3L (MS5_F) and control (MS5_CTRL).b Human cDC subsets differentiated in vitro from CD34+cord blood-derived HSPCs cultured with MS5 expressing membrane-bound FLT3L (MS5_F) or MS5 supplemented with recombinant human FLT3L (MS5+recFL) at day 15 (n = 3 donors in one experiment). *p < 0.05, **p < 0.01, ***p < 0.001, one-way ANOVA test with Tukey’s multiple comparisons. c Representative flow cytometry plots and quantification of human cDC subsets differentiated in vitro from cord blood-derived CD34+progenitors in culture with mouse stromal cell lines MS5 and OP9 expressing human FLT3L (MS5_F and OP9_F) at day 15 (n = 4 donors in one experiment). *p < 0.05, one-way ANOVA test with Tukey’s multiple comparisons). d Absolute number and frequency of CD141+Clec9A+and CD14−CD1c+human cDCs differentiated from CD34+HSPCs in direct contact (lower well) or physically separated (upper well) from engineered MS5_F. DC differentiation was assessed at day 15 byflow cytometry (n = 6 donors in three independent experiments). *p < 0.05, two-tailed paired Student’s t-test. Data are presented as floating bars ranging from min to max and line represents median (b–d).
cultures containing eMSC co-expressing membrane-bound SCF
and CXCL12 together with FLT3L (MS5_FS12) (Fig.
2
a), whereas
no difference was observed for CD14
+CD16
−monocytes and
CD14
+CD16
+macrophages as compared to MS5_CTRL
(Sup-plementary Fig. 3b).
Furthermore, we noticed that in vitro differentiated CD14
−CD1c
+cDC2-like cells were heterogeneous for the expression of
the mannose receptor CD206 (Fig.
2
a). Circulating blood cDC2s
do not generally express CD206 (Supplementary Fig. 3c), whereas
CD206 is a marker of skin and migratory cDC2
19,55.
*
# CD141 +Clec9A + (x10 4) MS5_CTRL MS5_F MS5_FS MS5_F12 MS5_FS12 MS5_FT MS5_FST MS5_FT12 MS5_FST12 0.0 0.5 1.0 1.5a
0.0 0.5 1.0 1.5 # CD1c +CD206 – (x10 4) # CD14 –CD1c +CD206 – (x10 4) # CD14 –CD1c +CD206 + (x10 4) # CD45 + (x10 5) # CD141 +Clec9A + (x10 4) # CD1c +CD206 + (x10 4) MS5_CTRL MS5_F MS5_FS MS5_F12 MS5_FS12 MS5_FT MS5_FST MS5_FT12 MS5_FST12*
0 1 2 3 4 MS5_CTRL MS5_F MS5_FS MS5_F12 MS5_FS12 MS5_FT MS5_FST MS5_FT12 MS5_FST12b
CXCL12 SCF TPO + + + + + + + + – – – – – – – + – + – – + – – + – + + – + + + + + – + – CTRL F FS F12 FS12 FT FST FT12 FST12 Flt3Lc
0.0 0.5 1.0 1.5 2.0 2.5 MS5_FS12 Isotype α-GM-CSF + – + + + – 0.0 0.5 1.0 1.5 MS5_FS12 Isotype α-GM-CSF + – + + + – 0 1 2 3 4 MS5_FS12 Isotype α-GM-CSF + – + + + – MS5_FS12 Isotype α-GM-CSF + – + + + – 0 1 2 3 4 Clec9A PE CD141 PE-Cy7 1.46 3.78 4.53 7.33 4.28 1.61 0.56 1.25 0.76 105 104 103 0 0 103 104 105 10–3 CD14 APC CD16 BV421 76.4 13.1 9.20 74.4 13.9 9.95 68.3 17.4 12.2 75.4 11.5 10.9 78.6 7.39 11.6 81.1 9.34 7.60 67.5 18.6 11.9 79.0 5.17 14.0 69.4 18.1 10.0 105 104 103 0 0 103 104 105 HLA-DR BV510 CD1c APC 6.21 21.2 19.4 18.4 15.1 15.4 28.8 22.5 21.7 105 104 103 0 0 103 104 105 CD1a Percp-Cy5.5 CD206 PE 0 103 104 105 40.3 57.4 42.9 55.6 42.4 55.5 60.9 36.3 42.0 55.5 31.6 66.2 22.6 75.8 23.2 73.8 20.7 74.7 105 104 103 0 10–3 MS5 CD34+ – CTRL + FS12 CTRL FS12 – + 0 200 400 600 800 1000 hGM-CSF (pg/ml)Fig. 2 CXCL12 and SCF improve FLT3L-driven DC differentiation. a Representative FACS plots and absolute number of CD141+Clec9A+, CD1c+CD206−, and CD1c+CD206+cells generated from CD34+HSPCs cultured with MS5 expressing human FLT3L (MS5_F) in combination with human SCF (S), TPO (T), and CXCL12 (12). Day 15flow cytometry analysis of n = 3 cord blood donors in three independent experiments. *p < 0.05, one-way ANOVA test with Tukey’s multiple comparisons. b ELISA detecting human GM-CSF in the supernatant of CD34+HSPCs cultured with engineered MS5 expressing human FLT3L, SCF and CXCL12 (MS5_FS12) at day 15 forn = 2 (MS5_CTRL ± CD34+HSPC and MS5_FS12 only) andn = 4 (MS5_FS12 + CD34+HSPC) independent donors.c Absolute number of human DC subsets generated in vitro from CD34+HSPC using MS5_FS12 stromal cells in the presence of human GM-CSF neutralizing antibody as compared to isotype control (n = 6 independent donors in two experiments). Data are presented as floating bars ranging from min to max and line represents mediana, c or as bar graphs with mean ± SEM (b).
Most of the previously described protocols to generate
human DC-like cells in vitro from both CD14
+monocytes
and CD34
+HSPCs made an extensive use of the cytokine
GM-CSF
7,8,36,38,39,54, with one exception
47. As we did not include
GM-CSF in our protocol, we wanted to assess whether human
GM-CSF was spontaneously produced in CD34
+cultures. We
could not detect any GM-CSF from co-culture supernatant
(Fig.
2
b). Accordingly, GM-CSF-blocking antibody did not
impact the generation of cDCs driven by MS5_FS12 (Fig.
2
c).
We conclude that GM-CSF is dispensable for the generation of
cDCs in vitro, as previously reported in both mouse
56,57and
human
47.
We also observed that MS5_FS12 stromal cells significantly
improve the differentiation of CD123
+CD303/4
+cells (Fig.
3
a), a
phenotype shared by both plasmacytoid DC and pre/AS-DC
12,20.
A more refined phenotypic characterization of the in
vitro-generated cells also shows that all CD123
+cells express high
levels of CD45RA and they can be subdivided in AXL
−CD327
lo/−and AXL
+CD327
+subsets, phenotypically aligning to pDC and
pre/AS-DC (Fig.
3
b). This conclusion was further supported by
gene set enrichment analysis (GSEA)
58of RNA-sequencing
(RNA-seq) data, displaying a significant enrichment of previously
reported pDC and AS-DC gene signatures
20in in vitro-generated
AXL
−CD327
lo/−and AXL
+CD327
+, respectively (Fig.
3
c).
Moreover, only the AXL
−CD327
lo/−cells were capable to
produce type I interferon in response to toll-like receptor (TLR)
stimulation, a specific feature of bona fide pDC, which is not
shared with pre/AS-DC
12,20(Fig.
3
d).
In conclusion, we identified the combination of
membrane-bound FLT3L, SCF, and CXCL12 (MS5_FS12) as the most
efficient tested condition to support human DCs differentiation
in vitro from CD34
+HSPCs.
Human DC generated in vitro align with circulating blood DC.
To validate the identity of the cDCs generated using the
MS5_FS12 stromal niche, we compared the transcriptome
(RNA-seq) and phenotype (CyTOF) of in vitro-differentiated subsets to
circulating blood cDC1s and cDC2s (Fig.
4
a–f).
Hierarchical clustering of RNA-seq data revealed that subsets
generated in culture maintain a strong
“culture imprinting”
(Supplementary Fig. 4a). Indeed, we could identify a 2000 genes
signature (1000 genes up- and 1000 genes downregulated), which
clearly separates in vitro-generated cells from circulating blood
subsets regardless of their subset identity (Supplementary Fig. 4b).
The majority of these genes were associated to cell cycle and
metabolism as shown by pathways enrichment analysis
(Supple-mentary Fig. 4c). Nonetheless, once this
“in vitro culture
signature” was subtracted from the total protein coding genes,
CD141
+Clec9A
+and CD1c
+CD206
+/−cells generated in
culture transcriptionally align to blood cDC1 and cDC2,
respectively (Fig.
4
a).
To further validate the similarity of in vitro generated cells with
physiologically circulating subsets, we performed GSEA
58using
the BubbleGum software
59. This methodology enables to score
the enrichment of a signature in a pairwise comparison of two
transcriptomes. We scored cDC1 alignment using gene signatures
specific for blood cDC1 obtained from published datasets
(cDC1>CD1c
[+60and DC1>ALL
20). CD14
−CD1c
+cells have
recently been shown to contain two distinct subsets termed as
cDC2 and cDC3
20. Alignment of cultured cells was probed
towards total CD1c
+cells (CD1c>cDC1), cDC2 (cDC2>ALL and
cDC2>DC3), and DC3 signatures (DC3>cDC2 and DC3>ALL).
We found that in vitro-generated CD141
+Clec9A
+and CD1c
+CD206
+/−cells are enriched in genes defining circulating blood
cDC1 and cDC2, respectively (Fig.
4
b). The expression of the top
50 genes for each signature in the differentiated subsets further
supports this conclusion (Fig.
4
c). Importantly, both CD206
+and
CD206
−subsets aligned preferentially to cDC2 as compared with
DC3 and cDC1 (Fig.
4
b and Supplementary Fig. 4d). CD163 was
recently described as a marker selectively expressed in blood
cDC3 as compared with cDC2
20. Supporting our previous
conclusion, CD163 was neither expressed in CD1c
+CD206
−nor in CD1c
+CD206
+cells generated in vitro, whereas CD163
+cells were detected among CD14
+monocytes and CD14
+CD16
+macrophages (Supplementary Fig. 4e).
To obtain a more exhaustive characterization of the phenotype
of in vitro-generated subsets, we performed CyTOF analysis using
a panel of 38 metal-conjugated monoclonal antibodies.
Dimen-sion reduction of the CyTOF data was performed using the
Uniform Manifold Approximation and Projection (UMAP)
algorithm
61. UMAP plots display clusters of cells that were
expanded upon MS5_FS12 co-culture as compare to MS5_CTRL
(Fig.
4
d). Clec9A
+CD141
+cells identified by flow cytometry
were shown to also express CADM1 and CD26 further aligning
them with blood cDC1s (red cluster, Fig.
4
d–f). CD14
−CD1c
+cells did not express high level of monocyte markers such as
CD64, CD68, and CD16, whereas they appeared heterogeneous
for CD206 expression (blue cluster, Fig.
4
d–f and Supplementary
Fig. 4f). Of note, CD14
−CD1c
+cells generated in culture did not
express high level of FcεRIa, CD172a, and CD5 found in blood
cDC2s (Supplementary Fig. 4f). By contrast, they were strongly
positive for CD86 and CD80 unlike their circulating counterpart
(Supplementary Fig. 4f). In addition, CD123
+CD303
+cells were
shown to express heterogeneous levels of pre-DC markers such as
CD327 and CX3CR1, and moderate level of AXL (green cluster,
Fig.
4
d–f and Supplementary Fig. 4f), in line with flow cytometry
analysis highlighting the presence of both pDC and pre/AS-DC
within CD123
+CD303
+cells generated in vitro (Fig.
3
b). On the
other hand, by combining
flow and mass cytometry analysis, we
were able to show that MS5_FS12 stromal cells do not support
lymphoid development (Fig.
4
d and Supplementary Fig. 4g).
Indeed, the remaining cells (other than DC) present in culture
consist of CD15
+Granulocytes and CD14
+CD16
+/−Monocytes/
Macrophages (Supplementary Fig. 4h). Finally, the analysis of
in vitro cDC differentiation kinetics revealed that both cDC1 and
cDC2 can be detected in MS5_FS12 cultures as early as day7
(Supplementary Fig. 4i). However, the yield of in vitro generated
cDC was significantly higher at day14, when most of the cultures
were therefore analyzed (Supplementary Fig. 4i).
Collectively, our data demonstrate that: (i) in vitro-generated
CD141
+Clec9A
+recapitulate the phenotype of bona
fide blood
cDC1; (ii) CD14
−CD1c
+cells align to cDC2 regardless of their
CD206 expression; (iii) CD123
+CD303
+cells contain some
recently described pre-DC/AS-DC phenotypically and
function-ally distinct from pDCs. However, we identified two major
limitations of the in vitro culture. First, the culture system
imposes a strong transcriptional imprinting throughout subsets.
Second, in vitro-generated cDC2s failed to express to full
phenotypic profile of blood cDC2s.
Engineered stromal niches support HSPC maintenance in vivo.
We next wanted to assess whether we could use MS5_FS12 to
recapitulate a more physiological niche microenvironment
sup-porting human HSPCs maintenance in vivo.
To this end, we designed an experimental strategy based on
the subcutaneous injection of cord blood-derived CD34
+HSPCs together with MS5_FS12 in a basement membrane
matrix (Matrigel) in NOD.Cg-Prdc
scidIl2rg
tm1Wjl/SzJ (NSG)
a
pDC Pre/AS-DC 0 5 10 15 % in CD45 +*
*
*
0.0 1.0 2.0 3.0 # CD123 +CD303/4 + (x10 4) MS5_CTRL MS5_F MS5_FS MS5_F12 MS5_FS12 MS5_FT MS5_FST MS5_FT12 MS5_FST12b
d
MS5_FS12 14.6 0.01 85.4 0.00 9.72 0.05 89.3 0.91 + TLR NT CD45RA+ CD123+ 0.0 0.5 1.0 1.5 % IFN α + (in CD45RA +CD123 +)*
*
*
pDC pre/AS-DC pDC pre/AS-DC NT +TLR pDC Pre/AS-DCAS-DC signature (Villani et al.)
Enrichment score (ES)
–0.1 0.0 –0.2 –0.3 NES = –5.14 q = 0.0 Enriched in AS-DC –0.4 pDC Pre/AS-DC
pDC signature (Villani et al.)
Enrichment score (ES)
0.3 0.4 0.2 0.1 NES = 2.24 q = 0.0 Enriched in pDC 0.0 0.5 0.6
c
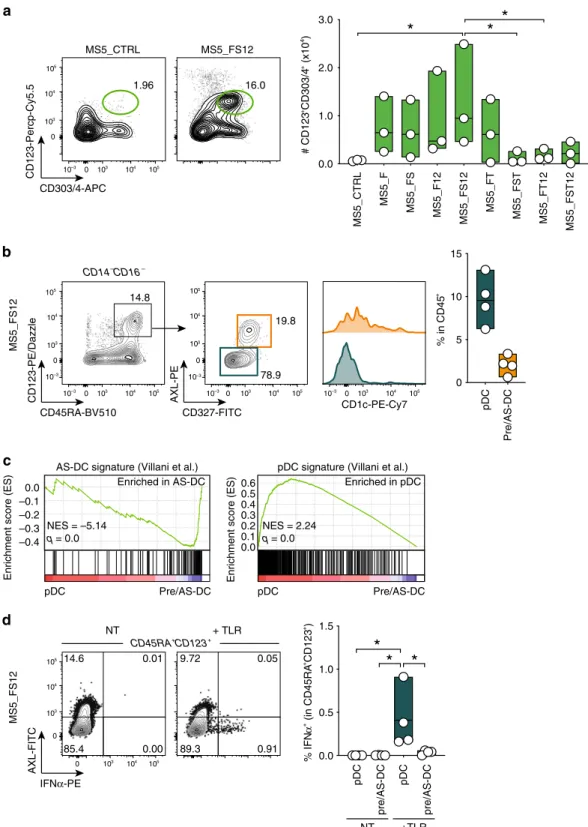
1.96 16.0 MS5_FS12 MS5_CTRL CD303/4-APC CD123-Percp-Cy5.5 0 10 3 104 105 105 104 103 10–3 0 CD45RA-BV510 CD123-PE/Dazzle CD327-FITC AXL-PE MS5_FS12 14.8 19.8 78.9 CD14– CD16– CD1c-PE-Cy7 0 103 104 105 105 104 103 10–3 0 10–3 0 103 104 105 10–3 10–3 0 103 104 105 105 104 103 0 10–3 IFNα-PE AXL-FITC 0 10 3 104 105 105 104 103 0Fig. 3 MS5_FS12 stromal cells support pDC and pre/AS-DC development in vitro. a Representative FACS plots and absolute number of CD123+CD303/ 4+cells generated in vitro from CD34+HSPCs co-cultured with MS5 expressing human FLT3L (MS5_F) in combination with human SCF (S), TPO (T), and CXCL12 (12). Day 15flow cytometry analysis of n = 3 cord blood donors in three independent experiments. *p < 0.05, one-way ANOVA test with Tukey’s multiple comparisons.b Gating strategy used to identify AXL−CD327lo/−pDC and AXL+CD327+pre/AS-DC within CD123+CD45RA+cells generated in vitro using MS5_FS12. Graph illustrates the frequency of each subset in CD45+cells (n = 4 cord blood donors). c GSEA comparing in vitro-differentiated pDC and pre/AS-DC using published human pDC and AS-DC gene signatures20(FDR false detection rate, NES normalized enrichment score). Statistical significance is defined by the FDR q-value calculated by the GSEA software (www.broad.mit.edu/gsea) using default parameters.d Intracellularflow cytometry analysis of IFNα production in pDC and pre/AS-DC in response to 16 h of TLR stimulation (lipopolysaccharide (LPS) 10 ng/ml, R848 1 μg/ml, Poly(I:C) 25μg/ml). Bar graph shows the frequency of IFNα+cells in each subset with (+TLR) or without (NT) stimulation (n = 4 cord blood donors). *p < 0.05, one-way ANOVA test with Holm–Sidak’s multiple comparisons. Data are presented as floating bars ranging from min to max and line represents median (a, b, d).
Clusters of cells embedded in Matrigel can be identified as early
as day 12 by tissue histology (Fig.
5
b). Flow cytometry analysis
demonstrated that MS5_FS12 but not MS5_CTRL induced the
expansion of human leukocytes within the Matrigel plugs
(Fig.
5
c). We then tested whether cell-to-cell interactions of
eMSC with human progenitors play a role in this process. We
injected two independent plugs of CD34
+HSPCs with either
MS5_CTRL or MS5_FS12 in the same recipient mouse
(contralateral plugs) (Fig.
5
d). We found a relative expansion of
human leukocytes in MS5_FS12 as compared to MS5_CTRL
contralateral plugs (Fig.
5
d). We conclude that MS5_FS12 does
not efficiently provide soluble factors enabling human leukocytes
a
c
d
CD14+ Myeloid cDC2 cDC1 pre/pDC LymphoidHLA-DR CD80 CD26 CADM1 CD206 FcER1 CD45RA CD3/CD19/CD20 CCR7 OX40L CX3CR1 LYVE1 SLAN CCR2 CD15 CD207 PDL1 CD2 Clec12A CD56 CD303 CD88 CD64 CD34
8 6 D C CD14 AXL CD172a CD11b CD33 CD163 CD16 CD5 CD327 TSLPR CD123 CD86 CD1c TOGARAM2 cDC1 CD206 – cDC2 CD206 + cDC2 ACTA2 CACNA2D3 CFP FCER1A CD1C CLEC10A EVI5 CD2 CD33 FCGR2B ADAP1 FCRLB EFNB1 ARSA CD1A DHRS9 JAML CD1B LAMP5 CD1E CLEC4A KCTD5 CCP110 DAGLB EAF2 ITPR1 FXYD5 GYPE ITGAX CPED1 CAPN3 JUP FGD4 NAA38 ACOT11 ATP6V0A1 EPB41L2 CHD3 CRYZL1 DENND1A CTSW NRROS CREB3L2 MTMR11 GAS2L1 LAYN C1orf228 FCGBP MYO5C MYO1A Blood CD1c
+ signature (top 50 genes)
cDC1 CD206 – cDC2 CD206 + cDC2 AP3M2 COX15 GFOD1 ERICH5 CCDC127 ANO9 CTNND2 DPP4 ARHGAP12 ROMO1 CDK2AP2 CSRP1 BANF1 C1orf21 CCND1 LACC1 BCL6 FAM160A2 APOL2 CDK2AP1 CIART ENOX1 APOL3 RUBCNL CD226 BTLA C1orf115 DBN1 CADM1 APOL1 DYSF FAM102A C10orf105 C1orf186 CBL EIF5B BIK MCUR1 CAMK2D CYYR1 CLNK CLEC9A ENPP1 C1orf54 CLEC4C DSTN CASP2 ACTL10
Blood DC1 signature (top 50 genes)
CYB5R3
Relative gene expression Max row Min row Mean intensity 441 0 cDC1 vs. CD206– cDC2 cDC1 vs. CD206+ cDC2 CD206– cDC2 vs. CD206+ cDC2 cDC1>CD1c + (173) cDC1>ALL (112) CD1c +>cDC1 (116) cDC2>ALL (31) cDC2>DC3 (48) DC3>cDC2 (92) DC3>ALL (59) <0.005 <0.05 <0.25 (>0.5)NS 1.7 1.4 1.2 1.0 Color intensity = FDR Circle area = NES
Enriched in 1st class Enriched in 2nd class
b
Enrichment score (ES)
–0.2 0.0 –0.4 –0.6 CD1c+>cDC1 signature cDC1 CD206– cDC2
Enrichment score (ES)
0.4 0.6 0.2 0.0 cDC1>CD1c+ signature cDC1 CD206– cDC2 NES = 1.51 q = 0.0 CD206– cDC2 CD206+ cDC2 CD1c+>cDC1 signature
Enrichment score (ES)
0.0 0.2 –0.2 –0.4 NES = –0.97 q = 0.50 Not enriched Enriched in cDC1 NES = 1.38 q = 0.014 Enriched in cDC2 CADM1 0 39 CD1c 0 189 CD26 0 62 CD206 0 19 CD14 0 267 CD88 0 194 CD123 0 56 AXL 0 28 UMAP2 UMAP1 MS5_FS12
e
f
Blood cDC1 MS5_FS12 cDC1 Blood cDC2 MS5_FS12 CD206 – cDC2 MS5_FS12 CD206 + cDC2 17791 genes Gene signature UMAP2 UMAP1 MS5_CTRL CD14+ cells cDC2 cDC1 Myeloid Pre/pDC Lympoid MS5_FS12 UMAP2 UMAP1 CD14+ cells cDC2 cDC1 Myeloid Pre/pDC Lympoid Cord blood UMAP2 UMAP1 CD14+ cells cDC2 cDC1 Myeloid Pre/pDC Lympoid % in CD45 +HLA-DR + 66.5% 4.83% 3.16% 24.3% 48.0% 33.2% 8.51% 2.76% 3.82% 80.2% 11.1% 2.56% 3.06%0.85%expansion
systemically.
Therefore,
we
hypothesized
that
membrane-bound FLT3L and SCF together with CXCL12 define
an efficient in vivo niche by delivering cell-to-cell contacts
supporting HSPCs expansion. Supporting this hypothesis, we
found that MS5_FS12 expressing GFP persist in the plugs at day
12 of differentiation (Fig.
5
e). Immunofluorescence analysis
further supported this observation and demonstrated the
existence of cell-to-cell contact between MS5_FS12 and human
CD45
+leukocytes (Fig.
5
e and Supplementary Fig. 5a).
Leuko-cytes expressing CD34
+could also be detected, supporting the
notion that a pool of undifferentiated progenitors is maintained
in the MS5_FS12 organoids at day 12 (Fig.
5
e). Of note, Matrigel
plugs contained mouse CD31
+cells, suggesting undergoing
vascularization as evidenced by the formation of early tube-like
structure (Fig.
5
f). However, no vascular leak was observed,
as demonstrated by the absence of intravenously delivered
CTV
+CD3
+cells in the subcutaneous plug (Supplementary
Fig. 5b).
Taken together, these data show that engineered stromal cells
MS5_FS12 provide a minimal synthetic niche scaffold supporting
human CD34
+HSPCs maintenance and expansion in vivo.
The MS5_FS12 niche supports human DC development
in vivo. We investigated whether the engraftment of CD34
+HSPCs together with MS5_FS12 could lead to the local
differ-entiation of human DC subsets.
Flow cytometry analysis of Matrigel organoids demonstrates
that the MS5_FS12 but not the MS5_CTRL niche specifically
supports the differentiation of CD141
+Clec9A
+cDC1-like cells
and CD14
−CD1c
+cDC2-like cells (Fig.
6
a and Supplementary
Fig. 6a). This
finding was supported by immunofluorescence
staining on plug sections highlighting the occurrence of human
CD45 cells expressing either Clec9A or CD1c (Fig.
6
b).
Further analysis revealed the expansion of CD123
+CD303/4
+cells in MS5_FS12 when compared to MS5_CTRL plugs (Fig.
6
c and
Supplementary Fig. 6a). All these cells also expressed CD45RA and
heterogeneous levels of AXL and CD327, as previously described for
their in vitro counterparts (Fig.
6
c). However, only MS5_FS12
induced a strong accumulation of AXL
+CD327
+pre/AS-DC
expressing various levels of CD1c (Fig.
6
c). In addition, bona
fide CD123
+CD45RA
+AXL
−CD327
lo/-pDCs could also be
detected (Fig.
6
c). RNA-seq analysis of in vivo-generated CD123
+AXL
−CD327
lo/−and CD123
+AXL
+CD327
+cells further support
this conclusion and unequivocally align them to blood circulating
pDC and AS-DC, respectively (Fig.
6
d).
To further refine the phenotypic characterization of HLA-DR
+mononuclear phagocytes in MS5_FS12 organoids we performed
high-dimensional mass cytometry analysis. The comparison of
MS5_FS12 with MS5_CTRL plugs highlighted the expansion of
all subsets previously identified by flow cytometry: cDC1s, cDC2s,
pre/AS-DCs, pDCs, and a distinct population of CD33
+CCR2
+CX3CR1
+Clec12A
+myeloid cells (Fig.
6
e and
Supple-mentary Fig. 6b). We next wanted to determine whether
commitment towards the cDC lineage would be dependent on
local developmental cues and possibly cell-to-cell contact between
CD34
+HSPCs and MS5_FS12. To this end, we engrafted mice
with two distal organoids, one containing MS5_CTRL and the
second one containing MS5_FS12. We found that cDC1, cDC2,
and pre/AS-DCs were selectively expanded in MS5_FS12 plugs
(Fig.
6
f and Supplementary Fig. 6c). On the contrary, pDC were
not significantly increased in the same comparison (Fig.
6
f and
Supplementary Fig. 6c). We conclude that local cues associated to
the MS5_FS12 niche control cDC lineage commitment. In
support of this view, we could not detect a systemic increase in
the levels of serum FLT3L in mice carrying engineered stromal
cell plugs (Fig.
6
g). Accordingly, spleen resident murine cDCs did
not expand upon MS5_FS12 engraftment, while they massively
do so upon administration of recombinant soluble human FLT3L
(Fig.
6
g). Together with the two-plugs experiments (Fig.
6
f), these
observations suggest that most of the FLT3L aegis relies on its
membrane-bound form delivered in the context of eMSCs. Of
note, administration of recombinant soluble FLT3L was poorly
efficient at expanding human DCs populations in Matrigel
organoids formed with control stromal cells (Fig.
6
g). This
demonstrates the superiority of local, cell-associated cues (i.e.,
MS5_FS12) to achieve the expansion of human cDCs in the
dermis of NSG mice.
A more extensive characterization of MS5_FS12 organoids
revealed the presence of myeloid lineages other than DCs, such as
CD14
+CD16
−monocyte-like cells and CD15
+granulocytes
(Fig.
6
h and Supplementary Fig. 6d). Conversely, no lymphoid
specification was observed (Fig.
6
h and Supplementary Fig. 6d).
Despite this broad spectrum of lineages, CD34
+HSPCs
represented the most abundant population at day 12 (Fig.
6
h).
This observation suggests that the MS5_FS12 niche combines
HSPC maintenance with lineage commitment.
cDC2 generated in vivo faithfully align to blood cDC2. Finally,
we wanted to establish whether in vivo differentiated DCs in
MS5_FS12 organoids had a distinct phenotype from the subsets
generated in vitro in MS5_FS12 co-culture.
UMAP plots of CyTOF analysis revealed three major
findings.
First, pre/AS-DCs represent a more abundant population in vivo
(Fig.
7
a and Supplementary Fig. 7a). Second, both cDC1 generated
in vitro and in vivo fully align phenotypically, displaying a strong
expression of CADM1 and CD26 (Fig.
7
a and Supplementary
Fig. 7a). Third, unlike cDC1, cDC2 generated in vivo exhibit
noticeable phenotypic differences. In vivo-generated cDC2 express
Fig. 4 Human DC generated in vitro align with circulating blood DC. a Hierarchical clustering of primary (n = 3 healthy donors) vs. in vitro-generated (n = 3 cord blood donors) cDCs based on 17,791 genes after removing the “in vitro culture signature” (2000 genes) defined by pairwise comparison of primary versus in vitro generated subsets.b GSEA using blood cDC1s (DC1>CD1c+) and CD1c+cells (CD1c+>DC1) signatures generated from published datasets60, as well as previously published signatures of blood cDC1 (DC1>ALL), cDC2 (DC2>ALL), and cDC3 (DC3>ALL)20. BubbleMap shows the enrichment of each gene signature in the pairwise comparison of CD141+Clec9A+, CD1c+CD206−, and CD1c+CD206+cells generated in vitro (FDR false detection rate, NES normalized enrichment score). For single pairwise comparisons (top), statistical significance is defined by the FDR q-value calculated by the GSEA software (www.broad.mit.edu/gsea) using default parameters. For multiple pairwise comparisons (bottom), the statistical significance was further corrected for multiple testing by the BubbleMap module of BubbleGUM software.c Heatmaps of RNA-seq data displaying the expression of the top 50 genes of blood cDC1 and CD1c+cells signatures in CD141+Clec9A+, CD1c+CD206−, and CD1c+CD206+cells generated in vitro. Genes shared with previously published signatures20are highlighted in bold.d UMAP (Uniform Manifold Approximation and Projection) plots of CyTOF data from CD45+HLA-DR+cells differentiated in vitro using MS5_FS12 and MS5_CTRL as compared with cord blood PBMCs. Pie charts indicate the frequency of each subset among the CD45+HLA-DR+cells (mean ofn = 2 cord blood donors in two independent experiments). e Relative expression of selected markers in UMAP plots of CyTOF data from cells differentiated in vitro with MS5_FS12.f Heatmap of markers mean intensity in each subset identified in MS5_FS12 cultures.
higher levels of FcεRIa, CD172a, and CD5, while showing lower
expression of HLA-DR and CD86 (Fig.
7
b and Supplementary
Fig. 7b). The specific phenotype conferred by the MS5_FS12 niche
education renders cDC2s more akin to their blood counterparts.
In order to compare extensively the transcriptional landscape of
in vivo (NSG organoids) generated DCs with primary DCs found
in human blood, we performed RNA-seq analysis on
fluorescence-activated cell sorting (FACS)-sorted cDC2s obtained after the
enzymatic digestion of MS5_FS12-containing plugs or purified
from human blood.
As previously observed for in vitro-generated cells, the
MS5_FS12 niche confers an in vivo imprinting resulting in the
differential expression of 2872 genes (up- or downregulated) in
in vivo versus ex vivo-isolated subsets (Supplementary Fig. 7c).
a
Matrigel plug Muscle Muscle Matrigel plug Skinb
c
d
f
FACS Matrigel plughuCD45 muCD31 Hoechst
100 μm
huCD45 muCD31 Hoechst
50 μm 100 μm
MS5_FS12huCD45
Hoechst huCD34 MS5_FS12huCD45
20 μm
e
MS5_FS12 NSG MS5 CTRL FS12MS5 12 days MS5_CTRL Cord blood CD34+ HSPCs 0 1 2 3 4 # huCD45 + (x10 5) p = 0.21 p = 0.07 MS5_CTRL MS5_FS12 0 20 40 60 80 % huCD45 + (in live ) MS5_CTRL MS5_FS12 100 0.08 65.8 82.6 MS5_CTRL MS5_FS12 No CD34+ 0 2 4 6 8 10 # of human CD45 + (x10 4)**
MS5_CTRL MS5_FS12 0 20 40 60 80 100 % huCD45 + (in live) MS5_CTRL MS5_FS12**
0 103 104 105 105 104 103 10–3 0 muCD45-Percp-Cy5.5 huCD45-APC-Cy7 10 –3 MS5_FST12 1.99 3.12 0 103 104 105 105 104 103 10–2 0 muCD45-APC-Cy7 muCD31-FITC 10 –3 MS5_FS12 0.0 0.5 1.0 1.5 2.0 2.5 % in live cell s 1.06 MS5_FS12 0 103 104 105 105 104 103 10–3 0 GFP huCD45-APC-Cy7 500 μm 250 μm 12 days NSG NSG Cord blood CD34+ HSCPs MS5_CTRL MS5_FS12 NSGPathway analysis revealed that this in vivo bias was mainly due to
upregulation of genes associated with DNA replication, cell cycle
and proliferation (MYC, CDC6/7, POLA2, MCM6/7)
(Supple-mentary Fig. 7c and Supple(Supple-mentary Table 8).
Moreover, we found that: (i) AXL
+Siglec6
+pre/AS-DCs
generated in vivo (or in vitro) align to their primary counterparts
and selectively express a signature that distinguish them from
bona
fide pDCs (DAB2, CD22, ADLH2) (Fig.
7
c). (ii) conversely,
AXL
−Siglec6
−bona
fide pDCs generated in vivo (or in vitro)
align to their primary counterparts and express high levels of
markers distinguishing them from pre/AS-DCs (IRF7, GZMB,
TCF4, BCL11A) (Fig.
7
c). (iii) cDC2s generated in vivo (in NSG
mice organoids carrying MS5_FS12) had higher levels of
similarity with blood cDC2s (including higher expression of
BTLA, FCER1A) (Figs.
7
b, d, e). Recently, both CD5
+and CD5
−cDC2s subsets have been reported in human blood
62,63and we
found that in vivo generated cDC2s aligned particularly well with
blood CD5
+cDC2s (with the expression of CD5, CD2) (Figs.
7
b,
e). By contrast, in vitro-generated cDC2s expressed high levels of
activation genes such MHC molecules (HLA-DR, DQ),
co-stimulatory molecules (CD80, CD40), activation markers (ETS2,
CCR6, CCR7, CXCL13, CCL22) (Figs.
7
e, f) and genes associated
with type I and type II interferon pathways (STAT1, IRF9, IGS15,
GBP1) (Supplementary Fig. 7d and Supplementary Table 9).
All together, we conclude that MS5_FS12-containing organoids
provide a unique scaffold for the specification and commitment
of the DC lineage. This unique and versatile system bypasses the
limitation of in vitro cultures, which generated inefficiently pre/
AS-DCs and biased the differentiation of cDC2s toward an
activated phenotype. Collectively, MS5_FS12 organoids faithfully
recapitulate the differentiation of not only pDCs, cDC1s, and
cDC2s but also pre/AS-DCs, and support the development of
cDC2s displaying an unattained level of similarity with their
human blood counterparts.
In vitro and in vivo cDC2 functionally align to blood cDC2. In
the last set of experiments, we aimed at functionally validate cord
blood-derived cDC generated in the MS5_FS12 stromal niche.
Moreover, we also assessed whether the phenotypic differences
observed in cDC2 generated in vitro and in vivo may impact their
function.
We
first confirmed in vitro the responsiveness of cord
blood-derived cDC2 to TLR agonists expressed in human circulating
cDC2, as demonstrated by the upregulation of maturation
markers (i.e., HLA-DR, CD86, and CD83) in response to TLR4
(LPS) and TLR8 (VTX-2337) stimulation (Fig.
8
a). We then
performed a mixed lymphocyte reaction (MLR) by co-culturing
CTV-labeled allogeneic naive T cells together with FACS-sorted
cDC subsets (Supplementary Fig. 8a) activated overnight with a
TLR agonists cocktail comprising of LPS (TLR4), R848 (TLR7/8)
and Poly(I:C) (TLR3). After 7 days of culture, we observed that
both in vitro and in vivo-generated cDC2 and pre/AS-DC were
capable to efficiently induce CD4
+naive T-cell proliferation
(Fig.
8
b), as expected and reported for circulating blood
cDC2
12,20(Supplementary Fig. 8b). Conversely, pDC were
significantly less effective on triggering T-cell activation, as
shown by the consistent reduction in the frequency of dividing
CD4
+T cells when compared with cDC2 and pre/AS-DC
(Fig.
8
b).
Importantly, only cDC2 were able to produce high amounts of
T-cell-polarizing cytokines in response to TLR stimulation, as
demonstrated by intracellular TNFα and IL-12 detection by flow
cytometry (Fig.
8
c). All these features demonstrate that cDC2s,
pDCs and pre/AS-DCs functionally align to their in vivo
counterparts as previously described in the literature
12,20.
Collectively, our data suggest that: (i) both in vitro and in vivo
differentiated cDC2 are equally capable to induce CD4
+T cells
activation and produce large amounts of TNF-α and IL-12; (ii)
pre/AS-DC are as efficient as cDC2 in activating allogeneic naive
CD4+ T cells in vitro, a distinctive feature that clearly separate
them from the pDC lineage; (iii) despite their ability to induce
CD4
+T-cell proliferation in MLR settings, pre/AS-DC do not
produce high levels of cytokines commonly associated with cDC2
function, such as TNF-α or IL-12.
Discussion
Over the last two decades, DC-based strategies have been
pro-posed for the therapeutic vaccination against cancer, including (i)
non-targeted protein-based vaccines captured by DCs in vivo, (ii)
specific targeting of DC subsets with mAb coupled to tumor
antigens
64and (iii) antigen loading of ex-vivo-generated DCs
3. In
this context, experimental models recapitulating the development
of human DC subsets are crucially needed.
Here we describe a novel approach to model human DC
development from CD34
+HSPCs both in vitro and in vivo. To
this end, we primarily focused on the physiological niches where
human DCs differentiate and maintain: a central bone marrow
niche where DC progenitors are specified and peripheral niches
in the lymph nodes where DCs reside.
Previous studies have shown that the cell-to-cell interaction
with membrane-bound factors expressed by the niche
micro-environment plays an essential role in HSPCs maintenance and
expansion
21,22,65,66. Alternative splicing of human and murine
SCF transcript results in the synthesis of both a soluble and a
membrane-bound non-cleavable form of the protein.
Interest-ingly, the secreted form of SCF/KITLG is not sufficient for the
Fig. 5 Engineered stromal niches support HSPC maintenance in vivo. a Experimental strategy for an in vivo synthetic niche. Human HSPCs were injected subcutaneously along with MS5_FS12 in a basement membrane matrix (Matrigel) preparation.b Hematoxylin–eosin staining of subcutaneous organoids at day 12. Arrows show clusters of Matrigel-embedded cells. Scale bar represents 500μm (left) and 250 μm (right). c Flow cytometry analysis at day 12 of Matrigel organoids containing either MS5_CTRL or MS5_FS12 cells. Absolute number and frequency of human CD45+cells recovered are summarized in bar graphs (n = 13 cord blood donors in 6 independent experiments; **p < 0.01, two-tailed paired Student’s t-test). d Experimental strategy and quantification of human CD45+cells recovered from physically separated plugs containing either MS5_CTRL or MS5_FS12 cells injected in the same recipient (n = 3 cord blood donors in one experiment; two-tailed paired Student’s t-test). e Immunofluorescence staining of plug sections displaying the interaction of GFP+MS5_FS12 (green) with human CD45+cells (red). Human hematopoietic progenitors were also identified as CD45+(red) CD34+ (blue) cells in MS5_FS12 plugs. Nuclei were stained with Hoechst (blue). Arrows show interaction of human CD45+leukocytes with GFP+MS5_FS12. Scale bar represents 100μm (left panel) and 20 μm (right panel). Similar results were observed in n = 5 Matrigel organoids. The presence of GFP+stromal cells in Matrigel organoids at day 12 was further confirmed by flow cytometry (n = 15 independent organoids). f Visualization of mouse CD31+endothelial cells by immunofluorescence. Fixed sections were stained for human CD45 (green) and mouse CD31 (red). Nuclei were stained with Hoechst (blue). Scale bar represents 100μm (left panel) and 50 μm (right panel). Similar results were observed in n = 5 Matrigel organoids. The presence of mouse CD31+cells was further confirmed by flow cytomery. Data are presented as floating bars ranging from min to max and line represents median (c, d) or scatter plots with mean ± SEM (e).
establishment of a functional niche in murine bone marrow
21,22,
whereas the expression of human membrane-bound SCF is
suf-ficient to support human myeloid development in humanized
mice
66. We therefore wanted to test whether a similar
relation-ship might exist between the soluble and membrane-bound forms
of human FLT3L. Consistent with this hypothesis, the expression
of transmembrane FLT3L in mesenchymal stromal cells (MS5_F)
improved the efficiency of DC differentiation in vitro, as
com-pared to its soluble form (MS5
+ recFL). Moreover, the
engraft-ment of distal organoids (MS5_CTRL vs. MS5_FS12) together
with the comparison of local (membrane-bound) vs. systemic
(soluble) delivery of human FLT3L in vivo, supported the notion
a
b
50 μm huCD45 Clec9A Hoechst 50 μm huCD45 CD1c Hoechst 49.1 5.63 7.80 2.06 huCD45+CD16–CD14– MS5 CTRL MS5 FS12 0 2 4 6 8 % CD141 +Clec9A + (in CD45 +) MS5_CTRL MS5_FS12**
0 10 20 30 40 % CD1c +CD206 – (in CD45 +) MS5_CTRL MS5_FS12****
c
MS5 CTRL MS5 FS12 10 20 30 % CD123 +CD303/4 + (in CD45 +) MS5_CTRL MS5_FS12 0 p = 0.06 0 5 10 15 20 % AXL +CD327 + (in CD45 +) MS5_CTRL MS5_FS12*
0 50 100 % in CD123 +CD45RA + pDC Pre/AS-DC MS5_FS12 0 10 20 30 40 % in CD45 + CD34 + (n = 3) CD1c +CD206 – (n = 16) CD15 + (n = 8) CD123 +CD303/4 + (n = 16) CD14 +CD16 – (n = 16) CD141 +Clec9A + (n = 16) CD19 + (n = 3) CD3 + (n = 3) CD14 +CD16 + (n = 16)h
e
UMAP2 UMAP1 MS5_CTRL MS5_FS12 UMAP2 UMAP1 Other myeloid cDC2 cDC1 Pre/AS-DC pDC CD34+ % in CD45 +HLA-DR + 51.9% 28.9% 6.14% 3.78% 2.36%3.40% 78.3% 5.43% 2.17% 10.9% Pre/AS-DC CD34+ cDC2 cDC1 pDC Myeloid Pre/AS-DC CD34+ cDC2 cDC1 pDC Myeloidf
0 2 4 6 8 10 0 10 20 30 40 0 5 10 15 0 2 4 6 0 5 10 15 20 % CD141 +Clec9A + (in live)*
% CD1c + (in live )*
ns % CD123 +CD45RA +AXL – (in live) MS5_CTRL MS5_FS12*
% CD123 +CD45RA +AXL + (in live) MS5_CTRL MS5_FS12 MS5_CTRL MS5_FS12 % CD123 +CD45RA + (in live) ns% of mpDC (in live cells) % of hupDC (in CD45+) 0 5 10 15 20 0 2 4 6 8 10 0 10 20 30 40 50 0 5 10 15 0 5 10 15 0 2 4 6 8
% of mDC1 (in live cells)
% of mDC2 (in live cells) % of huDC1 (in CD45+) % of huDC2 (in CD45+)
*
*
*
*
**
*
**
*
*
*
**
*
Subcutaneous plug Spleen Serum
huFLT3L (pg/ml)
*
*
0 50 100 150 200 250 MS5_FS12 MS5_CTRL + recFL (30ug) MS5_CTRL MS5_FS12 MS5_CTRL + recFL (30ug) MS5_CTRL MS5_FS12 MS5_CTRL + recFL (30ug) MS5_CTRLg
d
pDC Pre/AS-DCAS-DC signature (Villani et al.)
Enrichment score (ES)
–0.1 0.0 –0.2 –0.3 NES = –3.03 q = 0.0 Enriched in AS-DC –0.4 pDC Pre/AS-DC
pDC signature (Villani et al.)
Enrichment score (ES)
0.3 0.4 0.2 0.1 NES = 2.11 q = 0.0 Enriched in pDC 0.0 0.5 0.6 –0.5 –0.6 CD141-PE-Cy7 Clec9A-PE 0 104 105 105 104 0 10–4 CD206-PE CD1c-FITC 0 104 105 105 104 0 10–3 103 13.7 10.5 CD14–CD16– CD303/4-APC CD123-FITC 0 10 4 105 105 104 0 10–3 103 10–3 103 19.6 79.1 CD14–CD16– CD1c-PE-Cy7 23.4 MS5_FS12 CD45RA-BV510 CD123-PE/Dazzle 0 10 4 105 105 104 0 10–3 103 10–3 103 CD327-FITC AXL-PE 0 10 4 105 105 104 0 10–3 103 10–3 103 10–30 103 104 105
that cell-associated FLT3L delivered by engineered stromal cells
significantly improves the development of human DCs in
NSG mice.
Several protocols have been proposed for the in vitro
differ-entiation of human cDCs from CD34
+HSPCs
7,37–39,46,47.
In vitro-differentiated cDC1s have been shown to fully
recapi-tulate both the phenotype and function of circulating bona
fide
blood cDC1s
8,38,46,47including high levels of IRF8 expression and
Batf3-dependency in vitro
13, as well as IRF8-dependancy both
in vivo
67and in vitro
46. Conversely, several aspects have limited
an exhaustive validation of in vitro generated CD1c
+cDC2-like
cells such as the expression of CD14
7, the transcriptional
align-ment with monocyte-derived DCs
38or the lack of a
high-dimensional phenotypic characterization
46,47.
Here we described a system (MS5_FS12), which efficiently
supports the differentiation of both CD141
+Clec9A
+cDC1s and
CD14
−CD1c
+cDC2s. However, cDC2s generated in MS5_FS12
cultures only partially recapitulate the phenotype of circulating
blood cDC2s, as suggested by the lack of expression of
cDC2-specific markers such as FcεRIa and CD5. Nevertheless,
engi-neered MSCs display the unique advantage of being suitable for
in vivo applications.
Immunodeficient mice provide a unique system to model the
onset of human immune responses in realistic settings
68.
How-ever, a reliable method to achieve the differentiation of human
DCs in vivo has not been described, yet. Current protocols rely on
the engraftment of human CD34
+HSPCs in sub-lethally
irra-diated immunodeficient mice (humanized mice). This strategy
has not been successful in the generation of well-characterized
circulating DC subsets
68. Administration of supraphysiological
levels of recombinant FLT3L has been shown to stimulate cDC
differentiation upon reconstitution of NSG
28,48or Flt3
−/−BRGS
49mice with human CD34
+HSPCs. However, the
phe-notype of CD141
+cDC1s and CD1c
+cDC2s was poorly
char-acterized and, despite exceptions
50, tissue DCs were not generally
investigated. These aspects represent an important limitation by
precluding, for instance, the modeling of skin vaccination.
Alternatively, transgenic mice expressing human GM-CSF and
IL-3 (in the presence or absence of human SCF), either
constitutively
69,70or by replacing their murine counterparts
(knock-in)
71, have been generated. Despite displaying higher
levels of myeloid reconstitution, as well as the presence of human
alveolar macrophages in the lungs of humanized mice
71, this
approach did not improve the development of human cDCs in
lymphoid and non-lymphoid tissues of engrafted animals.
We demonstrated that MS5_FS12 support the differentiation of
human cDCs in vivo in subcutaneous organoids in NSG mice.
High-dimensional mass cytometry (Cytof) and transcriptomic
(RNA-seq) analysis of in vivo generated cells confirmed their
phenotypic and transcriptional alignment to circulating blood
cDC1s and cDC2s. More importantly, cDC2s generated in vivo
better resemble their physiologically circulating counterparts by
expressing higher levels of FcεRIa, CD172a, CD5, CD2, and
BTLA when compared to in vitro differentiated cells. The lower
expression of activation markers such as CD86, CD80 and MHC
molecules also suggests that in vivo cDC2s displayed a less mature
phenotype than in vitro-generated cells.
Moreover, MS5_FS12 niche was capable of supporting the local
maintenance and expansion of human HSPCs as well as
pre/AS-DCs, resulting in the persistence of a long-lasting source of
progenitors capable of undergoing DC differentiation. To our
knowledge, this is the
first time that a well-characterized system
supporting the development of human pre/AS-DC is reported.
Collectively, we have demonstrated that the engineered stromal
cells MS5_FS12 give rise to a synthetic hematopoietic niche when
injected subcutaneously in NSG mice. The niche
microenviron-ment efficiently supports the expansion of CD34
+HSPCs and
human DCs subsets (cDC1, cDC2, and pre/AS-DC) can be
detected as early as day 12 in a radiation-free environment.
Importantly, in vitro culture system imposes a certain level of
spontaneous activation that is not found in primary circulating
blood DCs. Differentiation of human cDCs within humanized
mice limit this phenomenon to a level closer to the maturation
state of circulating primary cDCs. Hence, this approach
repre-sents a versatile system to study human DC development and
function in vivo.
Methods
Mice. All in vivo experiments were performed using NOD.Cg-PrdcscidIl2rgtm1Wjl/
SzJ (NSG) mice (JAX #005557). All mice were used between 8 and 12 weeks of age. They were maintained in specific-pathogen-free conditions and handled according to protocols approved by the UK Home Office.
Generation of engineered MSCs. Human FLT3L, SCF, and TPO were amplified by PCR from cDNA expression plasmids (Origene) and cloned into pMX retroviral vectors (vectors details in Supplementary Table 1). Lentiviral vector pBABE-puro-SDF-1 alpha was a gift from Bob Weinberg (Addgene plasmid #12270)72. Viral
particles were generated using the retroviral packaging plasmid pCL-Ampho and a second generation lentiviral packaging system (psPAX2 and pMD2.G), respec-tively. MS5 cells werefirst transduced with CXCL12 lentiviral vector and selected using 15μg/ml of Puromycin (Thermo Fisher). Then, a combination of single or multiple cytokines were used to transduce MS5 cells as illustrated in
Fig. 6 The MS5_FS12 niche supports human DC development in vivo. a Flow cytometry of Matrigel organoids containing either MS5_CTRL or MS5_FS12. Graphs show frequency of cDC1 and cDC2 within CD45+cells (n = 14 donors in 6 independent experiments). **p < 0.01 ****p < 0.0001, two-tailed paired Student’s t-test. b Immunofluorescence of MS5_FS12 organoids sections stained for huCD45+(green) and Clec9A+(red) or and CD1c+(red). Nuclei stained with Hoechst (blue). Scale bar= 50 μm (n = 2 Matrigel organoids). c Left: Flow cytometry and quantification of CD123+CD303/4+cells in MS5_CTRL and MS5_FS12 organoids (n = 14 donors in 6 independent experiments. Two-tailed paired Student’s t-test). Middle: Gating strategy discriminating AXL−CD327lo/−pDC and AXL+CD327+pre/AS-DC within CD123+CD45RA+cells in MS5_FS12 organoids. Bar graph illustrates frequency of each subset within CD123+CD45RA+cells (n = 4 donors). Right: Frequency of pre/AS-DC within CD45+cells in MS5_CTRL vs. MS5_FS12 organoids (n = 7 donors in 4 independent experiments). *p < 0.05, two-tailed paired Student’s t-test. d GSEA of pDC and pre/AS-DC using published gene signatures20. Statistical significance defined by the FDR q-value calculated by GSEA software (www.broad.mit.edu/gsea) using default parameters. e CyTOF analysis comparing CD45+HLA-DR+cells in MS5_FS12 and MS5_CTRL organoids. Pie charts display frequency within CD45+HLA-DR+cells (mean ofn = 2 donors in 2 independent experiments). f Frequency of cDC1, cDC2, pDC, pre/AS-DC and total CD123+CD45RA+cells recovered from physically separated plugs containing either MS5_CTRL or MS5_FS12 in the same recipient (n = 3 donors in one experiment). *p < 0.05, two-tailed paired Student’s t-test. g NSG mice injected subcutaneously either with MS5_CTRL or MS5_FS12 stromal cells. Human recombinant FLT3L administered intra-peritoneum to mice bearing MS5_CTRL plugs (10μg/mouse/injection) (MS5_CTRL+recFL). Frequency of human cDC1, cDC2, and pDC in subcutaneous organoids (left) and murine cDC1, cDC2 and pDC in the spleen (center) were reported. Circulating recombinant FLT3L levels were measured by ELISA (right).n = 4 mice/group in 2 independent experiments. *p < 0.05, **p < 0.01, one-way ANOVA test with Dunnett’s T3 multiple comparisons. h Frequency of differentiated subsets within huCD45+cells in MS5_FS12 plugs at day 12. The number of biological replicates (n) is reported. Data presented as floating bars ranging from min to max and line represents median (a, c, f, h) or as bar graphs with mean ± SEM (c, g).
Relative gene expression Max row Min row
Relative gene expression Max row Min row ETS2 CLEC17A FCGR2B ENTPD1 CCR6 CD1E PTAFR CLEC4A C10ORF128 MBOAT7 ADAM8 CD1D SLC2A3 CLEC10A PID1 FCER1A NR4A2 CLIC2 NOD2 PEA15 PER1 AREG CD1C CD33 PTGS1 ITGA5 CACNA2D3 CD2 CREB5
a
UMAP1 UMAP2UMAP1 CADM1 0 42 0CD14222 0AXL184 CD1230 83 0CD34208 CADM1 0 42 CD34 0 208 CD123 0 83 AXL 0 184 CD14 0 222 UMAP2 UMAP1 UMAP2 UMAP1 MS5_FS12 in vitro MS5_FS12 in vivo UMAP2 CD14+ cells cDC2 cDC1 Pre/pDC CD34+ cDC2 cDC1 Myeloid CD1c 0 192 CD1c 0 192 FcεRI 0 205 FcεRI 0 205 CD5 0 224 CD5 0 224 CD172a 0 97 CD172a 0 97 HLA-DR 0 880 HLA-DR 0 880 CD86 0 226 CD86 0 226 UMAP2 UMAP1 UMAP2 UMAP1 MS5_FS12 in vitro MS5_FS12 in vivo
b
c
AXL PPP1R14A SIGLEC6 CD22 DAB2 S100A10 FAM105A MED12L ALDH2 LTK GZMB SERPINF1 ITM2C PLD4 CCDC50 IRF7 PTPRS ALOX5AP TCF4 BCL11Ad
AS-DC signature pDC signature cDC2 signature (V illani et al.) Top 10 signature genes (Villani et al.)e
blood CD5– cDC2 in vitro cDC2 in vivo cDC2 blood CD5+ cDC2 in vitro in vivo blood pDC pre/AS-DC 100 50 0 –10 –5 0 5 10 15 log2 FC –log10 adjp-value in vitro cDC2 in vivo cDC2 FCER1A CLEC12A KLF4 GATA2 IRF8 CD5 CD2 BTLA CXCL13 CD207 CD80 LAMP3 CCR7 CCL19 MRC1 CD274 CCL22 MMP9CD80 CD83 CD86 CD40 CCR7 HLA-DRA HLA-DRB5 HLA-DRB6 HLA-DRB1 HLA-DQA1 HLA-DQB1 HLA-DQB1-AS1 HLA-DQA2 HLA-DQB2 HLA-DOB
in vivo cDC2 in vivo cDC2 in vivo cDC2 in vitro cDC2 in vitro cDC2 in vitro cDC2
f
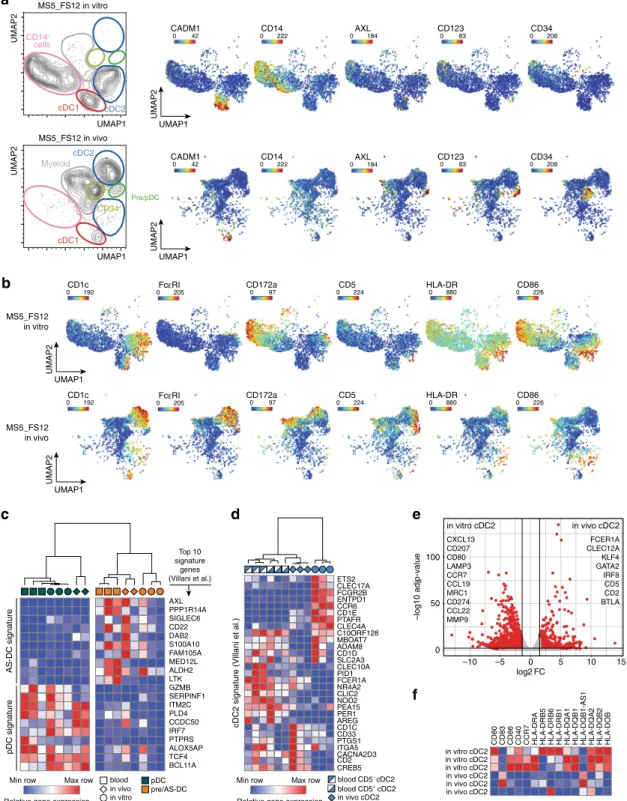
Fig. 7 cDC2 generated in vivo faithfully align to blood cDC2. a UMAP plots of CyTOF data comparing CD45+HLA-DR+cells generated using MS5_FS12 stromal cells either in vitro or in vivo. Relative expression of selected markers is shown for each condition.b Relative expression of selected markers highlighting the phenotypic differences between cDC2s generated in vitro and in vivo using MS5_FS12 stromal cells.c Heatmap displaying gene expression of the top ten genes of blood pDC and AS-DC published signatures20in pDC and pre/AS-DC generated in vitro, in vivo, and isolated from blood PBMC (n = 2 independent donors for pDC and pre/AS-DC generated in vivo and n = 3 independent donors for pDC and pre/AS-DC generated in vitro or isolated from peripheral blood).d Heatmap displaying gene expression of the blood cDC2 published signature20in cDC2 cells generated in vitro, in vivo and isolated from blood PBMC (n = 3 independent donors). e Volcano plot showing differentially expressed genes between in vitro and in vivo generated cDC2 (Log2FC > 1.5, adjustedp-value < 0.05). Statistical significance was calculated using Wald test with a Benjamin–Hochberg p-value correction (n = 3 independent donors per group).f Heatmap displaying gene expression of activation markers and co-stimulatory molecules expressed in cDC2 generated in vivo and in vitro (n = 3 independent donors).
Supplementary Fig. 2a. Cells expressing human membrane-bound FLT3L and SCF were sorted according to antibody staining of the transmembrane proteins (anti-bodies listed in Supplementary Table 3). TPO-expressing cells were sorted according to the expression of mCherry reporter.
Flow cytometry andfluorescent-activated cell sorting. Extracellular staining of cells was preformed in FACS buffer, consisting in phosphate-buffered saline (PBS) (Life Technologies), 1% bovine serum albumin (BSA) (Apollo Scientific) and 2 mM EDTA (Life Technologies). For intracellular staining, samples werefixed and permeabilized using the Cytofix/CytopermTMkit (BD Biosciences) according to
manufacturers’ instructions. Antibodies used in all experiments are listed in Sup-plementary Table 3. Flow cytometry analysis was performed on LSR Fortessa II (BD Biosciences, BD FACSDiva Software) and data were analyzed using FlowJo software (TreeStar, version 10.2). Cell sorting was performed using AriaII (BD Biosciences, BD FACSDiva Software).
Cell lines maintenance and primary cells isolation. MS551and eMSC lines were
cultured in IMDM (Life Technologies) supplemented with 10% heat-inactivated fetal bovine serum (FBS) (Life Technologies), penicillin/streptomycin (Life Tech-nologies), 50μM β-mercaptoethanol (Life Technologies), and maintained at 37 °C
0