Data-Driven Modeling of the Airport
Configuration Selection Process
The MIT Faculty has made this article openly available.
Please share
how this access benefits you. Your story matters.
Citation
Ramanujam, Varun, and Hamsa Balakrishnan. “Data-Driven
Modeling of the Airport Configuration Selection Process.” IEEE
Transactions on Human-Machine Systems 45.4 (2015): 490–499.
As Published
http://dx.doi.org/10.1109/THMS.2015.2411743
Publisher
Institute of Electrical and Electronics Engineers (IEEE)
Version
Author's final manuscript
Citable link
http://hdl.handle.net/1721.1/108688
Terms of Use
Creative Commons Attribution-Noncommercial-Share Alike
Data-Driven Modeling of the Airport Configuration Selection Process
Varun Ramanujam and Hamsa Balakrishnan
Abstract—The runway configuration is the set of the runways at an airport that are used for arrivals and departures at any time. While many factors, including weather, expected demand, environmental considerations, and coordination of flows with neighboring airports influence the choice of runway configura-tion, the actual selection decision is made by air traffic controllers in the airport tower. As a result, the capacity of an airport at any time is dependent on the behavior of human decision-makers.
This paper develops a statistical model to characterize the con-figuration selection decision process using empirical observations. The proposed approach, based on the discrete-choice modeling framework, identifies the influence of various factors in terms of the utility function of the decision-maker. The parameters of the utility functions are estimated through likelihood-maximization. Correlations between different alternatives are captured using a multinomial ‘nested logit’ model. A key novelty of this work is the quantitative assessment of the effect of inertia, or the resistance to configuration changes, on the configuration selection process. The developed models are used to predict the runway configuration three hours ahead of time, given operating conditions such as wind, visibility, and demand. Case studies based on data from Newark (EWR) and LaGuardia (LGA) airports show that the proposed model predicts runway configuration choices significantly better than a baseline model that only considers the historical frequencies of occurrence of different configurations.
Index Terms—Air transportation, air traffic control, air-port runway configuration, discrete-choice models, maximum-likelihood estimation, decision processes.
I. INTRODUCTION
Most modern infrastructure systems involve significant in-teractions between automation and human decision-makers. A key challenge in designing algorithms for these systems lies in reliably predicting the decisions made by the human operators. This paper addresses this challenge in the context of airport operations.
The runway system is generally believed to be a critical bottleneck in airport operations [1]. Most major airports are equipped with multiple runways, and at any time, a subset of these runways (and associated traffic directions) are selected to handle arrivals and departures. This choice of runways, known as the airport or runway configuration, is a critical factor in determining airport capacity [2–5]. Air Traffic Control Tower personnel consider many factors including weather (wind and visibility), predicted arrival and departure demand, environmental considerations such as noise abatement proce-dures, and coordination of flows with neighboring airports, while selecting the runway configuration at any time. Runway
Varun Ramanujam is with Google, Mountain View, CA.
Hamsa Balakrishnan is an associate professor in the Department of Aeronautics and Astronautics at the Massachusetts Institute of Technology.
[email protected]. This research was partially supported by the National
Science Foundation, through the NSF CPS project FORCES, grant number 1239054.
configuration changes require increased coordination between the Tower personnel and the aircraft and ground crews, and therefore frequent configuration switches are not desirable. However, little is known about the relative weightings given to the different factors that influence runway configuration selection.
Airport capacity predictions are a key input to a range of air traffic management functions, ranging from air traffic flow management [6, 7], to airport surface operations scheduling [8], and system-wide simulations [9]. These functions all assume either deterministic or probabilistic forecasts of airport capacities at different times. Since the capacity of an airport at any time depends on the runway configuration, the prediction of the runway configuration is a key step toward forecasting the capacity of an airport at any time. A better understanding of the underlying selection process will, in turn, help better predict the resultant runway configuration.
This paper proposes a statistical model that uses empir-ical observations to characterize the configuration selection process. The approach represents the configuration selection process as a discrete-choice model, and infers the air traffic controllers’ utility functions in making these decisions so as to maximize the likelihood of the observed decisions. The result is a probabilistic prediction of the human agents’ decision on configuration selection, given a forecast of the operating conditions at any time. The objectives of this work are: (1) To determine a model of the configuration selection process, including the utility function that best (in terms of maximum-likelihood) explains the decisions that were made; and (2) use the developed model to predict the runway configuration (and consequently, the runway capacity) three hours ahead of time. The first of the two outcomes helps evaluate the relative importance of different factors (for example, wind, demand, etc.) that are believed to influence the decision process, while the second provides a vital input to air traffic management and simulation tools. A utility function that reflects the preferences of the decision-makers will also enable the design of realistic objective functions for runway configuration optimization. The proposed approach is demonstrated using two years of opera-tional data from New York’s LaGuardia Internaopera-tional Airport (LGA) and Newark Liberty International Airport (EWR).
II. RELATED RESEARCH
Recent research efforts have focused on the development of tools that prescribe the optimal sequencing of runway config-urations, assuming knowledge of their respective capacities, expected airport demand, and prevailing operating conditions influencing configuration feasibility [10–15]. A significant challenge to the practical implementation of such methods is the incorporation of the constraints and objectives of the
2
human operators. For example, it is known that configura-tion changes require significant coordinaconfigura-tion between the air traffic controllers (both at the airport and in the surrounding airspace), pilots and other ground personnel, and increase controller workload; little is however known about the role that “inertia” or resistance to configuration changes plays in the configuration selection process. As a result, tools that suggest runway configuration choices have been found to recommend significantly more frequent changes than was seen in actual operations [16]. Few prior studies have conducted systematic, large-scale evaluations of their results using real data [17]; for example, Oseguera-Lohr et al. simulate 12 days of data from Memphis (MEM), Dallas Fort-Worth (DFW) and New York’s John F. Kennedy (JFK) airports [16]. By contrast, this paper presents an evaluation over one entire year’s (2007) data from New York’s LaGuardia (LGA) and Newark (EWR) airports.
NASA’s System-Oriented Runway Management (SORM) concept is aimed at designing decision-support tools that will improve the usage of limited runway resources [18]. In considering runway configuration management, the concept considers both strategic prediction of runway configuration usage a few hours ahead of time, and tactical decision-support that helps air traffic controllers choose the optimal runway configuration, and even the associated arrival-departure mix. This paper focuses on the former aspect, namely, the prediction of the runway configuration in a given 15-minute period, at a 3-hour time-horizon.
A. Descriptive vs. prescriptive models
Broadly speaking, there are two approaches to modeling decision processes such as runway configuration selection. Prescriptive modelsaim to recommend or prescribe a decision or course of action to the operators. These models are built to optimize some desired objective (for example, delays), con-sidering the feasible options as determined by various opera-tional constraints. Most prior research on airport configuration selection has focused on these types of models [10–15]. As their name suggests, descriptive models are built to describe the current decision-making process, and thereby predict the outcomes of the process. To the best of our knowledge, this aspect has received little attention in the context of runway configuration selection [17], although data mining approaches have been used to forecast airport arrival rates, especially dur-ing Ground Delay Programs [19–22]. The need for descriptive models has been acknowledged in the context of other human-automation decision systems and tasks, including situation awareness and functional allocation [23, 24]. It is important to note that descriptive models can help develop better pre-scriptive models: Delay (which depends on the relationship between capacity and demand) is not the only objective in the decision-making; a better understanding of the importance of other factors such as inertia can enable the development of prescriptive models that are more reflective of operational considerations, and therefore have a greater likelihood of being adopted in practice [12, 16]. Traditionally, descriptive models are labor- and time-intensive, and require extensive site visits, interviews, qualitative analyses, and ethnographic studies [23– 25]. The increasing availability of operational data motivates
the development of data-driven approaches to characterize decision processes. These approaches can easily be automated, and are typically easier to adapt to different operating envi-ronments and application domains. While descriptive models developed using data mining techniques may not be as “rich” as those built from qualitative analyses (and therefore may not be suitable for evaluating features such as cognitive structure and exceptional situations), they may be sufficient for the purpose of predicting nominal behavior.
This paper takes a data-driven approach to the problem of modeling the configuration selection process: a discrete-choice model of the runway configuration selection process is estimated using archived operational data, quantifying the effect of factors that influence the utility function of the air traffic controllers. In short, while prior efforts primarily aim to guide controllers on what runway configurations to select (in order to optimize some predetermined objective such as throughput), this study attempts to model how con-trollers currently select runway configurations, and the relative importance of key influencing factors. The rationale behind this approach is that the actual objective functions are more complex than just delays or throughput, and are learned by controllers through experience. The utility functions of the dif-ferent alternatives are represented as functions of the candidate factors (wind, demand, etc.) that can influence configuration selection. The discrete-choice framework, which has been previously applied to other applications as diverse as modeling driver lane-changing behavior [26], travel demand [27, 28], residential and medical practice location [29, 30], enables the estimation of the relationship between influencing factors and the favorability of a configuration, and the prediction of future configuration choices made in response to evolving weather and demand conditions. The main assumption is that the decisions are nominally driven by an underlying utility function, that is consistent across the range of rational decision-makers. In the absence of such consistent behavior, the models will be poor predictors of system performance. The proposed discrete-choice approach tries to reverse-engineer the utility function that best explains (in the maximum-likelihood sense) the observed decisions, and uses this utility function to predict future decisions.
The rest of this paper describes the problem of runway configuration selection, and the proposed methodology for determining a discrete-choice model of the configuration se-lection process. The approach is illustrated using case studies of LGA and EWR airports, with models that are trained on data from the year 2006, and tested on data from 2007. The results demonstrate the proposed model’s ability to accurately predict the choice of runway configuration, given operating conditions such as wind, visibility, demand, etc.
III. OPERATIONAL BACKGROUND A. Terminology
Runway configurations are typically represented in the form ‘R1, R2 | R3, R4’ where R1 and R2 are the arrival runways, and R3 and R4 are the departure runways. Runways are denoted by their magnetic bearing (rounded off to the
nearest 10◦). Fig. 1 shows the layout of LGA, which has two runways. Each runway has two possible labels, depending on the direction of operations. Therefore, the runway labeled ‘4’ lies at an angle of 40◦ to the magnetic North, while the opposite direction of the same runway (at a 220◦angle to the magnetic North) corresponds to runway ‘22’. Similarly, ‘13’ and ‘31’ refer to the two directions of the same runway, at angles of approximately 130◦ and 310◦ respectively. A given runway can be used at any time for arrivals, departures, or both simultaneously; and in one of two possible directions. In theory, an airport with N runways has O(6N) possible configurations. For LGA (two runways), there are 32 possi-ble configurations. During operational hours (6AM-midnight), only 10 of these configurations are seen to be used in practice [31].
HOLD AT THE ILS HOLD LINE. DEPARTURE, MAY BE INSTRUCTED TO AIRCRAFT TAXIING ON TWY B FOR RWY 4 CAUTION: Y B 73 52’W 73 53’W 4 A A ILS HOLD AIRPORT DIAGRAM
AIRPORT DIAGRAM NEW YORK, NEW YORK
CAUTION:
READBACK OF ALL RUNWAY HOLDING CLEARANCES.
BE ALERT TO RUNWAY CROSSING
INSTRUCTIONS IS REQUIRED. FIELD ELEV 21 EMAS 7001 X 1 50 AA AA AA BB D E G AA C Y YY B AC CY F F F AA G CC DD DD 1 3 YY Y Y DD E BB BB G P P 13 ELEV P R R S R P U AL-289 (FAA) 2 2 ILS HOLD HS 2 J HT A GG B B BG A A FF EB E D B 40 46’N EMAS 31 7003 X 150 7 ELEV 12 ELEV
NEW YORK, NEW YORK
40 47’N HS 1 B A B N N A M M M ZA B ZA B A M ZA ZA ZA J B A D ILS HOLD 15064 15064 121.875 (HELICOPTER) 135.2 CLNC DEL 121.7 263.0 GND CON 118.7 263.0 LA GUARDIA TOWER DEP 127.05 ATIS ARR 125.95 S-80, D-170, 2S-175, 2D-360 PCN 63 F/B/W/T RWY 13-31 S-80, D-170, 2S-175, 2D-360 PCN 63 F/B/W/T RWY 04-22 LA GUARDIA (LGA) LA GUARDIA (LGA) onalltwysandrwys. OperatetransponderswithModeC ASDE-XSurveillanceSystem inuse. PARKING TRANSIENT
& BASE FACILITIES MAINTENANCE AIR CARRIER TERMINAL
& BASE FACILITIES MAINTENANCE AIR CARRIER FACILITIES & BASE MAINTENANCE AVIATION GENERAL NWS TERMINAL AVIATION GENERAL STATION FIRE PARKING TRANSIENT 0.0 E ANNUALRATEOFCHANGE JANUARY2015 045.2 225 .2 13 5.2 31 5.2 H Q C 240 TWR K L L V W Z Z V V AR 1 3 .1 W
NE-2, 05 MAR 2015 to 02 APR 2015
NE-2, 05 MAR 2015 to 02 APR 2015
22
31 13
4
Fig. 1. Layout of LGA airport, showing its runways and their labels [32]. The capacity of a runway configuration refers to the number of arrival and departure operations that the airport can serve in some interval of time, typically 15-minutes or an hour. There is a tradeoff between the number of arrivals and the number of departures than the airport can serve; this tradeoff is represented by the capacity envelope. The capacity envelope of an airport at any time varies by configuration, and also by the prevailing weather conditions [2]. Of particular interest for operational decisions (such as planning Ground Delay Pro-grams) is the Airport Arrival Rate (AAR), which corresponds to the arrival capacity of the airport at any time.
B. Runway configuration selection
The Tower Supervisor or the Controller-in-Charge (CIC) typically have the primary responsibility of determining which runways are active at any time [33]. A variety of factors are considered in selecting the runway configuration, including surface wind direction and speed, wind shear/microburst alerts, coordination with adjacent airport flows, severe weather ac-tivity, and environmental considerations such as noise abate-ment procedures [33]. At many airports (LGA and EWR, for example), the Traffic Management Coordinator (TMC) in consultation with the Supervisor/CIC selects the runway configuration, considering current and forecast weather, opti-mum arrival/departure rates, and noise abatement. The TMC is generally expected to maximize operational efficiency through the proper selection of runway configuration, procedures, and flow control initiatives.
1) Coordination: At metroplexes in which there are several busy airports in close proximity of each other, the coordination requires coordination with the terminal-airspace (TRACON) as well. Letters of Agreement (LOA) between the TRACON and the individual facilities govern the coordination protocols.
2) Documentation: The National Traffic Management Log (NTML) records traffic management activities (including run-way configuration selection) at all major facilities. 77 airports in the United States are required to report their runway configurations and the associated arrival and departure rates on a quarter-hourly basis, which are then archived in the Aviation System Performance Metrics (ASPM) database [34]. The TMC’s responsibilities include the reporting of these and other statistical data [35].
IV. DISCRETE-CHOICE MODELS
Discrete-choice models address problems in which a decision-maker needs to select one option from a finite set of alternatives [27]. The decision-maker is assumed to select the solution that maximizes a utility function that depends on several influencing factors (known as attributes, and denoted by the vector ¯X). The utility function for each alternative is modeled as the sum of an observed component V (which is a linear combination of the influencing factors) and an unobserved component ε represented through error terms. In other words, consider the observation of the nth selection decision. Let Cn be the set of alternatives available for the nth choice. Then, the utility of choice ci∈ Cnis given by
Vin = α + ¯β · ¯Xin (1)
Uin = Vin+ εin, (2)
Equation (1) reflects the assumption that the utilities are linear functions of the attribute vector, ¯Xin, and weights given by the vector ¯β . Equation (2) reflects errors due to unmodelled effects or noise. For the nthobservation, the decision-maker is assumed to select the alternative cj∈ Cnsuch that
j= arg max i:ci∈Cn
Uin. (3)
The error terms, εin, are assumed to be Gumbel-distributed, that is, the p.d.f is assumed to be
f(x) = µe−µ(x−η)e−eµ (x−η ), (4) where η ∈ R is known as the location parameter, and µ ∈ R+ is known as the scale parameter. The Gumbel distribution is used as an approximation to the normal distribution, since it results in computationally tractable analytical expressions for the probability of observing a particular choice [27].
When one assumes that the error terms are i.i.d and drawn from a Gumbel distribution, the resulting model is known as a multinomial logit (MNL) model [27]. The choice probability expression for the MNL model is given by
P(ci|Cn) = eVin ∑j:cj∈Cne
Vjn. (5)
In other words, Equation (5) provides the probability of the nth choice being ci, given that the set of feasible alternatives was
4
Ci. The probability of selecting an alternative ci increases as the observed component of its utility (given by Vin) increases relative to those of the other alternatives.
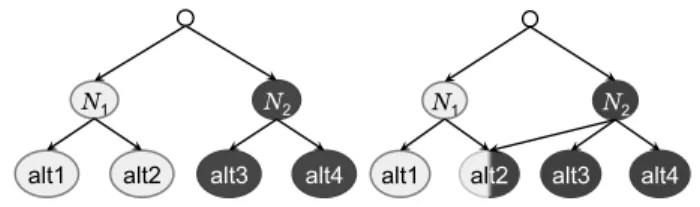
Each 15-minute interval can be assumed to be a unique instance n for an air traffic controller to select the utility-maximizing configuration ci out of the list of feasible con-figurations Cnat that time. However, the assumption of inde-pendent error terms in the MNL model may be too restrictive for this application. For example, if two candidate configura-tions use the same arrival (or departure) runway, their error terms may be correlated due to the same unmodeled effects. Extensions such as the Nested Logit (NL) and the Cross-Nested Logit (CNL) models overcome this challenge [27]. These models permit correlated errors within specified subsets of alternatives, represented by nests. Fig. 2 illustrates four alternatives {alt1, alt2, alt3 and alt4}, grouped into two nests, N1and N2, in (left) an exclusive manner (NL representation), and (right) an overlapping manner (CNL representation) with alt2 shared between the two nests. Choices within a nest have correlated error terms. Under the Nested Logit model shown, alt1 and alt2 would have a common component to the error terms, while alt2 and alt 3 would have independent errors; under the Cross-Nested Logit model shown, alt2 would have a common component of error with alt1, and another common component with alt3 and alt4.
N1 N2
alt1 alt2 alt3 alt4
N1 N2
alt1 alt2 alt3 alt4
Fig. 2. (Left) NL model framework; (right) CNL model framework. The expressions for alternative probabilities for the NL and CNL models, and their comparisons with the MNL model are described in [27]. For example, the selection probability for alternative alt1 in the NL model (Fig. 2 (a)) is given by
P(alt1|{alt1, alt2, alt3, alt4}) = P(alt1|N1)P(N1|{N1, N2}) (6)
where P(alt1|N1) = eµN1Valt1 ∑j:cj∈{alt1,alt2}e µN1Vj, (7) P(N1|{N1, N2}) = eVN1 eVN1+ eVN2, (8) VN1 = 1 µN1 log
∑
j:cj∈{alt1,alt2} eµN1Vj, (9) and so on.The scale parameters µN1 and µN2 reflect the extent of error correlation among alternatives within nests N1 and N2 respectively.
A. Parameter estimation
The model parameters (α, ¯β in Equation (1) and the scale parameters µ in Equation 7) are estimated using the
maximum-likelihood approach. The vector ¯β corresponds to the weighting of different attributes in the utility function. The likelihood of a given dataset of choice observations is the joint probability of observing the sequence of choices recorded. Configuration choice probabilities at different times are assumed to be conditionally independent of one another, given the explanatory factors ¯Xin. Therefore,
L (α, ¯β, µ) = P((c1|C1) \ ....\(cN|CN)|α, ¯β , µ , ¯X) N
∏
i=1 P(ci|Ci)where ciis the selected alternative, and Ciis the set of available alternatives for ith observation, i ∈ 1, 2, .., N.
The parameter estimates (α , bb β ,¯ bµ ) are those that maximize this likelihood:
(α , bb β ,¯ bµ ) = arg max α , ¯β ,µ
L (α, ¯β, µ). (10)
Likelihood-maximization is a nonlinear optimization prob-lem. BIOGEME, a software package that specializes in es-timating discrete-choice models through customized in-built algorithms, was used to carry out the optimization [36].
B. Model specification
Model specification refers to the attributes ¯Xinthat determine the utility function. The specification is developed through iterative consideration of candidate factors. All three types of models (MNL, NL and CNL) of the airport configuration choice process were determined and evaluated. The statistical significance of factors were assessed using the Likelihood-ratio test [27] for nested hypothesis testing, and the Cox composite model test [37, 38] for non-nested hypothesis testing. The Hausman-McFadden test [39] was used to check the statistical validity of the NL or CNL models over the MNL model.
V. CASE STUDIES A. Training data
The proposed approach was used to model configuration selection processes at LGA and EWR airports. The training data set for each airport comprised of records from the Federal Aviation Administration’s Aviation System Performance Met-rics (ASPM) database for the year 2006 [31]. This database reports the chosen configuration as well as other prevailing airport conditions such as weather, demand, etc. for each 15-minute interval during the year. Data from hours between midnight and 6 am were excluded from the data set, since these periods have very low demand, and the reporting is prone to errors. Feasible configurations for each time period were determined by the set of runways that did not exceed the FAA-specified safety thresholds for tailwinds (5 kn) and cross-winds (20 kn). Observations with infeasible runway configurations (likely due to reporting errors) were also filtered from the data.
B. Candidate influencing factors in utility function
There are several factors that potentially influence the choice of configuration (from among the feasible options) in any time period. The following factors were explicitly included in the utility functions of the discrete-choice model:
• Inertia: Configuration changes require extensive coordi-nation among the different airport stakeholders, and are thought to cause a loss in airport throughput [10, 12, 40]. Since maintaining the configuration from the previous time interval is preferable to a significant extent, the util-ity function of the incumbent configuration is expected to be higher than those of the other candidate configurations due to the inertia factor.
• Meteorological Conditions: The prevailing weather con-ditions, indicated by the height of the cloud ceiling and the visibility at the airport, influence the choice of runway configuration. Therefore, the utility function considers whether the airport is operating under good visibility (Visual Meteorological Conditions, or VMC) or reduced visibility (Instrument Meteorological Conditions, or IMC).
• Wind speeds and direction: Observed wind speeds and di-rections are used as attributes in the utility function. Since significant tailwinds are not favorable for operations, headwinds are expected to have a positive effect on the utilities of the corresponding configurations. Significant head winds (winds aloft) may also have an adverse effect on operations by decreasing spacing between pairs of aircraft on final approach, a phenomenon known as compression [5]. As a first step, this paper assumes a single linear term representing the headwind component of the speed along each runway; the methodology can be extended to incorporate different linear terms for head-and tailwinds, as well as compression effects.
• Demand: During periods of high demand, a high-capacity configuration is likely to be favored. Arrival and departure demand are both considered as factors.
• Noise abatement procedures: In order to minimize distur-bance to neighboring communities, many major airports impose noise rules regarding runway use during nighttime hours. In the New York area, these rules are imposed between 10 pm and 7 am; these times are therefore likely to have a negative impact on the utility functions of some affected configurations. Since the hours of midnight to 6 am are not included in the study, only 3 hours a day of the data set are subject to noise abatement.
• Configuration proximity: Configuration changes require increased coordination and disrupt the flow of aircraft on the surface. The workload associated with a configuration change may vary depending on the configurations before and after the switch: For example, a configuration change that only requires the addition of a departure runway may be easier to implement than one that changes the direction of runway operations. The configuration change type, a categorical variable, is denoted by the differences in angles between the arrival and departure runways of the preceding and succeeding configurations. A configuration
change which results in a 90◦reorientation of the arrival runway and a 180◦reorientation of the departure runway is labeled (90◦, 180◦).
• Inter-airport coordination: In multi-airport terminal-areas, flows into and out of the different airports need to be coordinated. In the New York area, John F. Kennedy International airport (JFK), LGA and EWR all lie in close proximity of one another. JFK is the largest of the three airports, annually serving more than 2.5 times the number of operations that either of the other two airports. It is therefore expected that the configuration chosen at JFK at any time influences the configuration choice at LGA and EWR. Categorical variables are used to represent interactions between pairs of runway configurations at JFK and at LGA/EWR.
C. Estimation of discrete-choice models and utility functions The utility specifications and error structures were devel-oped and statistically evaluated, as described in Section IV-B. The resultant models are discussed below.
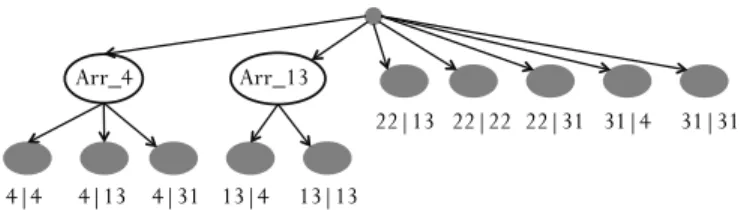
1) LGA model: The training data set had a total of 17,716 choice observations post-filtering (i.e., data from 17,716 time periods), featuring a total of 10 distinct configuration alterna-tives. The final model has a NL structure with two alternative nests, grouping configurations with arrival runways 4 and 13 respectively as illustrated in Fig. 3. The other configurations are modeled as singleton nests.
4|4 4|13 4|31 13|4 13|13
22|13 22|22 22|31 31|4 31|31
Arr_4 Arr_13
Fig. 3. Estimated NL structure for LGA configuration selection (for year
2006).
The results of the utility coefficients are tabulated in Table I, along with the corresponding t-statistics in parenthesis. Parameters whose estimates are judged as not being statis-tically insignificant (the absolute value of the t-statistic is less than 1.96) are shown in red. The results support the a priori hypotheses on the effects of inertia and headwinds, both of which are found to be strongly statistically significant. Further analysis shows that the estimates of configuration proximity and JFK coordination variables are consistent across multiple years. The scale parameters µArr 4 and µArr 13 are estimated to be 1.1 and 1.65, respectively. The discrete-choice model identified for LGA comprises of 36 parameters.
2) EWR model: The training dataset had a total of 23,506 choice observations after filtering, and featured 20 different configurations. The final model had a NL structure with one nest corresponding to the use of an additional arrival runway, as shown in Fig. 4. This nesting suggests that configurations with an additional arrival runway share commonalities in terms of unobserved factors influencing their preferences.
The results of the utility coefficients are tabulated in Table II, along with the corresponding t-statistics in parenthesis.
6
CAUTION: BE ALERT TO RUNWAY CROSSING CLEARANCES. READBACK OF ALL RUNWAY HOLDING INSTRUCTIONS IS REQUIRED.
AL-285 (FAA)
AIRPORT DIAGRAM
AIRPORT DIAGRAM
15064
15064
NEWARK, NEW JERSEY NEWARK, NEW JERSEY
NEWARK LIBERTY INTL(EWR)
NEWARK LIBERTY INTL(EWR)
Z EE EE EE M M M P1 V N P2 E G J P 3 K P 4 W ZL 2 2 2 2 R W Y P P P P L K J G E C P P P P P AA BB CC V N P 2 9 4R 4L AA AA BB CC CC V P A PA PA RB RB FE N N B4 C E E B3 RD RD DK RC RC DL RE RE G DM RF B 2 J J RG B A B B B B B B A A A A A S S R R R B1 K K K RG K L L Y Y Y Y Y W W W W W ZZ Z Z Z RF PA D D D D RNR N RH RH RJ RJ U U U U U U RK RK U B U A Z 3 Z 4 Z3 RL RM W2 W 2 RM Q S A A B B B 118.85 CLNC DEL 121.8 GND CON 118.3 257.6 NEWARK TOWER 115.7 134.825 ATIS D AREA 15 PARKING
FIRE STATION EQUIPMENT P.A. ADMINISTRATION PARKING AVIATION GENERAL PARKING AIRCRAFT AREA 340 1 1 EMAS 17 ELEV 107.9 287.9 6726X150 FIELD ELEV 17 10 ELEV S S S 9 ELEV 9 ELEV HS 2 HS 1 HS 3 T PARK BALL LAHSO S 21 8.7 218.7 038.7 038.7 10000 X 15 0 11 000 X 1 50 G C TERMINAL B TERMINAL A TERMINAL 348 TWR 0.0 E ANNUAL RATE OF CHANGEJANUARY 2015
D-210, 2D-520, 2D/2D2-1000 PCN 96 R/B/W/T RWY 11-29 D-210, 2D-520, 2D/2D2-1000 PCN 96 R/B/W/T RWY 04R-22L D-210, 2D-520, 2D/2D2-1000 PCN 96 R/B/X/T RWY 04L-22R
om all twys and rwys. Operate transponders with Mode C ASDE-X Surveillance System in use.
74 11’W 74 10’W 40 41’N 40 42’N A UP FD W ILBU R AMELIA L INDY 10 ELEV 11 ELEV 2 CAT Q R R RA H V A R 1 2.9 W 410 ZA M
NE-2, 05 MAR 2015 to 02 APR 2015
NE-2, 05 MAR 2015 to 02 APR 2015
4R 4L
22R 22L 29 11
(a) Layout of EWR airport [32].
22L|22R,29 29|22L 29|22R 29|4R 29|4L 11|22R 22L|22R 4L|4R 4R|4L 29|29 22R|22R 22L|22L 4R|4R 4L|4L Extra Arr Rwy 4R,11|4L 4R,29|4L 22L,11|22R 22L,29|22R 22L,22R|22R 22R,29|22L
(b) Structure of estimated nested logic model for EWR.
Fig. 4. Layout of EWR, showing its runways and their labels [32], along with the estimated NL structure for EWR configuration selection (for year 2006).
Estimates for which the absolute values of the t-statistics are less than 1.96 are shown in red. The nest scale parameter µextra Arr is estimated to be 1.45. The discrete-choice model identified for EWR comprises of 57 parameters.
Once again, inertia and wind effects were found to be statistically significant. The estimates of configuration prox-imity and JFK coordination were found to be consistent across multiple years.
D. Model evaluation
The proposed models are evaluated by comparing the con-figuration choice predictions of the estimated discrete-choice model and a baseline model for an independent test dataset. The test set consisted of ASPM records from 2007, refined using the same filters as the training data set (2006 data). The baseline model is described in the next section, following by a discussion of the test results.
1) Baseline model: The use of the discrete-choice modeling framework enables the incorporation of relevant influencing at-tributes like weather conditions, demand, etc. in determination of configuration selection probability. An alternative approach is to compute explicitly, using data, the probability of a particular configuration being chosen, given the configuration in effect in the previous time interval. Such an approach would generate a transition probability matrix ∆, where an element ∆(i, j) would represent the probability of configuration j being chosen in any time interval, given that configuration
i was active in the previous time interval. Peterson (1992) previously proposed such a model for representing airport capacity dynamics [41].
Given Ct ∀t = {1, 2, ...T };Ct ∈ {1, ..., Nc}, where T is the total number of time intervals, Nc is the total number of possible configurations, and Ct is the configuration selected at time t, the transition matrix ∆ is given by
∆(i, j) = ∑ T
t=11(Ct= j)1(Ct−1= i) ∑Tt=11(Ct−1= i)
∀i, j ∈ {1, .., Nc}, where 1(·) is the indicator function that is 1 if its argument is true, and 0 otherwise.
The baseline models were determined using the same train-ing data as the discrete-choice models (ASPM 2006). Tables III and IV present the estimated transition probabilities (∆i, j) for the most prominent configurations at LGA and EWR.
2) Model evaluation results: Considering a typical airport configuration planning horizon, a 3-hour forecast horizon is considered. The discrete-choice model predicts the probability distribution (over all possible choices) of the runway con-figuration in the next time-period. Bayes’ rule can then be used to recursively compute the probability of each runway configuration being selected 3 hours in the future, given the current runway configuration, and demand and weather over the next 3 hours.
For each runway configuration, we also calculate the aver-age (over the test data) probability with which that configu-ration was predicted for time-periods when it was observed.
TABLE I
ESTIMATED UTILITY FUNCTIONS(VALUES OF VARIOUS ELEMENTS OFβ )¯
FOR THE DISCRETE-CHOICE MODEL FORLGA. 1. Inertia
Configuration from previous time step (incumbent) +5.100 (68.8)
2. Meteorological Conditions 13|13 in VMC +1.530 (2.72) 22|22 in VMC +1.830 (2.79) 31|31 in VMC +1.710 (2.20) 4|13 in VMC +1.150 (3.42) 22|13 in VMC +0.800 (2.10) 22|31 in VMC +1.350 (2.71) 31|4 in VMC +1.540 (4.30) 13|4 in VMC +0.830 (1.47) 3. Headwind speed
Relative to arrival runway +0.044 (8.90)
Relative to departure runway +0.029 (5.0)
4. Demand
Configuration that uses both runways (high capacity) +1.650 (9.25)
5. Noise abatement
Runway 31 for morning 6-8 am +1.320 (7.40)
Runway 4 for evening 10 pm-12 am +0.930 (3.8)
Runway 31 for evening 10 pm-12 am -0.290 (-1.30) 6. Configuration proximity
Switch type (90◦,180◦) -1.780 (-7.53)
Switch type (180◦,180◦) -2.200 (-4.40)
7. Coordination with JFK
Departure runways (31@LGA and 22@JFK) +0.959 (4.10)
Departure runways (13@LGA and 31@JFK) -1.050 (-3.59)
Arrival runways (22@LGA and 31@JFK) -1.140 (-5.83)
Departure runways (4@LGA and 4@JFK) +0.440 (1.75) Arrival runways (31@LGA and 4@JFK) -0.400 (-1.7) Departure runways (13@LGA and 22@JFK) -0.588 (-1.69) Departure runways (13@LGA and 13@JFK) -0.404 (-1.37)
Since a perfect forecasting mechanism would always correctly identify the observed runway configuration with 100% cer-tainty, it would have an average prediction probability equal to 1.
The results of the evaluation are shown in Table V for LGA, and Table VI for EWR. Although both the discrete-choice and baseline models consider all configurations reported in the training data (10 for LGA and 20 for EWR), only the configurations that are seen more than 3% of the time are compared in the tables, for the sake of simplicity. The results corresponding to time periods that are not within 3 hours of a switch are shown separately from time periods in the temporal vicinity of (i.e., within 3 hours before or after) a switch. The tables show the average predicted probability of the runway configuration that actually occurred, both near and away from configuration switches. The prediction probabilities in the vicinity of a switch are conditioned on the occurrence of a switch sometime in that 3-hour interval.
E. Discussion, limitations of approach and future research The evaluation results show that the predictions generated by the discrete-choice model are significantly better than those of the baseline model, despite needing considerably fewer parameters. For example, the discrete-choice model for EWR comprises of 57 parameters, as opposed to 400 parameters in the baseline model. Similarly, the discrete-choice model for
TABLE II
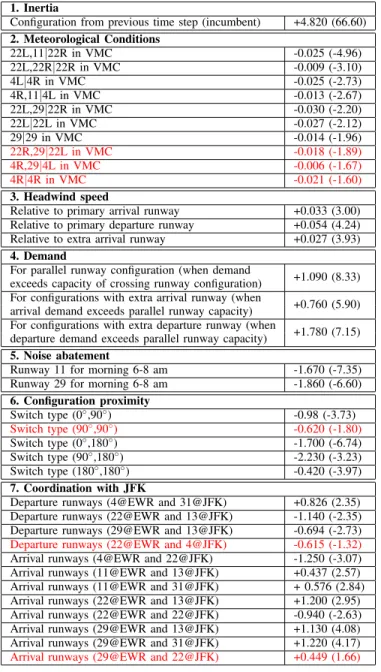
ESTIMATED UTILITY FUNCTIONS(VALUES OF VARIOUS ELEMENTS OFβ )¯
FOR THE DISCRETE-CHOICE MODEL FOREWR. 1. Inertia
Configuration from previous time step (incumbent) +4.820 (66.60)
2. Meteorological Conditions 22L,11|22R in VMC -0.025 (-4.96) 22L,22R|22R in VMC -0.009 (-3.10) 4L|4R in VMC -0.025 (-2.73) 4R,11|4L in VMC -0.013 (-2.67) 22L,29|22R in VMC -0.030 (-2.20) 22L|22L in VMC -0.027 (-2.12) 29|29 in VMC -0.014 (-1.96) 22R,29|22L in VMC -0.018 (-1.89) 4R,29|4L in VMC -0.006 (-1.67) 4R|4R in VMC -0.021 (-1.60) 3. Headwind speed
Relative to primary arrival runway +0.033 (3.00)
Relative to primary departure runway +0.054 (4.24)
Relative to extra arrival runway +0.027 (3.93)
4. Demand
For parallel runway configuration (when demand
+1.090 (8.33) exceeds capacity of crossing runway configuration)
For configurations with extra arrival runway (when +0.760 (5.90)
arrival demand exceeds parallel runway capacity) For configurations with extra departure runway (when
+1.780 (7.15) departure demand exceeds parallel runway capacity)
5. Noise abatement
Runway 11 for morning 6-8 am -1.670 (-7.35)
Runway 29 for morning 6-8 am -1.860 (-6.60)
6. Configuration proximity Switch type (0◦,90◦) -0.98 (-3.73) Switch type (90◦,90◦) -0.620 (-1.80) Switch type (0◦,180◦) -1.700 (-6.74) Switch type (90◦,180◦) -2.230 (-3.23) Switch type (180◦,180◦) -0.420 (-3.97) 7. Coordination with JFK
Departure runways (4@EWR and 31@JFK) +0.826 (2.35)
Departure runways (22@EWR and 13@JFK) -1.140 (-2.35)
Departure runways (29@EWR and 13@JFK) -0.694 (-2.73)
Departure runways (22@EWR and 4@JFK) -0.615 (-1.32)
Arrival runways (4@EWR and 22@JFK) -1.250 (-3.07)
Arrival runways (11@EWR and 13@JFK) +0.437 (2.57)
Arrival runways (11@EWR and 31@JFK) + 0.576 (2.84)
Arrival runways (22@EWR and 13@JFK) +1.200 (2.95)
Arrival runways (22@EWR and 22@JFK) -0.940 (-2.63)
Arrival runways (29@EWR and 13@JFK) +1.130 (4.08)
Arrival runways (29@EWR and 31@JFK) +1.220 (4.17)
Arrival runways (29@EWR and 22@JFK) +0.449 (1.66)
LGA contains 36 parameters (compared to 100 parameters in the baseline model).
The discrete-choice models show that inertia and wind effects are important factors in the decision-making process, and are statistically significant at both airports. While wind speed and direction are well-known to be key factors that influence runway configuration selection [17, 18], this paper represents the first time that the influence of inertia has been quantified.
If the most-likely configuration is chosen for each time-period, the discrete-choice model has an accuracy of more than 85% for LGA, and more than 82% for EWR. By contrast, prior research achieved a prediction accuracy of 75% at LGA and 63% at JFK, respectively [17]. The predicted probability of observed configurations from the discrete-choice model is
8
TABLE III
BASELINE MODEL ESTIMATES FORLGA,FOR THE MOST FREQUENTLY
OCCURRING CONFIGURATIONS. THE COMPLETE BASELINE MODEL CONSIDERS ALL10CONFIGURATIONS REPORTED ATLGAIN2006.
4|4 31|31 4|13 22|13 22|31 31|4 4|4 0.941 0 0.021 0.011 0.002 0.018 31|31 0.001 0.957 0 0.002 0.019 0.019 4|13 0.004 0 0.974 0.013 0 0.004 22|13 0.001 0 0.005 0.980 0.007 0.003 22|31 0 0.005 0.001 0.008 0.972 0.009 31|4 0.003 0.003 0.007 0.003 0.008 0.977 TABLE IV
BASELINE MODEL ESTIMATES FOREWR,FOR THE MOST FREQUENTLY
OCCURRING CONFIGURATIONS. THE COMPLETE BASELINE MODEL CONSIDERS ALL20CONFIGURATIONS REPORTED ATEWRIN2006.
1 2 3 4 5 6 1. 4R|4L 0.983 0.006 0.003 0.006 0.001 0 2. 4R,11|4L 0.019 0.972 0 0.005 0.003 0 3. 4R,29|4L 0.019 0 0.973 0.007 0 0 4. 22L|22R 0.004 0 0.001 0.987 0.003 0.004 5. 22L,11|22R 0.004 0 0 0.016 0.976 0.003 6. 22L|22R,29 0.001 0 0.001 0.040 0.013 0.941
consistently higher than from the baseline model, both near and away from configuration switches. The predicted prob-abilities are lower in the vicinity of configuration switches, chiefly due to the inertia term, which biases predictions towards the incumbent configuration. Configuration changes are relatively infrequent, occurring about 3.1 times per day at LGA, and 2.3 times per day at EWR. Prediction performance also deteriorates for less frequently-used configurations.
The main limitation of a data-driven approach is that it relies on prior observations (in the training data). As a result, it will only predict configurations that have been observed before, and will not apply when there are major changes in the decision process, such as capacity enhancements or new procedures. The reliance on data also implies that the prediction of infrequently observed configurations is difficult.
TABLE V
MODEL EVALUATION RESULTS FORLGA.
Outside temporal vicinity of switches Avg. prob. of prediction
Configuration Frequency Baseline Discrete-Choice
22|13 4403 0.81 0.95 22|31 3725 0.73 0.92 31| 4 2989 0.77 0.90 4|13 2339 0.74 0.91 31|31 1211 0.61 0.70 4|4 599 0.50 0.69
Within temporal vicinity of switches
Configuration Frequency Baseline Discrete-Choice
31|4 1103 0.48 0.71 22|31 1043 0.50 0.74 22|13 1024 0.55 0.76 4|13 569 0.47 0.58 31|31 403 0.31 0.57 4|4 135 0.31 0.44 TABLE VI
MODEL EVALUATION RESULTS FOREWR.
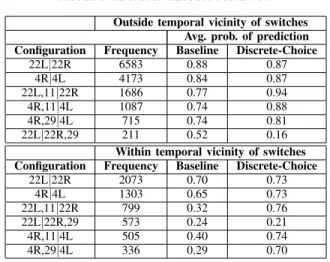
Outside temporal vicinity of switches Avg. prob. of prediction
Configuration Frequency Baseline Discrete-Choice
22L|22R 6583 0.88 0.87 4R|4L 4173 0.84 0.87 22L,11|22R 1686 0.77 0.94 4R,11|4L 1087 0.74 0.88 4R,29|4L 715 0.74 0.81 22L|22R,29 211 0.52 0.16
Within temporal vicinity of switches
Configuration Frequency Baseline Discrete-Choice
22L|22R 2073 0.70 0.73 4R|4L 1303 0.65 0.73 22L,11|22R 799 0.32 0.76 22L|22R,29 573 0.24 0.21 4R,11|4L 505 0.40 0.74 4R,29|4L 336 0.29 0.70
The discrete-choice modeling approach assumes the presence of rational decision-makers who share a utility function that reflects nominal system behavior.
This paper assumed that the demand and wind variables were accurately known at the 3 hour planning horizon. In reality, there are errors in forecasting both these quantities, which will increase as the forecast horizon increases. An important direction of future research is the study of the impacts of forecast errors on configuration prediction.
The results presented here demonstrate the potential of the discrete-choice modeling approach in building descriptive models of the runway configuration process. The methodology can be easily extended to include additional features in the utility function, as well as other decisions, such as combina-tions of configuracombina-tions and procedures. Other potential model refinements are the use of configuration-specific inertia terms in the utility function, terms that differentiate between head-winds and tailhead-winds, and wind gusts. It is important to note that the addition of terms in the utility function will increase the number of parameters, and therefore increase the model complexity. Future work will investigate the tradeoffs between model complexity and prediction performance. Finally, the data-driven nature of the proposed approach also makes it amenable to application at other airports.
VI. CONCLUSIONS
Runway configuration selection is a key driver of airport ca-pacity, and is based on decisions made by air traffic controllers. Accurate forecasts of runway configuration and the resulting airport capacity are key inputs to air traffic management algorithms. This paper proposed a data-driven approach to modeling the configuration selection process using operational data. The dependence of configuration choice on influencing factors like weather, arrival and departure demand, noise mitigation directives, coordination with neighboring airports, etc. was identified and estimated through a utility function. A key contribution was a quantitive assessment of inertia, namely, the resistance to configuration changes.
The proposed discrete-choice modeling framework was ap-plied to two major airports in the New York area, LaGuardia (LGA) and Newark (EWR). Evaluation of the proposed model showed that the average probability of predicting the observed configuration three hours in advance was more than 0.8 for the more frequently-used configurations, during time periods away from configuration changes. Although the predictive performance deteriorated near switches, the average prediction probability for the observed configurations was more than 0.7 for the most frequently used configurations at both airports.
The discrete-choice model required fewer parameters than a baseline Markovian model, and yet yielded better predictions. In addition to determining realistic objective functions and models that can be used to design decision-support tools, the proposed methods present a promising approach to modeling systems driven by human decision processes.
REFERENCES
[1] H. R. Idris, B. Delcaire, I. Anagnostakis, W. D. Hall, N. Pujet, E. Feron, R. J. Hansman, J. P. Clarke, and A. R. Odoni, “Identification of flow constraint and control points in departure operations at airport systems,” in AIAA Guidance, Navigation and Control Conference, August 1998.
[2] E. Gilbo, “Airport capacity: representation, estimation, opti-mization,” IEEE Transactions on Control System Technology, vol. 1, no. 3, pp. 144–153, 1993.
[3] W. D. Hall, “Efficient capacity allocation in a collaborative air transportation system,” Ph.D. dissertation, Massachusetts Institute of Technology, 1999.
[4] E. Gilbo and K. Howard, “Collaborative optimization of airport arrival and departure traffic flow management strategies for CDM,” in 3rd USA/Europe Air Traffic Management R&D Seminar, 2000.
[5] R. A. DeLaura, R. F. Ferris, F. M. Robasky, S. W. Troxel, and N. K. Underhill, “Initial assessment of wind forecasts for Airport Acceptance Rate (AAR) and Ground Delay Program (GDP) planning,” Lincoln Laboratory, Tech. Rep. ATC-414, January 2014.
[6] B. Sridhar, S. Grabbe, and A. Mukherjee, “Modeling and optimization in traffic flow management,” Proceedings of the IEEE, vol. 96, no. 12, pp. 2060–2080, December 2008. [7] G. Lulli and A. Odoni, “The European Air Traffic Flow
Man-agement Problem,” Transportation Science, vol. 41, no. 4, pp. 431–443, November 2007.
[8] Y. Jung, T. Hoang, J. Montoya, G. Gupta, W. Malik, L. Tobias, and H. Wang, “Performance evaluation of a surface traffic management tool for Dallas/Fort Worth International Airport,” in 9th USA/Europe Air Traffic Management R&D Seminar, 2011.
[9] J. Post, J. Gulding, K. Noonan, D. Murphy, J. Bonn, and M. Gra-ham, “The modernized National Airspace System Performance Analysis Capability (NASPAC),” in 26th International Congress of the Aeronautical Sciences (ICAS), 2008.
[10] L. Li and J.-P. Clarke, “A stochastic model of runway config-uration planning,” in AIAA Guidance, Navigation and Control Conference, August 2010.
[11] C. A. Provan and S. C. Atkins, “Optimization models for strategic runway configuration management under weather un-certainty,” in AIAA Aviation Technology, Integration, and Operations (ATIO) Conference, 2010.
[12] C. Weld, M. Duarte, and R. Kincaid, “A runway configuration management model with marginally decreasing transition ca-pacities,” Advances in Operations Research, 2010.
[13] R. Zhang and R. Kincaid, “Robust optimization model for runway reconfigurations management,” in AIAA Aviation
Technology, Integration, and Operations (ATIO) Conference, 2011.
[14] M. J. Frankovich, D. Bertsimas, and A. R. Odoni, “Optimal se-lection of airport runway configurations,” Operations Research, vol. 59, no. 6, pp. 1407–1419, November-December 2011. [15] X. Bai and P. K. Menon, “Decision support for optimal runway
reconfiguration,” in AIAA Aviation Technology, Integration, and Operations (ATIO) Conference, 2013.
[16] R. Oseguera-Lohr, N. Phojanamongkolkij, G. Lohr, and J. W. Fenbert, “Benefits assessment for tactical runway configuration management tool,” in AIAA Aviation Technology, Integration, and Operations (ATIO) Conference, 2013.
[17] S. Houston and D. Murphy, “Predicting runway configurations at airports,” in Transportation Research Board (TRB) Annual Meeting, 2012, paper number 12-3682.
[18] G. W. Lohr, S. Brown, H. P. Stough, S. Eisenhawer, S. Atkins, and D. Long, “System oriented runway management: A research update,” in 9th USA/Europe Air Traffic Management R&D Seminar, 2011.
[19] P.-C. B. Liu, M. Hansen, and A. Mukherjee, “Scenario-based air traffic flow management: From theory to practice,” Transportation Research Part B, vol. 42, pp. 685–702, 2008. [20] S. Chung and D. Murphy, “Developing a model to
deter-mine called rates at airports,” in AIAA Aviation Technology, Integration, and Operations (ATIO) Conference, 2010. [21] G. Buxi and M. Hansen, “Generating probabilistic capacity
pro-files from weather forecast: A design-of-experiment approach,” in Ninth USA/Europe Air Traffic Management Research and Development Seminar (ATM2011), 2009.
[22] R. Kicinger, J. Krozel, M. Steiner, and J. Pinto, “Airport capacity prediction integrating ensemble weather forecasts,” in AIAA Infotech@Aerospace Conference, 2012.
[23] M. R. Endsley, “Toward a theory of situation awareness in dynamic systems,” Human Factors, vol. 37, no. 1, pp. 32–64, 1995.
[24] W. Kaliardos, “Semi-structured decision processes: A concep-tual framework for understanding human-automation decision systems,” Ph.D. dissertation, Massachusetts Institute of Tech-nology, 1999.
[25] J. M. Histon, “Mitigating complexity in Air Traffic Control: The role of structure-based abstractions,” Ph.D. dissertation, Massachusetts Institute of Technology, 2008.
[26] K. I. Ahmed, M. Ben-Akiva, H. N. Koutsopoulos, and R. G. Mishalani, “Models of freeway lane changing and gap accep-tance behavior,” in 13th International Symposium on the Theory of Traffic Flow and Transportation, 1996.
[27] M. Ben-Akiva and S. Lerman, Discrete choice analysis: theory and application to travel demand. MIT Press, 1985.
[28] T. Yai, S. Iwakura, and S. Morichi, “Multinomial probit with structures covariance for route choice behavior,” Transportation Research Part B, vol. 31, no. 3, pp. 195–208, 1997.
[29] D. McFadden, “Modelling the choice of residential location,” in Spatial Interaction Theory and Residential Location, A. Kar-lqvist, L. Lundqvist, F. Snikars, and J. W. Weibull, Eds. North Holland, Amsterdam, 1978.
[30] D. Bolduc, B. Fortin, and M.-A. Fournier, “The effect of incen-tive policies on the practice location of doctors: A multinomial probit analysis,” Journal of Labor Economics, vol. 14, no. 4, pp. 703–732, 1996.
[31] Federal Aviation Administration, “Aviation system performance metrics (aspm) database.” [Online]. Available: aspm.faa.gov [32] ——, “Airport diagrams.” [Online]. Available:
http://www.faa.gov/airports/runway safety/diagrams/
[33] ——, “Facility operation and administration: Chapter 10. terminal operations, services, and equipment,” order JO 7210.3, accessed July 2014. [Online]. Available: http://www.faa.gov/air traffic/publications/atpubs/fac/
[34] ——, “Facility operation and administration: Chapter 17. coor-dination,” order JO 7210.3, accessed July 2014. [Online].
Avail-10
able: http://www.faa.gov/air traffic/publications/atpubs/fac/ [35] ——, “Newark Tower Standard Operating Procedures,” order
JO 7210.17.
[36] M. Bierlaire, “Biogeme: a free package for the estimation of discrete choice models,” in 3rd Swiss Transport Research Conference, 2003.
[37] D.R.Cox, “Tests of separate families of hypotheses,” Proceedings of 4th Berkeley Symposium, vol. 4, no. 1, pp. 105–123, 1961.
[38] D. R. Cox, “Further results on tests of separate families of hypotheses,” Journal of the Royal Statistical Society. Series B (Methodological), vol. 24, no. 2, pp. 406–424, 1962.
[39] J. Hausman and D. McFadden, “Specification tests for the multinomial logit model,” Econometrica, vol. 52, no. 5, pp. 1219–1240, 1984.
[40] M. J. Frankovich, D. Bertsimas, and A. R. Odoni, “Optimal se-lection of airport runway configurations,” in INFORMS Annual Meeting, San Diego, CA, 2009.
[41] M. D. Peterson, D. J. Bertsimas, and A. R. Odoni, “Models and algorithms for transient queueing congestion at airports,” Management Science, vol. 41, no. 8, pp. 1279–1295, 1995.
Varun Ramanujam is a Research Scientist with Google, Inc., Mountain View, CA. He received his PhD in Civil and Environmental Systems from the Massachusetts Institute of Technology in 2012. Prior to that, he received his B.Tech in Civil Engineering from the Indian Institute of Technology, Madras. His research interests include optimization, game theory and mechanism design for resource allocation problems, including air transportation systems.
Hamsa Balakrishnan is an Associate Professor of Aeronautics and Astronautics at the Massachusetts Institute of Technology. She received her PhD in Aeronautics and Astronautics from Stanford Uni-versity. Her research is in the design, analysis, and implementation of control and optimization algo-rithms for large-scale cyber-physical infrastructures, with an emphasis on air transportation systems. She received the US National Science Foundation’s CAREER Award in 2008, the Kevin Corker Award for Best Paper of the USA/Europe Air Traffic Man-agement Seminar in 2011, the American Institute of Aeronautics and As-tronautics’ Lawrence Sperry Award in 2012, and the American Automatic Control Council’s Donald P. Eckman Award in 2014.
![Fig. 1. Layout of LGA airport, showing its runways and their labels [32].](https://thumb-eu.123doks.com/thumbv2/123doknet/14539730.535279/4.918.148.377.372.551/fig-layout-lga-airport-showing-runways-labels.webp)
![Fig. 4. Layout of EWR, showing its runways and their labels [32], along with the estimated NL structure for EWR configuration selection (for year 2006).](https://thumb-eu.123doks.com/thumbv2/123doknet/14539730.535279/7.918.78.854.75.556/layout-showing-runways-labels-estimated-structure-configuration-selection.webp)